| CATEGORII DOCUMENTE |
| Bulgara | Ceha slovaca | Croata | Engleza | Estona | Finlandeza | Franceza |
| Germana | Italiana | Letona | Lituaniana | Maghiara | Olandeza | Poloneza |
| Sarba | Slovena | Spaniola | Suedeza | Turca | Ucraineana |

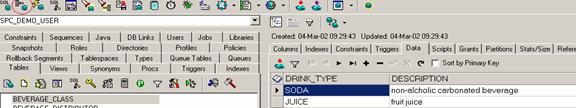
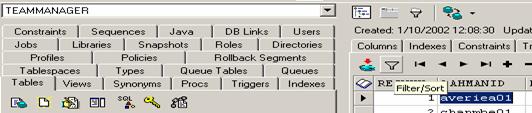
Open the schema browser by clicking on the 2nd Button on the first toolbar that says Schema Browser. The schema you connected as is listed in the drop down box and all the objects are listed by type on the left-hand side of the screen.
Allows simple navigations in the DB
Recognizes that a user with SELECT ANY DICTIONARY has access to the DBA views, but a user with SELECT ANY TABLE might not.
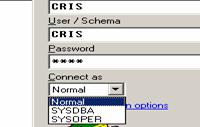
Combo box for SYSDBA and SYSOPER added to Server Login window (for logging in as SYS).
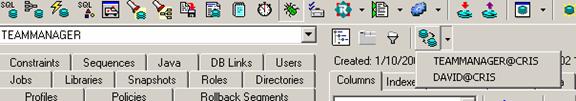
TOAD allows you to connect to multiple instances of Oracle at the same time.
Choose File/New Connection from the main menu and connect as a different user or to a different database. To change between active sessions, either click on the change active database button or go to the Window main menu bar and choose the active session that you want to select. You can use the regular windows features such as tile horizontally or vertically to work in multiple environments.
Options > General: Show task bar at bottom of main window
Task bar shows TOADs open connections
Pressing a button will bring the last window used by a given connection to the front.Right-click menu over the task bar lets you end a connection, commit, rollback, or go to certain windows that belong to the connection
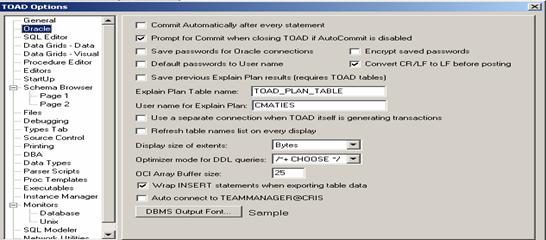
TOAD can be set up with many different preferences to make it you the end user better. Choose View/Options from the main menu bar. The following are some of the options available:
General allows you to set things like if you want the Oracle connection information to show at the bottom of the screen and whether you want to confirm before closing TOAD.
Oracle Automatic Refresh, Load all Table names at login, save passwords
SQL Editor Allow F7 to clear all text, Prompt to save before closing edit window
Data Grids Choose the font style and size for all your data grids, show row numbers on the grid
Procedure Editor Hide the errors panel unless it compiles with errors, use create only instead of create/replace
Start Up Menu Choose which window you want to have open at startup
Schema Browser Show only users that own object, show stats for table
Debugging choose colors for breakpoints and execution point
Printing choose font style for reports
SQL Modeler choose the colors for objects within modeler
Close the Options Window.
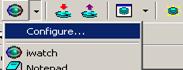
Lets user set up other applications to be launched from TOAD, with command line parameters. Has macros such as $UID (current TOAD user) that can be used in the command line parameters.Accessible from the main toolbar
The Auto Add feature has a few applications such as Notepad that TOAD is hard-coded to look for
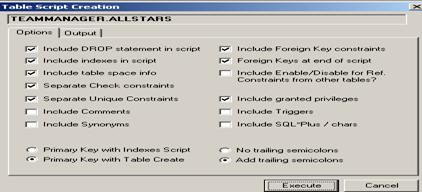
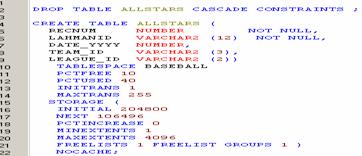
Click on a table then click on the create script button. An options screen will appear, and you can choose things like include drop script, include comments, include constraints or Triggers. For output you can choose to save to clipboard or to a file. Select the options for the script and click on execute. Now on the right side of the screen select the script tab. The script can be copied to an editor where it can be saved, or modified.
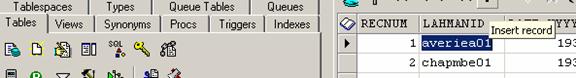
Click on a table name. Now click on the data tab on the right-hand side of the screen. On the data for this table appears. Data on the right hand side can be edited by clicking in the field and typing the new data. New rows can also be added by clicking on the + sign. After editing the data, click on the post edit button. Now refresh the data and the new changes should be listed.
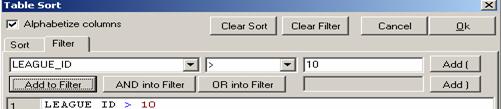
If you have a large amount of data you can use the filter button to limit. Try adding a filter for one of the fields and see how it changes the result set. To clear the filter, click on clear filters button next to the schema name drop down list.
Click on the export data button above the table name. An option box that allows you to choose what columns and where clause can be added. Choose to save to file. Go out and open that file in explorer and you can see the insert statements for that data.
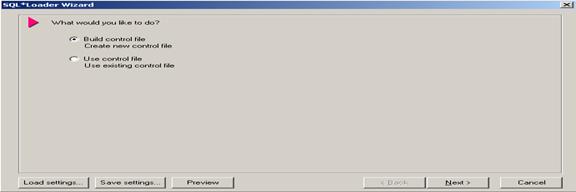
Lesson: 6 SQL LOADER
Converted to a wizard. Most screens look similar to the 7.1 SQL*Loader tabbed interface.Can choose to build control file or execute an existing one.Options on the last screen are similar to Export and Import Wizards: Execute Now (Watch Progress), Schedule, Just Build the Control File. Can specify a date mask for DATE columns. Can specify an Operator for a column (to truncate an input field or add an implied decimal point). Supports tab-delimited data Length field added for character columns. Can specify location of log file. To start DBA- SQL Loader.
Above the table names is the filter button. Click on the filter button.
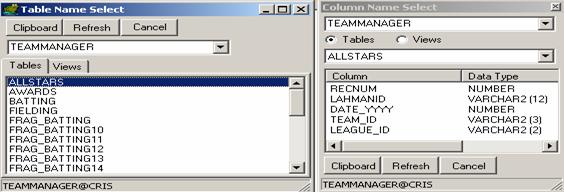
Filters can be added to limit the objects showing up in the browser. This lets you limit by name, Column Names, and Tablespaces. The types of object tabs can also be configured. Anywhere in the tabs on the left-hand side of the screen, right mouse click. A popup menu with all the types of objects will appear. Any object type you want to hide just uncheck it and it will not show up on the schema Browser.
The schema browser gives you lots of information about objects. Lets go through the different details that can be found in Schema Browser.
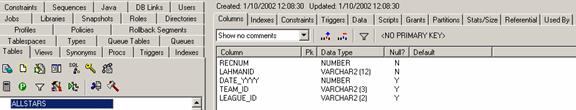
Choose a table on the right and highlight it. Click on the columns tab on the left. This will show all the columns and datatypes for this object. Indexes, constraints, and triggers will be shown for this table on each of the tabs.
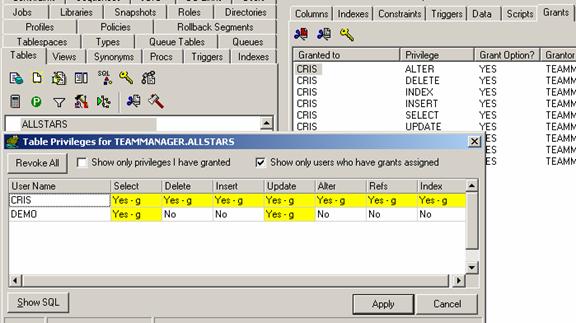
Click on the grant button. You can use the privilege button to give different user access to this object if needed.
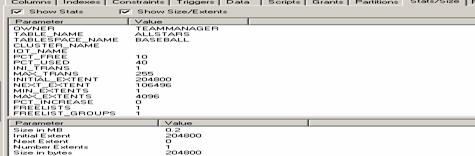
The Stat/Size Tab shows all the storage information for this table.
Click on the Referential Tab to see all the objects that is table references and what is referencing this table. The Used By tab will show you any server side objects that are calling this table.
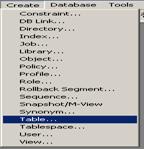
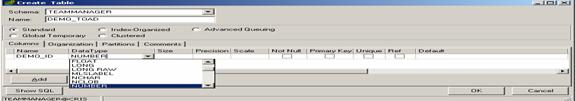
From the main menu, choose Create/Table. TOAD gives you the ability to create new objects with this simple point and click capability. You can choose the tablespace and storage information by adding it in the options screen. The drop if existing button will add the drop object statement at the beginning of the script. Click on the columns tab.
To add columns, simply put in the name of the column and choose the datatype and length and then click on add.
Click on the scripts tab to see the generated DDL. This can then be executed or saved to the clipboard.
Cancel out of the create object window. Other types of objects can also be created off the create menu item.
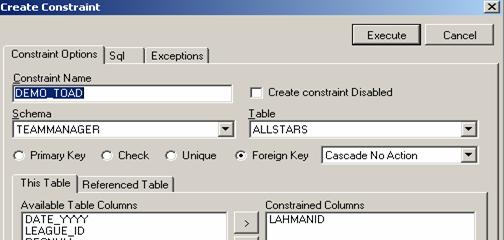
There are several ways in TOAD to add constraints. On the Schema Browser window, choose a table and then click on the button above it that says add constraint. This screen will allow you to select the type of the constraint and the column for the constraint. Click on the SQL tab to see the script that is created. It can now be executed. You can also get to this window by clicking on Create/Constraint from the main menu or right mouse clicking on the table and choosing add constraint.
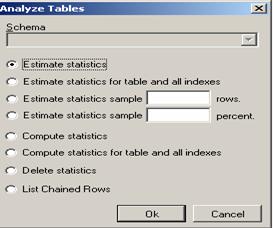
TOAD gives you the ability to run an oracle analyze on any table. Click on the table in the schema browser then click on the run analyze button. All the normal Oracle options for running an analyze like compute or estimate are in the options screen. Click on okay and it will run.
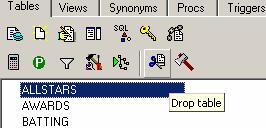
Both of these options are buttons locate above the table name. They will bring up a confirmation screen before they are executed.
The Script Manager is a centralized location in TOAD where you can manage your frequently used scripts. It allows you to organize your scripts into various categories and access them easily from the Script Manager window.
From the File menu, select Script Manager. The Script Manager window displays. On the main toolbar, click the Script Manager (Run Script) icon
By default, 'DBA.sdf' expects TOAD to be installed in 'C:Program FilesQuest SoftwareTOAD', which is the default directory for the installation. If this is your location for TOAD, you can load DBA.sdf and proceed to use the scripts..
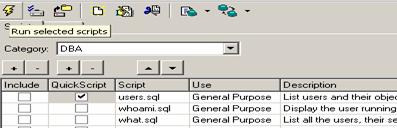
TOAD 7.2 installs 2 pre-built Category files. One points to some scripts in the Oracle 8i Data Dictionary. The other points to some scripts that TOAD 7.2 also installs. When the user first loads the category files, they will have to change the directory for the scripts using the Move function
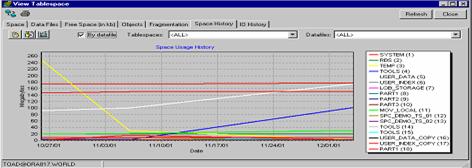
DBA Module .Collects and stores statistics related to tablespace usage.
Make sure the server can run jobs
Grant necessary privileges to TOAD
Log in as TOAD. Open DBA > Tablespaces.
Go to the Space History tab and press Create/Recreate Space Manager tables. This will enable you to set up the repository tables, collection job, and package that are required to use Space Manager
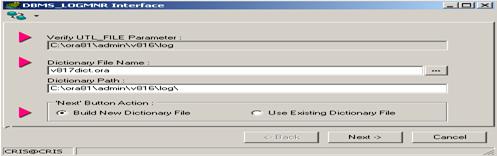
The Oracle LogMiner packages DBMS_LGMNR and DBMS_LOGMNR_D help you extract information from the online or archived Oracle redo logs. This information can be used to analyze where problems occurred. LogMiner lets you easily analyze a database for which System Change Number (SCN) caused a corruption problem, letting you recover to the transaction exactly before the corruption. This package is only available in Oracle 8i and above
Viewing Results in the LogMiner Interface Grid
Click the Options button (![]() ) at the top left of the tab. A list of column options
displays.
) at the top left of the tab. A list of column options
displays.
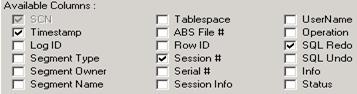
Select the columns you want displayed
3. You can either:
execute the LogMiner SQL immediately: click the Execute button (![]() ). The grid populates with the information you requested.
). The grid populates with the information you requested.
or copy the SQL into the SQL editor
to edit, save and execute later: click the SQL button (![]() ). A new SQL Editor window opens with the SQL loaded.
). A new SQL Editor window opens with the SQL loaded.
Right click over the grid to
Print Grid this option takes you to the Report Link Designer, where you can format and print the grid contents.
Save as this option lets you export the grids contents to a file or to the clipboard.
Filter this option lets you filter the information retrieved into a format more suited to your needs. You can set Boolean filter conditions and Apply them to the grid. Click Cancel or close the dialog to continue. The filter remains on the grid until you open the filter dialog and click Clear.
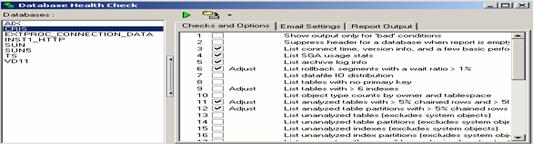
The Database Health Check performs a series of checks on a selected database and displays the results. You can save the results to a color-coded RTF or HTML file, or to a plain text file. You can also send the results through e-mail to another address.
This window lets you select one or more schemas from the left panel and create HTML documentation describing the schema(s) via the Begin HTML Schema Doc Generation button at the top of the screen. Hyperlinks throughout the final HTML document let you jump between sections of the documentation.
All options are saved to and loaded from the TOAD.INI file. Schema selections are saved and loaded on a per-database basis. Tools | HTML Schema Doc Generator.
Open a SQL Editor window by clicking on the first button that says open a new SQL window. The top portion of the screen can be used for typing in SQL statements and the bottom portion of the window shows the results. Type in the simple query select * from tablename at the top and execute it by hitting the F9 key. This could also be executed by clicking on the green arrow button. The tables data should appear at the bottom. Right click anywhere in this data, and choose save as. This will allow the data to be saved to ASCII file. You can also select columns feature which gives you the ability to just check which columns they wanted included in the result set. Clear the top part of the screen by hitting the clear all button.
To edit data, type edit and the table name at the top . The data for that table will appear at the bottom and can be quickly edited by changing any field.
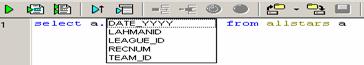
Type in the editor a tablename plus a period. A popup box with all the column names will appear.
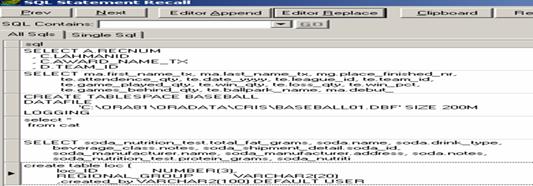
Click on F8 and this will show all the previous SQL statements. Anyone of them can be selected and then click on editor replace and it will change the current statement in the editor to that SQL statement (New option to run anonymous blocks in threads)
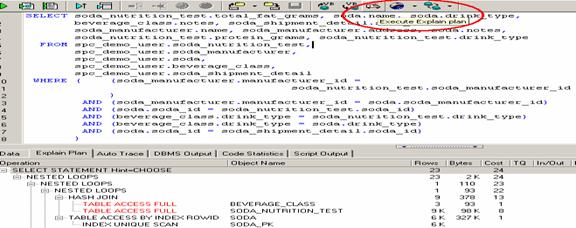
Click on the ambulance button to get an explain plan.
Click on the show columns, and show tables buttons. Each of these will bring up windows that are very useful in coding. Click on any column or table and show how the name appears in the editor. Developers no longer have to recall from memory different table and column names.
There are two functions to
ease copying SQL statements from TOAD to code development tools such as
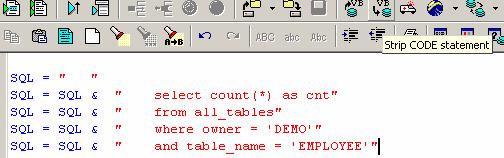
Strip Code Statement will strip off the code development tool syntax from the SQL statement, ready to execute in TOAD. TOAD can also take a SQL statement and prepare it to be saved back to Visual Basic by clicking on the make code statement button. This copies the code to the clipboard and it can then be pasted into Visual Basic.
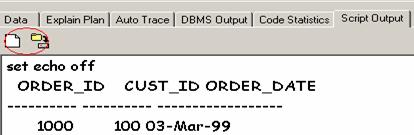
Options to configure font for DBMS Output and Script Output tabs
Script Output tab has Save to File and Clear buttons
Now close the SQL Edit window.
This editor can be used for creating or working on Packages, Procedures, functions, and triggers.
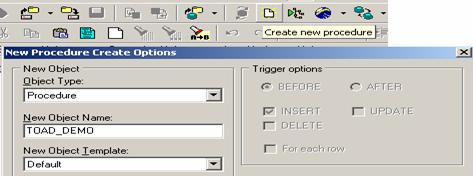
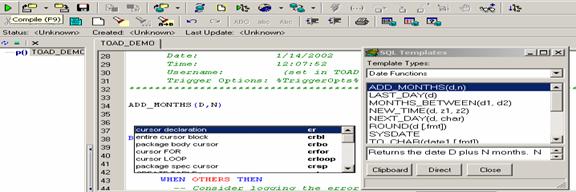
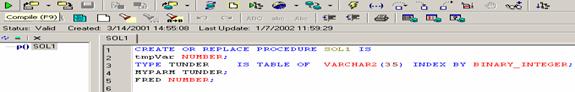
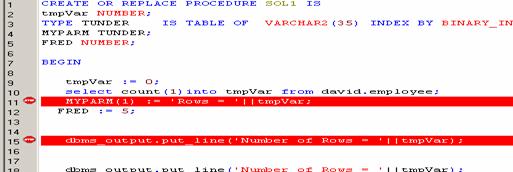
Click on the stored procedure edit window button. The Stored Program Editor will open. Click on the New button. Choose Procedure as the type and demo as the name and click on okay. After clicking on OK, a template of a Procedure will be generated in the editor. These templates are stored in the temp directory in your TOAD Home Directory and can be edited. For example, if you always include your name in the comment section, you can modify the template to include this so you dont have to type it every time.
Click on the SQL Help button next to show columns and tables. The SQL Help window has several different template types. Click on any one of these and look at the description for that template appears at the bottom of the screen. (The date functions are good ones to look at). Drag one of the templates into the edit window.
In the edit window, hit ctrl space bar to get a popup menu of code snippets. Click on the while and see how TOAD adds this to the editor.
To compile an object, click on the green arrow. If Oracle encounters an error, we will stop on that line and show the error number at the bottom of the screen along with the message.
To work on currently saved sever side objects; click on the load from source button
Click on Edit on the Main Menu and select editor options. A popup box with all the different editor options will appear. Some of the following are options available:
Highlighting allows user to customize the highlighting of code
Key Assignments allows you to assign a sequence of keys to a particular operation.
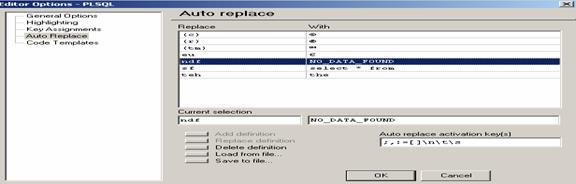
Auto Replace when typing in an editor, you can replace what you type automatically with whatever is in this screen
Code Templates allow shortcuts for reusable code.
Bring up an editor and press the ctrl space bar. Select the cursor for and watch how TOAD will insert the code.
Type in ndf in one of the editors. This is an example of an auto replace feature.
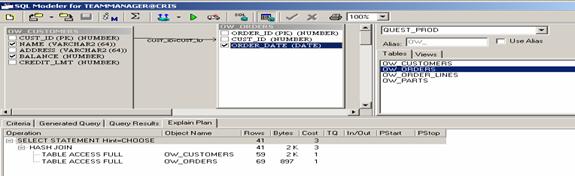
Off the Main menu, select Database/SQL Modeler. This tool can be used to create DML. Select the schema from the pull down on the right. The list of tables from that schema will display. Drag and drop the desired tables to the gray window to the left. To create a join, click on the name of the column in one table and drag-n-drop it on the appropriate column of the other table. If Foreign Keys are already defined, the modeler will automatically show a line between them. To select columns, double click on the column name. The order of columns can be changed by dragging the column headings to where you want them to be. Where clauses and groups by can be added by clicking in the box next to the condition column that you want to add a clause to.
After you have made all the selections for the query, click on the Generated Query to show the SQL that was generated then click on green arrow button to execute. The Query Results tab will show the data returned and the Explain will show the explain plan for the SQL. Close the SQL Modeler window.
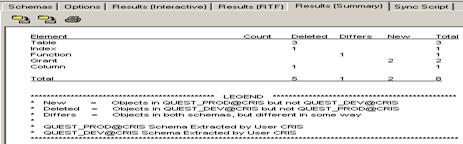
Click on View/Schema Differences from the main menu. This feature gives you the ability to compare 2 schemas either on the same instance or on different instances. Choose the 2 schemas that are going to be compared then click on go.
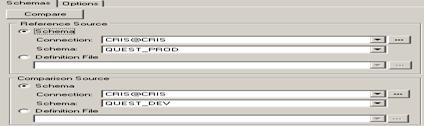
The tabs below will show in detail the differences between the objects in the schemas. The results can be printed or saved to a file. Close the Schema Difference Window.
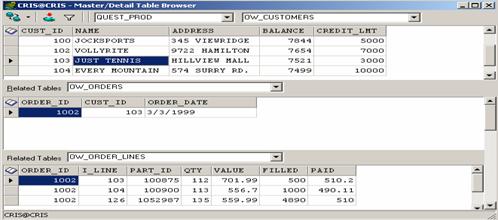
This browser is another way to view and edit your data. This feature shows the foreign key relationship between data. Go to the Tools on the main menu and click on Master/Detail Browser. Choose a schema with related tables. In each of the boxes for related tables, choose a related table. As you click on different rows of data for the main table the related data in the other tables will show. This gives you the ability to see what data is related between tables.
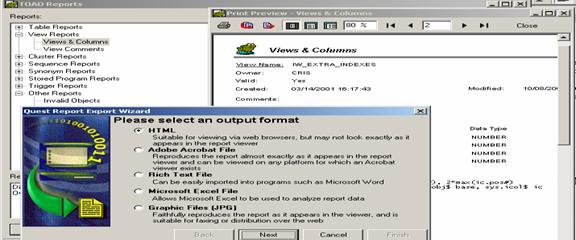
TOAD comes with several useful reports. Click on the View/Reports option off the main menu. Reports can be run for tables to get columns, constraints, indexes etc. A DDL report can be generated which shows whether each object for a particular schema is valid /invalid, create date and last updated date. An Extent report can be run for selected objects to show you the total space, initial extent and next extent size information. A view report will show the view syntax for all the views in selected.
Reports can be printed or saved to a file.
Debugger will help you in debugging your stored procedures, packages, functions, and triggers. Using Debugger, you can set breakpoints, step through the execution and watch variables. The first step to open a procedure editor window. Click on the Load Source from existing object button. Open a function, procedure or package to be debugged. Click on the green arrow to compile.
Now the object has been compiled with debugger information and the function now appears and we can start to debug it using many of the features of Debugger.
Breakpoints can be set to stop the execution of the code in a particular place.
To Add Breakpoints, put your cursor in the dark gray area to the left of the screen on the line that you want to add a breakpoint at and click once. The line will turn red and you know that a breakpoint has been set. Another way to set breakpoints is to click anywhere on the line, right mouse button click, and choose Debug/Set Breakpoint. The F5 key can also be used.
To Disable breakpoints, choose Debug from the main menu, breakpoints. A popup menu with the breakpoints will appear. Double click on one of the breakpoints and another window will appear. To disable the breakpoint, uncheck the enable at the bottom of the window.
We can also set conditional breakpoints.
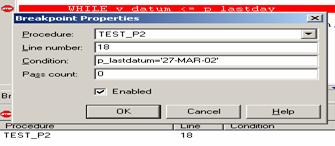
Conditional breakpoints are good for code that may have loops and you do not want it to stop at every execution. You can set up conditional breakpoints so that execution only stops when a variable is greater than some value. You can set breakpoints that ONLY break if a certain condition is met. Select a breakpoint in the Breakpoints window, right click, Edit Breakpoint. Enter the condition for the breakpoint, e.g, 'salary_in > 5000'. When running, the debugger will stop on the breakpoint ONLY if the condition is met.
Pass Count Breakpoints can be set so that breakpoints break ONLY after a certain number of passes in a loop has occurred. In this case, the debugger will NOT stop on the breakpoint line until just before the breakpoint line for the nth pass count. The pass could be a FOR loop, DO WHILE loop, IF/END IF, etc. It is not dependent on any 'COUNTER_VAR' value. If both Condition and Pass Count are specified, the break will ONLY occur the nth time the condition is met.
Watching variables during the execution and modifying the values for them can be very useful in debugging code. In the status window, variables can be watched when breakpoints are set. The value for the variable will be before the breakpoint line of code is executed. Watches are also only listed when they are in the scope of what is being executed. For example, if debugger steps into a function from a procedure, the watches setup for the procedure will not be shown.
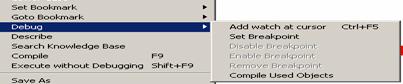
To set up a new watch, right click anywhere in the variable and choose Debug/Add watch at cursor from the popup menu. You can also put your cursor on the variable and choose Debug from the main menu/Add watch at cursor. The last way to add a watch is using the Ctrl F5 keys.
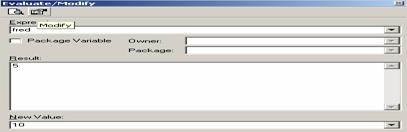
TOAD gives you the ability to modify variables to see the result by putting in new value then clicking on modify and saving the results. To modify a variable to test later code, at a breakpoint, choose Debug/Evaluate modify from the main menu. TOAD will show you the current value and then just type in the new value and click on modify.
There are several options when executing code in debugger. Code can be stopped from executing, stepping over, stepping into, stepping out, and run to caret. Stepping over code gives you the ability to execute a function or procedure within another procedure without going through each line of code in the sub-procedure. To continue the execution after stepping over the sub-procedure, select run.
Stepping into code can be used if you are trying to debug a sub-procedure or function. It will actually bring the code for the sub-procedure into the editor and users can step through each line. Use the Step out button to take you back to the main procedure.
The run to caret option gives you the ability to only execute up to where the cursor is located. This is like a temporary breakpoint. The execution status window always shows the call stack.
The first step in executing code is to setup parameters. Then click on the lightning bolt to go to the first breakpoint. You can continue to execute by clicking on the execute button.
![]()
Oracle8i (the Profiler is now enabled on 9i) provides a Probe Profiler API to profile existing PL/SQL applications and to identify performance bottlenecks. The collected profiler (performance) data can be used for performance improvement efforts or for determining code coverage for PL/SQL applications. Code coverage data can be used by application developers to focus their incremental testing efforts.
The profiler API is implemented as a PL/SQL package, DBMS_PROFILER, that provides services for collecting and persistently storing PL/SQL profiler data.
With the Probe Profiler API, you can generate profiling information for all named library units that are executed in a session. The profiler gathers information at the PL/SQL virtual machine level that includes the total number of times each line has been executed, the total amount of time that has been spent executing that line, and the minimum and maximum times that have been spent on a particular execution of that line.
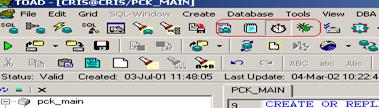
Start TOAD, select the Database > PL/SQL Profiling menu option to turn on the profiler, or click the Toggle PL/SQL Profiling button in the main TOAD toolbar. The icon for the button is a stopwatch.
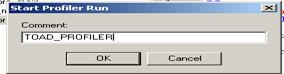
Execute a procedure from the Schema Browser OR the Procedure Editor using the Execute (lightning bolt) button. You will be prompted to enter a description of the procedure being executed. This will show up in the Profile Analysis window when you are analyzing the results. Run the procedure several times to get some data into the profiling tables. Turn off profiling if you want at this point. Be careful to not leave the profiler toggled on when you switch to other TOAD windows. Otherwise, profiler data will be collected from the queries TOAD performs to populate those windows.
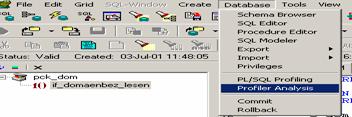
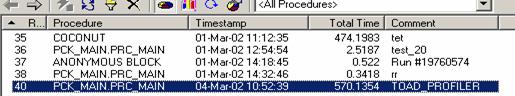
Select the Database > Profiler Analysis menu item. The Profiler Analysis window will display. There are three levels to the data. The top level are the individual 'Runs' of each procedure executed while profiling was enabled. Double-click on one item for the execution stats for that individual run. At this level, you can double-click to see the line-by-line performance times for individual procs called during profiling.
The top half of the window is a pie chart (or bar chart) showing the percent of time required to run each component of the procedure.
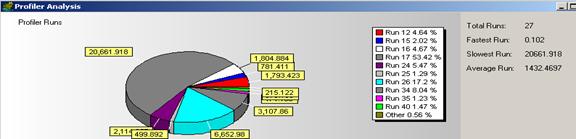
The bottom half of the window lists the runs, including Run Number, Procedure, Timestamp, Comment, and Total Time to execute.
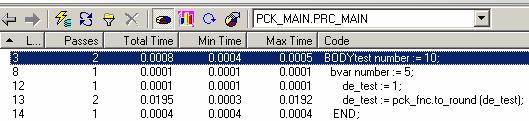
When drilling down on this CRIS.PCK_MAIM.PRC_MAIN unit, we see the lines of code executed and profiled. The column headers change to Line Number, Passes (how many times each line of code was executed), Total Time to execute the line, Min Time, Max Time, and the line of Code itself.
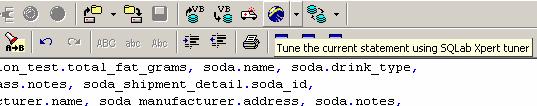
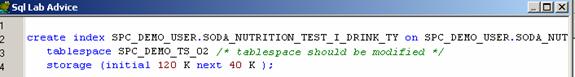
Open a SQL Editor window. Choose File/Open File from the main menu. Open the file TrainingTuner.sql. This should open up a SQL statement in the editor for tuning. Select the tuner button and choose Tuner. A Tuner session will be opened with the SQL statement copied into it.
The instance name that you are working with will be shown in the instance box. This can easily be changed by clicking on the plug and connecting to other instances. This makes it very easy to tune a statement on multiple instances.
SQLab Tuners explain plan augments Oracles standard plan with additional information, and the plan also allows you to step through the order of execution. In the plan, full table scans display in red, and filter and join syntax display in blue. In a separate panel, tables and views are automatically described. The plan also provides context-sensitive information on SQL operations.
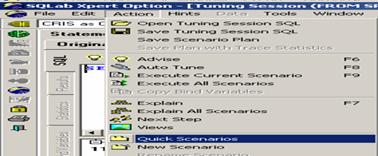
On the main menu, select Actions, Quick Scenarios. Sqlab will generate four additional statements that include rules, all rows, first rows, and ordered hint.
We can now view what the explain plan is for each of these criterias. Click on each of the four tabs to view the information.
In Tuning Sessions, you can also create your own scenarios. When you create a new scenario, the original SQL statement is placed in the new scenario for tuning. You can also change the name of the current scenario at any time using the Actions|Rename Scenario command.
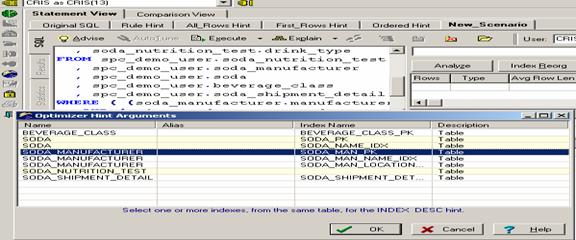
To create a new scenario, Select the Actions, New Scenario menu item, and enter ownhint for the name for the scenario. Click OK, and watch while the new scenario appears as a tab just after the quick scenarios. To add a hint to this scenario, select one from the Hints menu. Lets select the index desc hint for this lab.
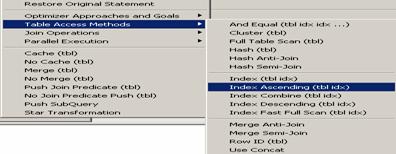
Sqlab will prompt you for the index to use, select the one on dept. Once youve added a hint, you can explain the scenario.
To use the Xpert feature, enter a SQL statement into the Tuning Session lab, explain the statement, and click the Advise button. Xpert presents a list of SQL and/or index changes that should improve the performance of the statement. Each piece of advice includes various options or ways that you can choose to apply the advice. Xpert preselects these options, yet you can override the preselection to create your own combination of ways for applying the advice. For context-sensitive help on a piece of advice, click the Advice Help button.
Once Xpert gives its advice, you can look at the logic it used in formulating the advice. You can also put the advised SQL syntax into a Lab session where you can execute and examine statistics for the execution. You can save to a file the CREATE syntax that Xpert advises so that you can open it in an editor and then commit the schema change.
Generating SQL button will have Xpert rewrites the syntax for your SQL statement and then places the syntax into the Lab. Xpert also generates syntax for an advised schema object change and places it in SQLab Tuners editor for committing to the database.
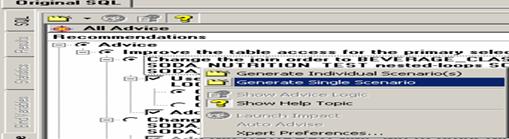
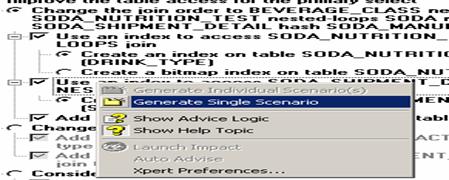
When Xpert advises a change in the SQL statement, it also formats the syntax for rewriting the SQL and then places the syntax into a scenario tab folder in the Lab. This allows you to use the Labs features to examine the effectiveness of the advice. In the Lab, you can execute the rewritten statement, examine comprehensive statistics for the execution, and use several comparison features that display differences between your tuning scenarios and the original SQL statement. To generate SQL in the Lab: Click on the advice button above the SQL on the original SQL tab. There are two tabs in the advice window. The first one gives you advice for rewriting the SQL. The observation tab gives advice on schema changes that could improve the performance.
Xpert allows you to examine the underlying logic it uses to formulate its advice. The logic is listed as a series of observations that were considered at the time that the advice was formulated. Highlight Use Hash(e), To see the logic for this advise, Click the Show Logic button. A window opens to list observations that Xpert considered when recommending the advice.
Xpert allows you to examine other tuning options that it found but did not advise. You can find these listed under the Observations tab. The observation list provides another angle for your SQL tuning work. By examining other options that Xpert found and applying your knowledge of the data and SQL source application, you can often find a viable, tuning strategy. Now lets generate the SQL that the advice is showing us. Click the Generate SQL button. Xpert puts the new statement syntax into a scenario tab folder in the Lab. The tab on the folder is labeled From Xpert so that you can differentiate between it and your original statement. Now you can explain, execute, and compare the statements performance against the original statement.
When Xpert advises schema object changes, it also formats the syntax for creating the index and places it into SQLab Tuners editor. There you can make adjustments to the naming and then execute the statement. You can then examine the results of the change on a development or test instance using the Tuning Session lab.
Once you execute and examine the rewritten SQL syntax in the Lab, you can return to Xpert for more advice based on the new SQL syntax. Click the Advise button in the Tuning Session lab to return to the Xpert screen.
For each change you make to your SQL statement, Xpert provides new advice appropriate for the modified statement. From the Xpert screen, click the ReAdvise button to examine the new advice. Then choose the options you are interested in, generate the SQL, and repeat the process until you have several tuning scenarios in the Lab. The goal is to create the most efficient SQL statement for the given application and the given environment.
After executing a schema object change that Xpert advised on the database, you can return to the Tuning Session lab, re-explain and re-execute the original SQL statement against the new schema. At that point, you can also return to the Xpert screen, click the ReAdvise button, and examine new advice for the SQL statement based on the schema object change.
The AutoTune functionality automates the tuning process by generating those SQL rewrites that offer the highest likelihood of improving your SQL statement. This set of rewritten SQL statements are placed into individual tuning scenario tabs, explained, executed, and ranked by their degree of improvement (as measured against your chosen SQL optimization goal).
Although Xpert may consider a large number of potential changes (rewrites) for your SQL statement, only the rewrites that result in distinct execution plans are presented in the Tuning Session as scenarios. Once the set of rewrite scenarios is produced, you have the option of executing them with or without a row retrieval limit.
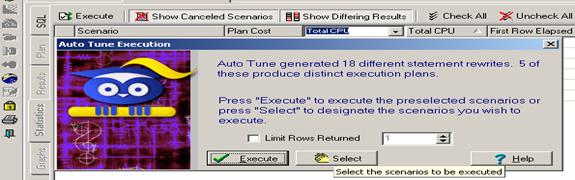
Select the Actions|Execute All Scenarios command to automatically execute the original SQL statement and all of its scenarios.
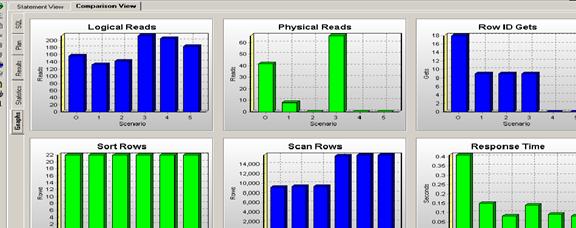
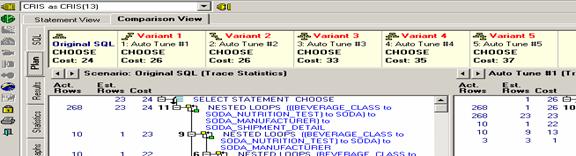
SQLab Tuner executes the original SQL and each of its modifications, and then it opens the Comparison View|Graphs. The graphs allow you to see at a glance how the statistics compare between the modifications. The graphs compare the following statistics: logical and physical reads, ROWID gets, sort and scan rows, and response time. You can enlarge the graphs to make them easier to read.
The response time for your online applications may be important to you. Depending on your tuning objectives, the number of logical and physical reads may be important to you. Adding a hint to a SQL statement may cause better response time and lower ROWID gets.
Tuning Sessions comparison view allows you to compare statistics of the original SQL with the other scenarios so that you can find the best tuning solution for a SQL statement.
Click on the Statistic Tab on the left side of the screen. The statistics page gives us lots of useful information like the number of physical and logical reads, scanned rows and blocks, and total CPU.
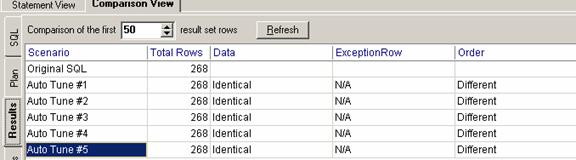
Click on the Result Tab. This will give you information about the result set that your queries are returning. It is very important that while you are tuning you are not changing the data that is returned. There are two columns in the result tab. The first is the data. We want to make sure this is identical. The next column is the order. This will show whether the data being returned is in the same order.
Now, click the Plan tab. This shows a side by side comparison of the plans and how each are different. The top section show the cost of each plan and which ones are identical.
You can print the comparison information. Printing can be helpful when providing others, for example a development manager, with statistics and graphs of SQL activity on the system.
Lesson 1: Starting Impact
To start the stand alone product, Choose SQL Impact from the Quest Software program group.
OrDouble-click on the file sqlimp.exe in the Windows Explorer. Type in your username, password, and database name. If you have not installed the SQL Impact repository into the database, you will be asked if you wish to do that now.
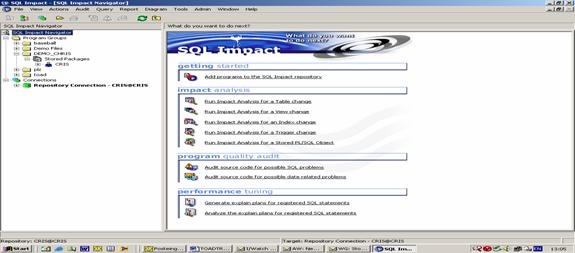
If your database connection is successful and the repository is installed, the Navigator screen will open. Initially the Navigator shows a tree list on the left, and a menu of choices on the right. Anytime you select the topmost node of the tree (SQL Impact Navigator) this menu will show.
Lesson 2: Examining Program and Database Access
The Navigator screen is an important component of SQL Impact. The Navigator displays all program and database relationships for your registered code including all accesses to databases. The Program Groups folder shows these relationships from the point of view of the program objects, and the Database Objects folder shows these relationships from the point of view of the database objects.
First, we will take a look at the Demo Files program group to see the programs that are registered.
Select the Program Groups folder. The programs registered show in place of the menu.
The tree expands and contracts by using the + and keys, clicking the plus and minus boxes displayed in the tree, or by double-clicking an item. Click the plus box of the Program Groups folder. The folder expands and displays the available program groups. Program groups can be created when registering code and are just logical groups of programs. Expand the Demo Files item to display the programs in the demo files. Note: If the Demo Files program group does not appear in the Navigator, you need to register the demo files. Use the Admin menu to automatically register the files by clicking the <Repository Setup> Install Demo Tables item. By drilling down the Program Groups folder, you will see various folders and objects. These represent:
|
Type of object |
Folder in tree |
|
Programs registered |
Program Groups |
|
Programs that reference the given program or source code objects |
Referenced by |
|
Source code objects accessed by the program |
Source Objects Referenced |
|
Accesses to database objects from a given program |
Database Access |
|
Database Functions |
Database Functions |
|
Database Triggers |
Database Triggers |
|
Tables |
Tables |
|
Views |
Views |
Expand the Demo Files, until the lowest levels become visible. Using the Navigator, you can explore all objects in the database and find which programs access them. When you change an object in the database, you can find all programs, shell scripts, and SQL scripts that will be affected by the change and then modify them to avoid the possibility of program run-time failure. Collapse the Demo Files item.
Lesson 3: Examining Details for a Column
Now we will take a look at a specific column in one of the tables. Suppose that you are about to make a required change to that column to increase its size. You can use SQL Impact to search for all programs that will be affected by the change.
To find all programs that access a column, expand the Database Objects item
in the Navigators tree view (the left box). Expand the Schemas item, and then expand the user who owns the OW tables. The OW tables are owned by the user who installed the SQL Impact repository. Expand the Tables item.
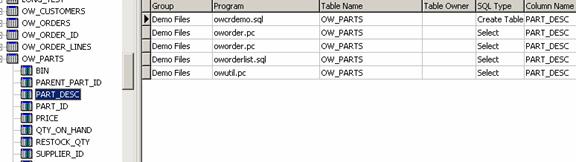
Notice how the panel on the right-hand side of the Navigator changes to display information about the programs that access the table. Expand the OW_PARTS table, and you will see the columns within the table. Click the PART_DESC column and you can see all of the programs that access the PART_DESC column in the Navigators list view. These programs are using the PART_DESC column explicitly. From the Navigators list view, you can examine the source code and the SQL statement, or run an execution plan to look at the SQL statements performance. These tasks are next in the walk-through.
Lesson 4: Viewing the Source Code for a Program
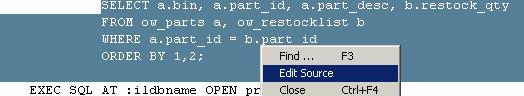
Look at the programs that access the PART_DESC column. You will see that PART_DESC is selected in a Pro*C program named owutil.pc. In the Navigators list view, you can look at this programs source code. As an example, you might look at the source code to see if the variable that the column is selected into is large enough to accommodate an increased size of the part description.
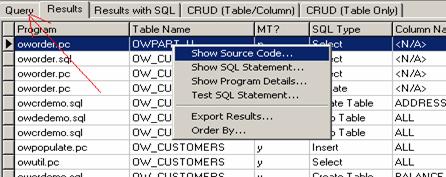
In the list view, right-click the line for the owutil.pc program, which brings up a menu.
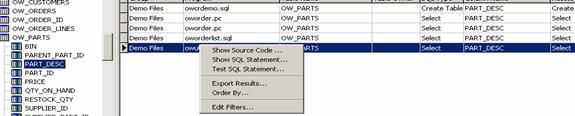 Select Show Source Code from the menu.
An editor window appears, displaying the source code for owutil.pc. Notice how the referenced SQL statement has been highlighted for you.
At this point, if you had checked out the source code for editing via a source code control package, you could edit the code. A second right-click opens an editing menu for this purpose. SQL Impact uses the default Windows editor for the type of file being edited.
If an editor has not been associated with the file type, Windows Explorer opens so you can select the file and open it in the editor of your choice. The editor that you choose becomes the default Windows editor for that type of file.
Close the editor window after taking a look at the source code for owutil.pc.
Lesson 5: Viewing the Explain Plan for a SQL Statement
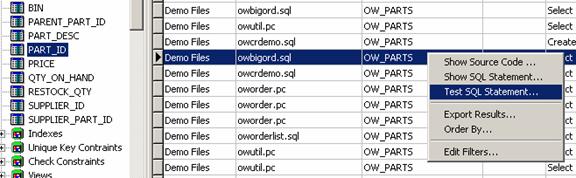
Now look at the PART_ID column under the OW_PARTS table. Consider that you want to assess the effect of adding an index to this column. To do this, you would look for SQL statements with WHERE clauses that access the column.
Select the PART_ID column in the Navigator tree view. Find the owbigord.sql script in the Navigators list view (right box). Scroll to the right to display the Access Type column to see if the owbigord.sql script has a WHERE entry.
Right-click on the line and choose Test SQL Statement from the pop-up menu.
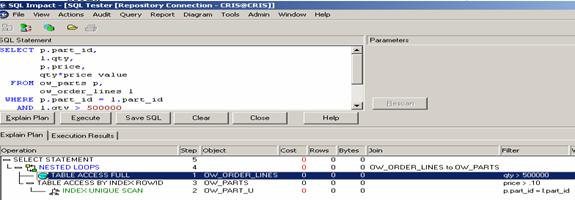
The SQL Tester window appears, displaying a formatted version of the SQL statement as well as its execution plan (which is created using Oracles Explain Plan command).
SQL Impact examines the execution plan and inserts comments if a statement
s performance might be improved. In this example, the query is doing a full table scan. Adding an index could be a good idea.
Using this window, you could also execute the SQL statement and, if the statement is a select, display a result set. If the query had bind variables, the name and data type for each variable would display in the right part of this window.
You also could enter new parameters for the bind variables and then generate a new plan. A semi-colon is not required to terminate a SQL statement, and you cannot test more than one statement at a time.
To continue the walk-through, close this SQL Tester window.
Note: You can access the SQL Tester at any time from the Tools menu. This gives you the opportunity to test and execute any SQL statement you like. For more information, look up Using the SQL Tester.
Lesson 6: Filtering Database Access Details
SQL Impact allows you to create filters for the Navigators list view. The product comes with the several predefined filters, but you can add to this list at any time.
|
To display |
Choose this predefined filter |
|
Only those statements found in the latest version of each registered program. |
Latest Version Access |
|
All SELECT, INSERT, UPDATE and DELETE statements. |
Select, Insert, Update, Delete |
|
All INSERT, UPDATE and DELETE statements. |
Table Change |
|
All SELECT statements. |
Select |
|
References to columns in ORDER BY clauses. |
Order Bys |
|
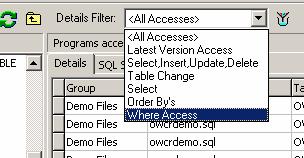
References to columns within WHERE clauses. |
Where Access |
To choose a filter, make sure the tree view is still highlighting the PART_ID column you were using previously. Click the drop list arrow of the Details Filter field in the toolbar of the Navigator screen. Choose the Where Access filter.
Doing this, you cause the list view to display only those programs that reference the PART_ID column as part of a statements WHERE clause.
Lesson 7: Creating an Entity Relationship (ER) diagram
The entity-relationship diagram offers a good starting point for understanding how your database is used. SQL Impact automatically produces diagrams by analyzing the database and registered programs and by drawing the entities and connecting them accordingly.
Note: A diagram can take quite a while to be generated. Restrict the diagram parameters as much as possible first.
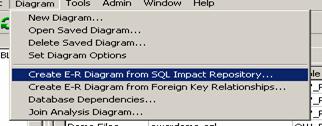
Choose the Create E-R Diagram from Repository option from the Diagram menu.
Type OW% into the Table Name parameter field and click OK.
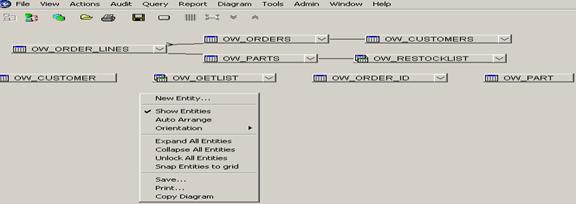
A process window appears to show that SQL Impact is generating your diagram (This could take a while). Once your diagram appears, right-click on the background of the diagram window to open a menu. From this menu, you can choose to save and print your diagram, expand and collapse the nodes or change the diagrams orientation. Choose the Expand All command and watch your nodes expand to display the columns they contain. You can also expand and collapse individual nodes by clicking the button. You can manually adjust the diagram by dragging individual entities to new positions. Try doing this and notice how any connecting lines are automatically re-positioned for you.
Lesson 8: Querying the relationship between two tables
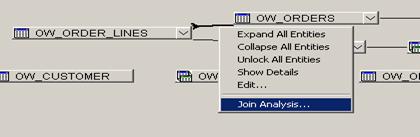
SQL Impact allows you to run queries from the diagram window. We will run a query to find all of the joins between the OW_ORDERS and OW_ORDER_LINES tables. Using the diagram created in the previous lesson, move your cursor directly over the relationship line between the OW_ORDERS and OW_ORDER_LINES tables. This causes the line and the columns involved in the join to be highlighted. Right-click over the line to open a menu and select Joins Analysis to open the Joins Analysis query.
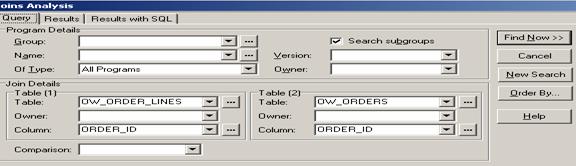
The table names are inserted automatically, so you do not need to enter any other criteria in the query window.
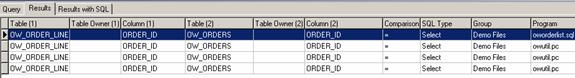
Click the Find Now button or the Results tab to run the query.
The query results window displays all of the joins between the OW_ORDERS
and OW_ORDER_LINES tables. Scroll to the right to see all of the result data for this query. SQL Impact provides you with several queries that have a variety of parameters to assist you in analyzing programs, joins, SQL statements, and program interdependencies.
Close both the Joins Analysis query and the diagram windows. Do not save the diagram.
Lesson 9: Querying the SQL statements that access a table
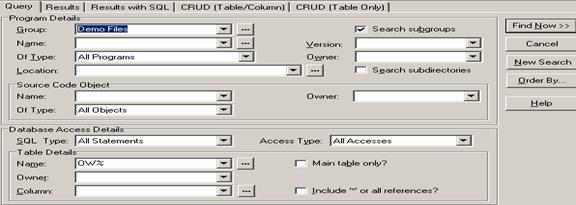
Now we will look at the main query function in SQL Impact. From the Query menu, choose Program and Table Access Dependencies. This opens the query window, shown below. In the Program Details, Group field, type Demo Files.
In the Database Access Details, Table Details, Name field. type OW%.
Click the Find Now button to run the query and find the SQL statements. The results for the query will display in a tabular form under the Results tab.
You can refer back to your query criteria easily by clicking the Query tab, or you can view the SQL statements by clicking the Results with SQL tab. You can also use the right-click menu to view source code or show the SQL statement as was mentioned earlier in this walk-through.
Lesson 10: Reporting on Joins and Conditions
You will now run a join and condition report on the OW_ORDERS_LINES table.
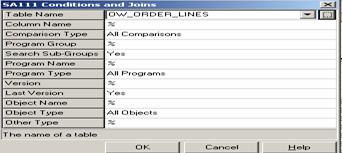
From the Report menu, choose Database Impact Analysis Reports SA111 Conditions and Joins.
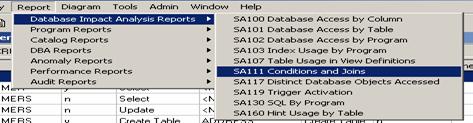
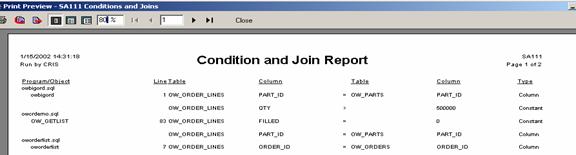
A set of report parameters will appear. Type OW_ORDER_LINES into the Table Name parameter field and click OK to run the report.
A print preview screen appears for this report. You can use the zoom and page options in the toolbar to view the report. From this screen, you could print or close the report.
Lesson 11: Searching your SQL for Anomalies
To complete this walk-through, we will perform a Source Code Quality Audit to search the demo files for any inconsistencies or anomalies. These potential problems can be as obvious as referencing a non-existent column, or as subtle as having a table with unused indexes.
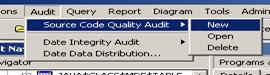
From the Audit menu, choose Source Code Quality Audit New. This invokes the Source Code Quality Audit wizard. Click the Next button to move to the next panel. This panel lets you restrict the audit to specific groups of programs.
To restrict the auditing to the demo files provided with SQL Impact, type Demo Files in Program Group field,.
In the Program Name field, type ow% (case sensitive). For the purposes of this walk-through, we will let SQL Impact supply any remaining defaults.
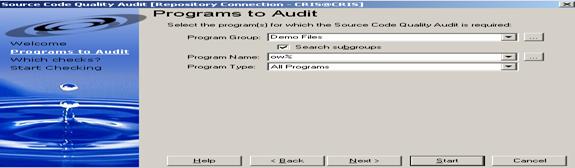
Click the Start button to accept this information and generate the report.
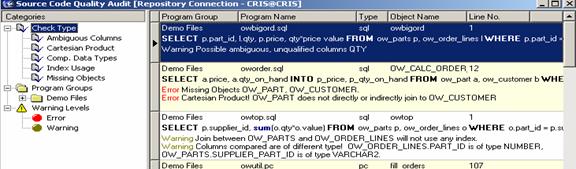
The Source Code Quality Audit displays its results in a window that is very similar to the SQL Impact Navigator. The tree-view on the left organizes any anomalies that are found into several categories. These categories give you an idea of the severity of the problems they represent.
The list view on the right-hand side of the window shows you the SQL statements themselves. Every statement includes the name of the program to which it belongs, the statements position in that file and, most importantly, the reason(s) for its inclusion in the report.
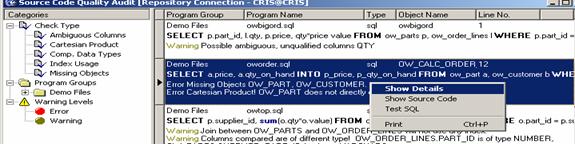
Right-click on an SQL statement and choose Show Details from the pop-up menu.
This gives you detailed information about the statement and the problems that were found. Double-clicking on a problem shows its cause, effect and a suggested solution. You can also choose to view the source code from which the statement was taken, test the statement, or generate an execution plan.
To complete the lesson, close any open windows and return to your SQL Impact desktop.
|
Politica de confidentialitate | Termeni si conditii de utilizare |

Vizualizari: 1367
Importanta: ![]()
Termeni si conditii de utilizare | Contact
© SCRIGROUP 2026 . All rights reserved