| CATEGORII DOCUMENTE |
| Asp | Autocad | C | Dot net | Excel | Fox pro | Html | Java |
| Linux | Mathcad | Photoshop | Php | Sql | Visual studio | Windows | Xml |
Debugging and tracing are two techniques frequently, and often necessarily, employed by developers. The former allows a developer to analyze an application's variables and code, and step through the program's code flow. The latter allows us to trace the behavior of our application, displaying information in a listener (a log file, the Windows event log, or similar). They are fundamental to creating robust applications because they provide an easy way to monitor and understand how our application is working. The big difference between the two techniques is that tracing can be done during an application's run time, while the debugger is used at design time, before releasing the final version of our application.
Desktop application developers have traditionally had access to excellent debugging support, with the ability to use breakpoints and examine the contents of variables. .NET is no exception in this regard, but the issues inherent in using breakpoints in a multithreaded application deserve some attention, and will be the focus of this chapter.
Outside the desktop, developers have long suffered from the lack of a good debugger for web applications written in environments such as ASP. In order to understand a variable's value, or the code's flow, and every common task usually done with a debugger, ASP developers often had to populate their code with Response.Write() statements, echoing messages like Entered the function, Exited from the loop, and so on. Then when they had finished testing the ASP application, they needed to remove all the undesired statements. That's not the best way to debug a program.
Fortunately, .NET brings debugging functionality to the next generation of ASP developers by providing four useful classes: Trace, Debug, BooleanSwitch, and TraceSwitch. In addition, any .NET language can use these classes so every developer who chooses to use Visual Studio .NET to create applications can perform debugging operations using its visual tools.
The various tracing and debugging techniques are especially useful for applications that use threads. If implemented well, these techniques allow developers to trace each thread's behavior, discovering any application anomalies, such as unexpected resource consumption, contention bugs, and so on.
In this chapter, we will analyze both tracing and debugging aspects in the following order:
Using Visual Studio .NET debugging analysis and its powerful tools
Using the .NET tracing classes in order to implement these features in our code
Putting it all together by creating an application that uses tracing
For this chapter, Visual Studio .NET is necessary to make use of much of the tracing and debugging features shown. However, by using the /d:TRACE=TRUE switch, some tracing functionality can be achieved using the command line.
Usually, when you create an application (or part of one), you write the code and then try to run the application. Sometimes it works as you expected it to; often it doesn't. When it doesn't, you try to discover what could be happening by examining more carefully the code that you wrote. In Visual Studio .NET, you can use the debugger by choosing some breakpoints to stop the application's execution near or just before the guilty method, then step through lines of code, examining variable values to understand precisely what went wrong. Finally, when all is working you can build the release version (a version without the symbols used by the debugging tools) of our application, and distribute it.
In this type of program, during the development process, you can also insert tracing functionality. In fact, even if the program works very well, there will be always a case where something has not been foreseen (especially when some external, possibly third-party, components fail). In that case, if you have filled the code with tracing instructions, you can turn on tracing and examine the resulting log file to understand what might have happened. Moreover, tracing functionality is useful to discover where an application consumes resources or where it spends too much time performing a task. In applications that use threads, you should use tracing functionality because otherwise it can be difficult to observe each thread's behavior, identify race conditions, and spot potential deadlocks or time-consuming contention.
Tracing, debugging, and performance techniques are often known as instrumentation. This term refers to the capacity to monitor an application's performance and behavior, and diagnose errors and bugs. So, an application that supports instrumentation has to include:
Debugging: Fixing errors and bugs during an application's development
Code tracing: Receiving information in a listener program during an application's execution
Performance counters: Using techniques to monitor an application's performance
Let's examine what the .NET Framework provides for us to add instrumentation to our applications.
Usually, when you test your application and see that its behavior is not what you expect it to be, you start examining more carefully the code written. If you are using Visual Studio .NET to create your application, it provides many amazing tools to visually debug the application. In addition, whatever language you choose to develop your application in, it will use the same debugger with the same tools. Moreover, the basic debugger's functionalities have been inherited from the Visual Basic 6 and Visual C++ IDEs, resulting in something that should be familiar for most developers. However, we will not spend too much time on the debugger in general, and will focus this discussion mostly on those features directly relevant to threading.
The new debugger provides:
The same tool to debug different applications created using different languages, and the ability to debug applications written in mixed languages
The ability to debug SQL Server stored procedures
The ability to debug .NET Framework and Win32 native code, so that if you are debugging your Visual C# .NET application and your thread uses a COM+ component, you can debug both the applications using the same debugger
A more powerful and enhanced remote debugger
If you already have experience with the Visual Basic 6 debugger, you will know that some functionality has been removed. The most relevant is the ability to change the code and continue with its execution. Using the Visual Studio .NET debugger, this feature is no longer available, because each modification to the code requires a new compilation.
In this section of the book, we will analyze the debugging tools provided by the Visual Studio .NET IDE that are especially useful during the testing and error discovery phase of multithreaded application development.
Using the Visual Studio .NET debugger, as you know, you can break the execution of your application at a specified point simply by inserting a breakpoint near the line of the code you wish to inspect. When the application is suspended, the debugger provides many tools to examine and edit the content of variables, examine the memory and call stack, and more.
In order to make use of the Visual Studio .NET debugger, you have to build the application using the Debug configuration. In that way, you will fill the application with symbolic debugging information rather than optimize the code. When everything appears to work fine, you would release your application after recompiling the code, choosing the Release configuration, which removes debugging information and optimizes the code.
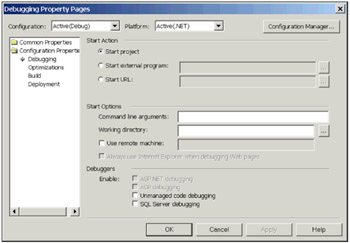
When a new debugger session begins, a lot of resources are loaded into the memory. In fact, the debugger fills the memory with various code to allow us to debug unmanaged code, SQL Server stored procedures, and more. It is therefore a good idea to remove these features when you don't need them. You can change the debugger's settings inside the Property Pages dialog box that can be found by right-clicking on the project in the Solution Explorer and selecting Properties. For a Windows application, the following dialog box will appear:
After compiling a Debug configured project, the output directory will contain the exe or dll file and a pdb (program database) file. Because IL keeps the values of parameters and private members inside arrays, the original names of these variables are lost - as well as some other information relevant to debugging. When a project is compiled for debugging, or the /debug:full switch is used on the command-line compiler, a pdb file is generated at the same time. The exe or dll file contains an absolute path pointing to the pdb file and if the debugger doesn't find the program database file, it starts to search in the same application path and in the directory specified in the Property Pages dialog box. Finally, if the debugger can't find the pdb file in any directory, it will regenerate a new one.
Once you have loaded your project into Visual Studio .NET you are ready to debug your application by simply running it, waiting for the code to reach a breakpoint, then using either the F10 or F11 key to step over and step into method calls in our code, respectively. If you are not working with the release version of your application, you will see the IDE showing many docked windows. During your debugging session these windows will be filled with the variables' values, objects' dumps, call stack, disassembly code, and more. Let's start examining more closely these debugging tools, and how they can be used to assist in the debugging of your threaded application.
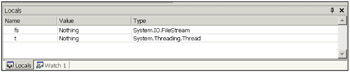
This
window allows you to examine and modify each variable's content defined locally
in the method you are debugging (including parameters to the method). For
example, debugging the following
You can activate this window selecting the Debug | Window | Locals menu, or you can press Ctrl+Alt+V, release, and press L.
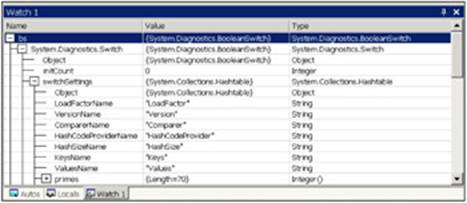
You can drag variables from the source code and drop them over the Watch window in order to inspect their values and structure. In the following screenshot, a BooleanSwitch object from an example later in the chapter has been dropped into the window.
You can expand tree nodes by clicking the plus sign and then examine and change object property values. You can activate up to four Watch windows by pressing Ctrl+Alt+W, then releasing, and pressing a key between 1 and 4.
You can also add a variable to the Watch window by selecting it in the source code and choosing Add Watch from the context menu.
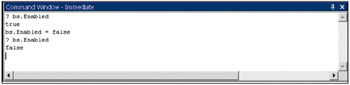
This window provides a text field where you can query a variable's contents and change variable values. When you need to retrieve the variable's content you have to use a question mark before the expression. In the following screenshot, the Enabled property of the BooleanSwitch object has been examined, changed to false, and displayed again.
In addition, this window allows you to make use of various IDE commands, such as creating a new file or project, finding a string, or whatever else you usually do within the Visual Studio .NET menu. To switch from Immediate mode to Command mode you simply have to write the >cmd statement. Once in Command mode, you will be assisted by the IDE in finding the desired commands by the IntelliSense functionality. You switch back to Immediate mode by using the >immed command.
You can activate this window by selecting Debug | Window | Immediate, or you can press Ctrl+Alt+I.
Now that we have briefly described the more useful debugger windows, we can focus our attention on code navigation. The Visual Studio .NET debugger allows developers to step between code lines of both single and multiple source code files, observing the program behavior at run time. Moreover, you can debug unmanaged code and Microsoft SQL Server stored procedures. The debugger provides three different ways to step through the code:
Step Into: Pressing the F11 key you will go through the code one step at a time, entering method bodies that you find on your way (where source code and debug symbols are available).
Step Over: Pressing the F10 key you will go one step forward in the code executing every method you encounter but without stepping into it (executing the method as one line).
Step Out: Pressing Shift+F11, you will execute all the remaining code within the body of the method that you are currently stepped into, and step onto the next line in the method that called it.
Each time you step to the next line of code by pressing these keys, you are executing the highlighted code.
Another useful feature provided by the Visual Studio .NET debugger is the Run To Cursor functionality. Selecting it from the context menu over the source code, you can execute all the lines between the highlighted line and the line where the cursor is placed.
Finally, the Visual Studio .NET debugger provides a way to change the execution point of our application. You can decide to move your application's execution point by launching the debugger and choosing the Set Next Statement item in the context menu. Be careful when using this feature, because every line of code between the old and the new position will fail to be executed.
In large source code applications, it is not practical to step through all the preceding code before arriving at the method you are interested in debugging. The debugger offers the possibility to set breakpoints in the code. As the name says, a breakpoint is a point where the execution of your program is to be suspended. You can specify breakpoints both before and after launching the debugger session, by simply placing the cursor on the line and pressing the F9 key - or by clicking in the left margin. A red highlight will be placed over the line to let you know that you have just added a breakpoint to the code, and a glyph will be added to the left margin of the source window. In order to remove a breakpoint you can either click over the glyph or press the F9 key again.
You can manage all the set breakpoints from a single dialog by using the Breakpoints window.
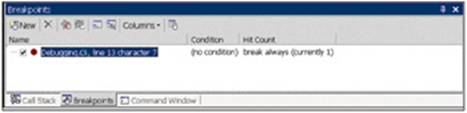
Using this window, you can add a new breakpoint, delete one or all breakpoints, disable all breakpoints, add and remove window's columns, and view breakpoint properties.
By using breakpoints, you can suspend execution of a thread and examine its current stackframe contents.
Selecting the breakpoint properties option from the window above a new dialog box will be shown and you can specify to activate a breakpoint only when a specific variable changes its content. You have to specify the variable's name choosing the has changed radio button in the breakpoint property pages. This again can be useful in threaded scenarios, as you can detect when something unexpected occurs.
Finally, the Hit Count button from the same dialog box allows developers to enable a breakpoint only when it has reached the specified hit count. Again this is useful in debugging threads as it allows you to see how? often a thread is spawned.
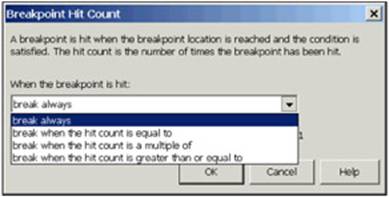
From the combo box, you can select the condition that you want to assign to the breakpoint. For example, you can activate the breakpoint in a loop only when you are near to exiting from it. You can select the break when the hit count is equal to an item by assigning a value to the text field that will appear next to the combobox.
In order to execute all the code lines until the breakpoint is reached you have to press the F5 key, select the Debug | Start menu, or press the Start button on the standard toolbar.
The Visual Studio .NET debugger provides a special window to manage threads during debugging sessions. You can display this window by selecting Debug | Windows | Threads, or by pressing Ctrl+Alt+H.
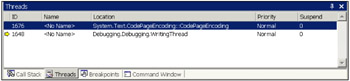
The Threads window contains the following columns:
|
Column name |
Description |
|
ID |
The thread's unique identifier assigned by the operating system. |
|
Name |
The thread's name. You can specify it in the code using the Name property of the Thread object. |
|
Location |
The method or memory address in which the thread is currently executing. |
|
Priority |
The thread's priority. |
|
Suspend |
A counter for determining how often the thread has been suspended. The counter zero in the screenshot above indicates that the thread has never been suspended. |
You can switch between threads by simply double-clicking on the item within the Threads window. Moreover, by right-clicking on a thread, you can choose the Freeze menu item that will pause the thread's execution. To roll back the frozen thread state, you select the Thaw menu item.
The next code instrumentation technique that we will analyze is tracing. In a multi-threaded application, this technique is especially important. You can trace a thread's behavior and interaction when more than one task has been started. As we will see later, this is not possible using the debugger. The .NET Framework provides some useful classes that allow developers to implement tracing functionality simply. Let's examine the tracing classes from the System.Diagnostics namespace that the .NET Framework offers:
Trace: This class has many static methods that write messages to a listener. By default, the debug output windows in VS.NET will be used as the listener application, but thanks to the Listeners collection, you can add different listeners such as a text file listener, or the Windows event log listener.
Debug: This class has the same methods as the Trace class, writing information to a listener application. The largest difference between these two classes is in their usage; Trace is useful at run time, Debug is used at development time.
BooleanSwitch: This class allows us to define a switch that turns on or off the tracing messages.
TraceSwitch: This class provides four different tracing levels allowing developers to choose the severity of the messages to send to the listener.
In this section, we will analyze the most frequently used methods of the Trace class. It is provided by the .NET Framework and encapsulates all the necessary methods to implement tracing functionality easily. The Trace class is contained in the System.Diagnostics namespace and provides many static methods for sending messages to the listener application. As you know, static methods mean that you do not have to instantiate a new object from the Trace class and can use the method directly. For example:
static voidThe code snippet above uses the WriteLine () method to output the thread state, followed by a carriage return, to the listener application. The following table lists some of the other static methods provided by the Trace class:
|
Description |
|
|
Assert (condition, message) |
Displays the specified string message when the condition provided to the method evaluates to false. When you do not specify the message text, the Call Stack is displayed instead. |
|
Fail (message) |
Similar to the Assert() method, this writes the specified text to the Call Stack when a failure occurs. The Assert() method differs because Fail() cannot specify a condition before displaying the error. In fact, the Fail() method is usually placed in the catch statement of a try-catch-finally instruction. You could also place it anywhere in your code that you are sure could never be reached - such as in the default case of a switch statement where you believe you've allowed for all possibilities. |
|
Write (message | object) |
Writes the specified text message, or object name, to the listener application. |
|
WriteIf (condition, message) |
Writes the specified message text into the listener application if the specified condition is true. |
|
WriteLine (message | object) |
Writes the specified message text, or object name, followed by a carriage return. |
|
WriteLineIf (condition, message) |
Writes the specified message text followed by a carriage return if the specified condition is true. |
The behavior of these methods depends on the listener application chosen. For example, the Assert() method displays a message box when the default listener is specified.
|
Politica de confidentialitate | Termeni si conditii de utilizare |

Vizualizari: 1093
Importanta: ![]()
Termeni si conditii de utilizare | Contact
© SCRIGROUP 2025 . All rights reserved