| CATEGORII DOCUMENTE |
| Asp | Autocad | C | Dot net | Excel | Fox pro | Html | Java |
| Linux | Mathcad | Photoshop | Php | Sql | Visual studio | Windows | Xml |
Getting Started with MapObjects 2.2 and C++ Builder 5
In this introductory document you will use MapObjects Version 2.2 software and C++ Builder 5 to build a simple mapping application. Along the way you will learn how to:
Display a map with multiple layers
Control panning and zooming
Display map layers based on scale
Perform spatial and logical queries
Draw simple graphics on the map
Programmatically add data to a map
Display features with thematic renderers
Dynamically display real-time data with an event tracking layer
The general techniques discussed here will work with any C++ development environment. The specific step-by-step examples, however, make use of Borland C++ Builder version 5. It is assumed that the user has some experience with this development environment.
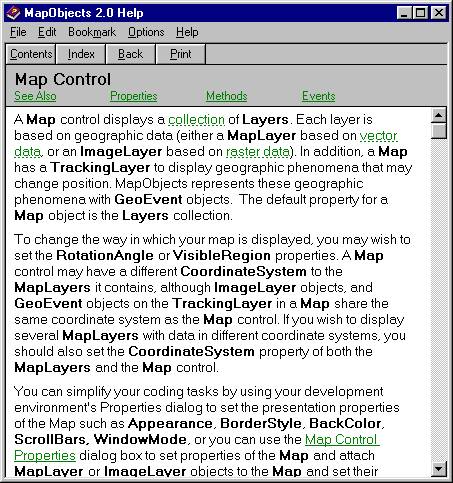
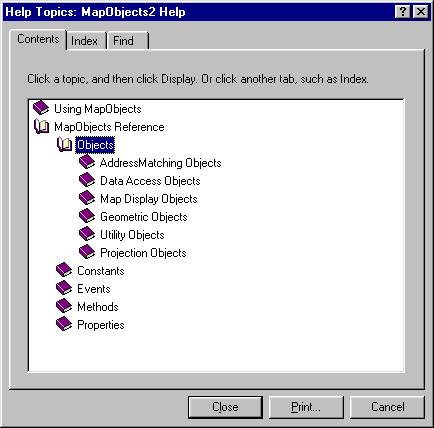
There are over forty-five objects that make up MapObjects; the map control is one of these. To find out about the various objects, open the MapObjects online help and choose Objects from the table of contents. The help system provides help for every object, property, method, event, and constant in MapObjects.
To add the MapObjects ActiveX control on to your component palette:
 |
 |
 |
You can specify what data to display in the map by setting properties in the map control's property sheet.
 Choose
the "States.shp" file and the click Open.
Choose
the "States.shp" file and the click Open. Choose
the States layer in the layers list and click Properties.
Choose
the States layer in the layers list and click Properties.Before you run your application, be sure to save your project.
#include <vcl.h>
#pragma hdrstop
USERES('Starter_map.res');
USEFORM('StarterMap.cpp', Form1);
USEUNIT('C:Program FilesBorlandCBuilder5ImportsMapObjects2_TLB.cpp');
 |
At this point, your application can display the map at its full extent. In this section you will add simple pan and zoom functionality that will be activated in response to the mouse clicks on the map. You will write code that gets executed in response to the MouseDown event on the map.
void __fastcall TForm1::Map1MouseDown(TObject *Sender, TMouseButton Button, TShiftState Shift, int X, int Y)
TrackRectangle is a method that applies to a map. It tracks the movement of the mouse while the user holds the mouse button down, rubber-banding a rectangle at the same time. When the user releases the mouse button, the TrackRectangle method returns a Rectangle object. The map's Extent property is set to the rectangle object, causing the map to be redrawn with a new map extent.
 |
void __fastcall TForm1::Map1MouseDown(TObject *Sender, TMouseButton Button, TShiftState Shift, int X, int Y)
else
}
else
Map1->Pan();
If the left mouse button is used when the MouseDown event occurs, then the zooming code from the previous step will be executed. If the Shift button is also depressed, then the map will zoom out to an extent that is 1.5 times larger than the previous extent. That is, the map scale will become smaller. If the right mouse button is used, another map method, Pan, will be issued.
Your application now supports panning and zooming, but these capabilities are somewhat hidden from the user. In this section you will add buttons to the toolbar that allow you to zoom or pan.
 Select
the Panel control from under the Standard control tab on the Component
palette and add a panel at the top of the form.
Select
the Panel control from under the Standard control tab on the Component
palette and add a panel at the top of the form.ZoomOutBtn (zoomout.bmp) PanBtn (Pan.bmp) QueryBtn (Bex.bmp) FullExtentBtn (Globe.bmp) AddEventBtn (Pennant.bmp)
Since the first four buttons will work together like radio buttons so that only
one can be selected at a time, select the first four buttons and set their GroupIndex
property to 1.
Set the Down property for the ZoomInBtn to True to make it the selected tool by default.
void __fastcall TForm1::Map1MouseDown(TObject *Sender, TMouseButton Button, TShiftState Shift, int X, int Y)
if (ZoomOutBtn->Down)
if (PanBtn->Down)
Map1->Pan();
void __fastcall TForm1::FullExtentBtnClick(TObject *Sender)
The map has two extent properties: the FullExtent property is the full extent of the map; the Extent property keeps track of the current visible extent of the map. Setting the visible extent to the full extent results in the whole map being shown.
In this section you will add additional controls to your application to implement a simple function for locating a state by name. You will add a new panel control that contains a textbox and command button for searching for map features by their name attribute.
Like the toolbar panel that was added to the top of the form, this panel at the bottom of the form will make it easier to handle form resizing and automatic positioning of the controls.
 |
void __fastcall TForm1::SearchStateBtnClick(TObject *Sender)
The search code first builds a simple SQL query expression using the text from the edit control. The States layer is then searched using the SearchExpression method with the result being a Recordset object. If the value of the Recordset's EOF property is false, the Recordset is positioned on the first record that satisfies the search expression. In that case, the value of the "Shape" field is obtained for the first record. The extent of the shape is scaled and then set to be the extent of the map. The map is then explicitly redrawn using the Refresh method, and finally, the shape is flashed three times.
When you run your application and resize the form, you will notice that the map is not automatically resized. One way to resize the map is to reset its Width and Height properties when the form is resized.
void __fastcall TForm1::FormCanResize(TObject *Sender, int &NewWidth,
int &NewHeight, bool &Resize)
Notice that the map control is resized together with the application window; however, you may experience an unacceptable amount of flickering. You can easily avoid the flickering by setting your Windows environment not to redraw until the window has been resized. You can do this programmatically by calling the Windows API function SystemParametersInfo(.) when your application is initialized.
try
In this section you will add a new layer to your map and add code which controls whether or not that layer is visible at a given time.
If you run your application now you will notice that every county in the US is displayed. At the full extent, there is no need for such detail, so in response to the BeforeLayerDraw event you will selectively make the Counties and States layers visible or invisible depending on the current extent of the map.
void __fastcall TForm1::Map1BeforeLayerDraw(TObject *Sender, short index,
OLE_HANDLE hDC)
The value of the Visible property of each layer is based on the current extent of the map. If the width of the current extent is less than or equal to one fourth of the full extent of the map, then the Counties layer will be visible and the States layer will be invisible. Because this code is executed in response to the BeforeLayerDraw event for each layer, the value of the visible field is calculated before drawing occurs.
 |
In this section you will implement a new tool that will perform spatial queries on the map. You will add code to your application that will draw the results of the spatial query on the map.
private: // User declarations
IMoRecordsetPtr g_Selection;
IMoPointPtr mapPt;
IMoLayersPtr layers;
IMoMapLayerPtr ushigh;
IMoMapLayerPtr cntys;
IMoRecordsetPtr selHWys;
if (QueryBtn->Down)
}
else
MessageBeep(MB_ICONQUESTION);
}
When the current tool is the spatial query tool, two searches are performed. The first search is a point proximity search on the USHigh layer. The point is obtained by converting the X, Y coordinates of the event, which are in control units, into map units. If the first search is successful, the highway that is found is used as the input to the second search which is performed on the Counties layer. The result of the second search is stored in the variable, g_Selection.
The MouseDown code initializes the g_Selection variable to point to the selected counties. Display the selection in response to the AfterLayerDraw event.
void __fastcall TForm1::Map1AfterLayerDraw(TObject *Sender, short index,
TOLEBOOL canceled, OLE_HANDLE hDC)
 |
You may notice an unacceptable amount of flickering as the screen is redrawn. This is because all three layers have been forced to redraw, which, in this instance is unnecessary, as the underlying layers have not actually been changed. There are a number of ways to avoid this. For example, you could use the RefreshRect method on the map control and pass a rectangle as a parameter representing the specific area to be drawn. Alternatively, you could draw the selected shapes within the AfterTrackingLayerDraw event handler. This uses what is called the "bitmap backing store" which is used to refresh the map control background if no changes to the layers have been made. As no actual changes to our layers have been made, this is the ideal place to highlight a recordset on screen.
To draw the selection in the AfterTrackingLayerDraw event, add the AfterTrackingLayerDraw handler to TForm1 using the Object Inspector.
Cut the code from TForm1::Map1AfterLayerDraw and paste it into TForm1::Map1AfterTrackingLayerDraw.
Ensure you remove the following lines:
if (index!=1)
return; //Only draw after counties
Within the TForm1::Map1MouseDown event, modify the code implementation for the spatial query tool by replacing the lines:
if (!(bool)g_Selection->EOF);
Map1->Refresh();
with:
if (!(bool)g_Selection->EOF);
Finally, to allow the roads to show through the highlighted selection of Counties, insert the following two lines right before setting the symbol object's color (i.e. sym->Color = moMagenta;) in the TForm1::Map1AfterTrackingLayerDraw event:
sym->SymbolType = moFillSymbol;
sym->Style = moLightGrayFill; //experiment with different fill styles
Rebuild and run your application to see the difference.
In the selection drawing code, you will notice that CreateOleObject() is used. Until now, we have initialized all of our wrapper classes by passing a pointer to an existing object.
IMoRectanglePtr extent;
extent = Map1->Extent;
or:
IMoFieldsPtr flds(g_Selection->Fields);
Since there is not an existing symbol that we can attach our IMoSymbolPtr to, we need to create one from scratch. To create a new integer from scratch you would use the following code:
Int* pInt = new int;
To create a new OLE automation object from scratch, in this case a MapObjects symbol, use the following code:
IMoSymbolDisp sym;
sym = (IDispatch*)CreateOleObject('MapObjects2.Symbol');
In the previous section, you specified the MapLayer objects interactively using the Map control's property sheet. In this section you will add code to your application that creates MapLayer objects programmatically using the Data Access objects.
private: // User declarations
IMoRecordsetPtr g_Selection;
void InitializeMap(void);
void TForm1::InitializeMap()
gds = dc->FindGeoDataset(WideString('States'));
lyr->GeoDataset = gds;
lyr->Symbol->Color = moLimeGreen;
Map1->Layers->Add(lyr);
lyr.Release();
lyr = (IDispatch*)CreateOleObject('MapObjects2.MapLayer');
gds = dc->FindGeoDataset(WideString('Counties'));
lyr->GeoDataset = gds;
lyr->Symbol->Color = moPaleYellow;
Map1->Layers->Add(lyr);
lyr.Release();
lyr = (IDispatch*)CreateOleObject('MapObjects2.MapLayer');
gds = dc->FindGeoDataset(WideString('USHigh'));
lyr->GeoDataset = gds;
lyr->Symbol->Color = moRed;
Map1->Layers->Add(lyr);
__fastcall TForm1::TForm1(TComponent* Owner)
: TForm(Owner)
In this section you will modify your application so that the Counties layer is drawn using underlying attribute information.
__fastcall TForm1::TForm1(TComponent* Owner)
: TForm(Owner)
breakVal = breakVal + stats->StdDev;
}
cbRenderer->RampColors(moPaleYellow, moOrange);
counties->Renderer = cbRenderer;
Each MapLayer object has a Renderer property. A renderer object controls how the MapLayer is drawn. The ClassBreaksRenderer can be used to display continuous data, in this case the number of mobile homes per capita by county.
//
//Set up States renderer
//
IMoMapLayerPtr states;
IMoDotDensityRendererPtr ddRenderer;
states = (IMoMapLayer*)(IDispatch*)lyrs->Item(WideString('States'));
ddRenderer = (IDispatch*)CreateOleObject('MapObjects2.DotDensityRenderer');
ddRenderer->Field = WideString('NO_FARMS87');
recs = states->Records;
stats = recs->CalculateStatistics(WideString('NO_FARMS87'));
ddRenderer->set_DotValue(stats->Max/100.0);
states->Renderer = ddRenderer;
It is often desirable to display geographic entities on top of the map, especially if those entities have a tendency to move. For example, a vehicle tracking system would want to display vehicles on the map at the appropriate locations and update those locations over time without redrawing all the layers of the map each time the vehicle changes location.
In this section you will add an event tracking layer to your application (though you may have already used this layer to highlight your selected counties).
IMoTrackingLayerPtr tLayer(Map1->TrackingLayer);
if (AddEventBtn->Down)
 |
To trigger the movement of the events, a Timer control will be used.
void __fastcall TForm1::Timer1Timer(TObject *Sender)
}
A CheckBox will be used to control whether or not real-time data collection is simulated
Timer1->Enabled = CheckBox1->Checked;
We will now change the default GeoEvent symbol to that of a small aircraft.
//set tracking layer symbol
IMoTrackingLayerPtr tLyr(Map1->TrackingLayer);
tLyr->SymbolCount = 1;
IMoSymbolPtr sym(tLyr->get_Symbol(0));
TFont* stdFont;
_di_IFontDisp olefont;
stdFont = new TFont();
stdFont->Name = 'Wingdings';
GetOleFont(stdFont, olefont);
delete stdFont;
sym->Font = (IDispatch*)olefont;
sym->Color = moBlack;
sym->Style = moTrueTypeMarker;
sym->Size = 14;
sym->CharacterIndex = 81;
 |
Finally, to give the user additional visual feedback as to what tool they currently have selected, we can make use of the MapObjects mouse pointers.
void __fastcall TForm1::Map1MouseMove(TObject *Sender, TShiftState Shift,
int X, int Y)
For more information on Importing ActiveX controls, see section. 34-4 of the Borland C++ Builder 5 Developer's Guide
|
Politica de confidentialitate | Termeni si conditii de utilizare |

Vizualizari: 1483
Importanta: ![]()
Termeni si conditii de utilizare | Contact
© SCRIGROUP 2025 . All rights reserved