| CATEGORII DOCUMENTE |
| Alimentatie nutritie | Asistenta sociala | Cosmetica frumusete | Logopedie | Retete culinare | Sport |
Bazele fizice si biofizice ale electrocardiografiei
ISTORIC
Fig.1

Alexander Muirhead a atasat fire unui pacient febril pentru a obtine o inregistrade a batailor inimii ale pacientului in timp ce el studia pentru a deveni doctor in stiinta (electricitatea) in 1872 la spitalul St. Bartholomew. Activitatea sa a fost monitorivatasa de catre fiziologul britanic John Burdon Sanderson folosind un electrometru capilar Lippmann. Primul care a privit inima din punct de vedere electric a fost Augustus Waller, lucrand in spitalul St Marry din Paddington, Londra. Electrocardiograful sau consta din electrometru capilar Lippmann atasat la un proiector. Urma batailor inimii era proiectata pe o placa fotgrafica care la randul ei are fizata la un trenulet de jucarie. Asta permitea inregistrarea batailor inimii in timp real. In 1911 el tot nu vedea aplicatia clinica a muntii sale.
Progresul a fost realizat de catre Willem Einthoven, lucradnd in Leiden, Olanda, folosind firul garvanometrului pe care il inventase in 1901, care era mult mai sensibil decat electrometrul capular folosit de Waller.
 Einthoven
a etalonat deviatiile cu literele P,Q,R,S si T si a
descris trasaturile unor tulburari cardiovasculare. In 1924,
a castigat Premiul Nobel pentru Medicina in baza descoperirilor sale.
Einthoven
a etalonat deviatiile cu literele P,Q,R,S si T si a
descris trasaturile unor tulburari cardiovasculare. In 1924,
a castigat Premiul Nobel pentru Medicina in baza descoperirilor sale.
Desi principiile de baza ale acelei era sunt inca folosite si acum, sau realizat imbunatatiri electrocardiografului dealungul anilor. Instrumentatia, de exemplu, a evoluat de la diagnosticare greoaia la aparatura electronica legata computerelor ce interpreteaza electrocardiograma. (6)
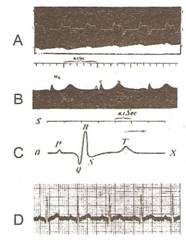
Fig..
A: Waller, 1887 - prima
electrocardiograma (cu electrometrul capilar al lui Lippmann)
B: inegistrare cu electrometru imbunatatit (Einthoven)
C: traseu eletrometric corectat matematic
D: Rinthiven, 1902 - inregistrare ECG cu galvanometru cu coarda
GENERALITATI
Electrocardiograma (EKG,ECG) este un test ce masoara impulsurile electrice ale inimii.Inima este o pompa musculara formata din patru camere. Cele doua camere de sus sunt denumite atrii, iar cele de jos, ventricule. Un sistem natural electric, face ca muschiul inimii sa se contracte si sa pompeze sangele catre plamani si restul corpului.
Activitatea electrica a inimii poate fi detectata de la nivelul pielii prin niste mici discuri metalice, denumite electrozi. In timpul electrocardiogramei electrozii sunt atasati de piele la nivelul toracelui, bratelor si picioarelor. Acestia sunt conectati la un aparat ce transforma impulsurile electrice intr-o reprezentare grafica, pe care o inregistreaza pe hartie. Aceasta reprezentare grafica, ce apare sub forma unei linii, este analizata de aparat si mai apoi de catre medic.
O electrocardiograma poate sa arate:
- dovezi ale
maririi de volum a inimii
- semne ale unui flux sanguin insuficient la nivelul inimii
- semne ale unor leziuni noi sau vechi ale inimii (infarcte)
- probleme ale ritmului
cardiac
(aritmii)
- modificari ale activitatii electrice, determinate de un dezechilibru
electrolitic
- semne de inflamatie
a sacului ce inconjoara inima
(pericardite).
O electrocardiograma nu prevede aparitia unui infarct
miocardic.
Caracteristicile electrocardiogramei normale
Variatiile potentialelor electrice cardiace in timpul unei revolutii se transmit la distanta, deaorece lichidele organismului sunt bune conducatoare de electricitate. Ele pot fi inregistrate cu ajutorul unor aparate f senibile denuminte electrocardiografe.
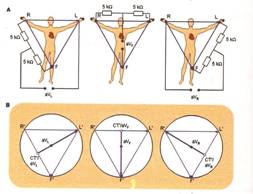
Culegerea variatiilor e potential al cordului se poate face unipolar - utilizand un eletrod explorator legat cu un alt electrod indiferent la potentialul zero, realizat prin unirea electrozilor celor trei derivatii standard trecute printr-o rezistenta de 5 000 Ω - sau bipolar- cu ambii electrozi pozitivi.
Derivatiile bipolare au fost primele utilizare si inregistreaza diferenta de potential a 2 regiuni asezate la distanta aproximativ agala de cord.
Derivatiile bipolare standard ale membrelor sunt in numar de trei:
-derivatia I (DI) in care eletrodul negative este conectat cu bratul rept sic el pozitiv cu bratul stag.
-derivatia II (DII) in care bratul drept este conectat la electrodul negative sic el pozitiv se leaga la piciorul stang
-derivatia III (DIII) in care bratul stang este conectat la electrodul negative si piciorul stang la cel pozitiv.
Fig..
 Derivatiile
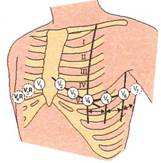
unipolare culeg variatiile de potential cu un singur
electrod. In mod obisnuit culegerea se face la nivelul a noua puncte standard,
dintre care sase toracice -desemnare prin simbolul V (1-6) - si 3 la nivelu
membrelor - desemnate prin indicativele VR (bratul drept) VL (bratul stang) si
VF (piciorul stang). In derivatiile unipolare precordiale, electrodul legat cu
polul pozitiv al aparatului culege variatiile de potential ale regiunii
miocardice subiacente electrodului explorator, iar in derivatiile unipolare,
ale membrelor, electrodul explorator este conectat,
succesiv cu fiecare dintre cele trei membre.
Derivatiile
unipolare culeg variatiile de potential cu un singur
electrod. In mod obisnuit culegerea se face la nivelul a noua puncte standard,
dintre care sase toracice -desemnare prin simbolul V (1-6) - si 3 la nivelu
membrelor - desemnate prin indicativele VR (bratul drept) VL (bratul stang) si
VF (piciorul stang). In derivatiile unipolare precordiale, electrodul legat cu
polul pozitiv al aparatului culege variatiile de potential ale regiunii
miocardice subiacente electrodului explorator, iar in derivatiile unipolare,
ale membrelor, electrodul explorator este conectat,
succesiv cu fiecare dintre cele trei membre.
O metoda pentru a mari dimensiunea potentialelor eletrice culese unipolar de la nivelul membrelor consta in conectarea electrocului explorator cu un membru si eletrodului indifferent cu celelalte doua member. Se obtin astfel derivatii augmentate ale
membrelor, desemnare prin litera a, pusa inainte simbolului derivatiilor respenctive. Prin aceasta metoda, fara a se modifica asteptul curbei, creste dimensiunea potentialelor, deoarece fiecare derivatie augmentatea este mai mare cu 3/2 comparativ cu cea obosnuita 2)
Prin aceste diverse metode se obtin curbe electrocardiografice cu configuratie si amplitidune variate, in functie de sediu electrozilor.
 O
elecraocardiograma normala este formata dintr-o unda
P, un "complex QRS" si o unda T. Complexu QRS are, de cele mai multe ori, trei
unde diferite unda Q, unda R si unda S.
O
elecraocardiograma normala este formata dintr-o unda
P, un "complex QRS" si o unda T. Complexu QRS are, de cele mai multe ori, trei
unde diferite unda Q, unda R si unda S.
Fig..
Unda P este
determinate de potentialele electrice generate de depolarizarea ventriculara,
adica de raspandirea undei de depolarizare in ventriculi care precede
contractia miocardului ventricular. De aceea, atat unda P cat
si componetele compluxului QRS sunt considerate unde de depolarizare.
Unda T este determinate de potentialele generate in momentul in care ventriculul se recupereaza in stare de depolarizare. Acest procesapare in muschiul ventricular la 0 -0,35 sec. dupa depolarizare; aceasta unda este cunoscuta ca o unda de repolarizare.(2)
Astfel, electrocardiograma este compusa atat din unde de depolarizare, cat si din unde de repolarizare. Totusi, diferenta dintre undele de depolarizare si undele de repolarizare este atat importanta in electrocardiografie, incat este nevoie de clasificari suplimentare.
Unda P are aspectul unei unde lente joase, rotunjita sau ascutita, creasta sau uneori bifida, cu o amplitudine care nu depaseste 0,2 mV si o durata intre 0,07-0,10 sec. In majoritatea derivatiilor membrelor si in precordiale, unda P este pozitiva, cu exceptia derivatiei aVR, in care este negative; in DII si in V1, unda P poate a fie bifazica, iar in DIII uneori negariva.
Intervalul P-Q Sau P-R corespunde depolarizarii atriale si conducerii prin nodulul atrioventricular; durata sa conditionata de varsta si frecventa cardiaca este in general de 0,12-0,20 secunde.
Coplexul QRS deloparizarii ventriculare si re o durata pana ala 0,10 sec. si o medie de 0.08 sec., in conducerile membranelor, si pana la 0,11 sec., in conducerile precordiale. Cand amplitudinea sa nu depaseste 0 mV, se considera un complex de voltaj redus: in derivatiile precordiale voltajul complexului are limita inferioare 0.9 mV - in V2 - SI 0,7 mV - in V5.
Unda T este asimetrica, portiunea sa ascendenta fiind mai lenta decat cea descendenta; are un sens in general identic cu deflexiunea majora a
complexului QRS, o amplitudine proportionala cu voltajul acestuia si durata de 0,15-0,30 secunde.
Intervalul Q-T corespunde aproximativ sistolei electrice, reprezentand durata progresieie si regresiei excitatiei ventriculare; durata sa variaza in raport cu frecventa cordului.
Intervalul T-P corespunde diastolei electrice si este de cele mai multe ori izoelectric. Uneori, apare pe acest interval o deflefiune lenta, de obicei pozictiva, denumita unda U, care pare a fi datorita relolarizarii lente a muschilor papilari 1)
Interpretarea electrocardiografica a aritmiilor cardiace
Contractiile premature
O contractie premature reprezinda o contractie cardiac ace survine mai devreme decat moemntul normal asteptat. Aceasta dsituatoie este frecvent denumita contractie premature sau extra sistolica.
Extra sistolele ventriculare determina anumite particularitati ale electrocardiogramei dupa cum urmeaza: in primul rand complexul QRS este, de obicei considerabil largit. Motivul este acela ca impulsul este condus mai degraba prin muschiul ventricular decat prin sistemul Purkinje.
In al doilea rand compluxul QRS este supravoltat din urmatoarele motive: cand un impuls normal traverseaza cordul, el traverseaza ambii ventriculi aproape simultan; in consecinta undele de depolarizare ale celor doi ventricului se anuleaza partial una pe cealalta. In cazul producerii unei extrasistole ventriculare impulsul traverseaza doar intr-o directie, astfel incat efectul de anulare dispare.
In al treilea rand, dupa aproape toate extrasistolele ventriculare, unda T are un potential opus fata de complexul QRS, deoarece conducerea lenta a impulsului prin muschiul cardiac permite ca primele teritorii cardiace depolarizate sa fie si primele care se repolarizeaza. Ca urmare, vectorul de depolarizare are sens opus vectorului de repolarizare. Acest lucru nu este valabil pentru unda T normala.
Unele contractii premature ventriculare apar si ca urmare a unor situatii obistuice ca: fumatul, consumul de cafea, scurtarea perioadelor de somn, unele stari toxice usoare si chiar emotii puternice 1)
Pe de alta parte, o mare parte a contractiilor premature ventriculare sunt consecinte ale unor stari patologice. De exemplu: multe contractii premature ventriculare survin dupa tromboze coronariene si sunt provocate de focare ectopice localizate in jurul zonelor de infarct miocardic 1)
Tahicardia paroxistica
Termenul de tahicardie semnifica fercventa cardiaca crescuta. Anomaliile oricareai regiuni a cordului, incluzand atriile, ventriculele si sistemul Purkinje, pot determina descarcari ritmice rapide de impulsuri care se raspandesc apoi prin cord, comanadand o frecventa cerescuta a ritmului cardiac.
Tahicardia paroxistica atriala ilustraza o creste brusca a frecventei cardiace de la aproximativ 95 batai/minut la aproximativ 150 batai/minut. Analiza atenta a electrocarduogramei arata ca inaintea fiecarui cumplex QRS-T apare o unda P inversata, partial suprapusa peste unda T normala a bataii precetente. Acest fapt indica originea atriala a acestui tip patricular de tahicardie paroxistica, dar deoarece unda P este anormala, inseamna ca originea ei nu este in apropierea nodulului sino-atrial.
Electrocardiograma tahicardiei paroxistice ventriculare are aspectul unei serii de batai ventriulare premature neintrerupte de taiat ventriculare normale.
De obicei, tahicardia paroxistica ventriculara este o tulgurare grava de ritm, din doua motive. Unul este ca acest tip de tagicardie de obicei nu apare decat la bolnavii care prezinte leziuni grave la nivel ventricular. Al doilea motiv este ca tahicardia paroxistica ventriculara predispune la fibrilatie ventriculara, care este aproave invariabil fatala. (1)
Fibrilatia ventriculara
Cea mai grava din aritmiile cardiare este fibrulatia ventriculara, care daca nu este tratata imediat, este aproape invariabil fatala.
Fibrilatia ventricular este provocata de impulsulsuri anormale, care se nasc haotic in diverse zone miocardice exercitandu-le asincron, revenind uneori in teritorii care au mai fost odata excitate, acesc lucru repetandu-se fara oprire. In cazul acestui tip de aritmie intalnim la un moment dat teritorii mici ale peretelui ventricular in stare de contractie concomitent cu alte teritorii aflate in stare de relaxare. Astfel, nu exista niciodata o contractie coordonata, simultan a muschiului cardiac, necesara functiei de pompa a acestuia. De aceea, in ciuda stimularii miocardice excesive, camerele ventriculare nici nu se relaxeaza nici nu se contracta, ramanand partial contractate, pompand fie cantitati neglijabile de sange, fie deloc. De aceea
Pag.7
dupa ce a inceput fibrilatia ventriculara, in 4-5 secunde apare pierderea constientei, datorita lipsei de irigatie a creerului si inevitabil moartea tesuturilor in cateva minute.
Numerosi factori pot determina instalarea brusca a fibrilatiei ventriculare dupa o perioada de batai cardiace normale. Fibrilatia ventriculara este initiata in special de: soc electric aplicat brusc pe cord, ischeia muschiului cardiac, a sistemului de conducere sau ambele. In fiecare din aceste situatii poate aparea un mecanism de reintrare a stimulilor, ducand la propagarea neintrerupta prin miocard a impulsurilor de contractie. Acest fenomen este adesea denumit "miscare circulara". (1)
Inovatii
Reconstituirea suprafetei inimii si localizarea electrozilor EGC folosind fluoroscopia
La om , imaginile ECG ale unei inimi cu activitate cardiaca electrica normala, in reconstructia fluoroscopica a inimii arata o stransa corelatie cu cele obtinute pe tomograful computerizat.
Pana in prezent nu exista nici o modalitate de monitorizare pentru aritmii cardiace, care ramane principala cauza de moarte subita in Statele Unite (> 300.000/yr.). Imaginile electrocardiografice (ECGI), o modalitate noninvaziva de a monitoriza aritmiile cardiace de la potentilul suprafetei pielii, necesita relatia geometrica dintre suprafata inimii si pozitia electrozilor ECG de pe suprafata pielii. O metoda fotografica a fost validata pe un manechin si utilizata pentru a determina coordonatele tri-dimensionale ale electrozilor ECG cu o eroare de 1 mm fata de pozitia lor reala. De cand fluoroscopia este disponibila in electrofiziologia cardiaca de laborator unde este efectuata diagnosticarea si tratamentul aritmiilor cardiace, o metoda fluoroscopica pentru determinarea geometrica a suprafetei inimii a fost dezvoltata pe baza geometriei de proiectie, a geometriei epipolare, punctul de reconstructie, B-spline(canelura) interpolare si vizualizare . Inimile reconstruite prin fluoroscopie intr-un manechin si un om , au fost validate folosind imagini computerizate tomograf de inala rezolutie. Eroarea medie a distantei absolute intre reconstructia fluoroscopica si tomograful computerizat fost de 4 mm la manechin si 10 mm la om. La om , imaginile ECG ale unei inimi cu activitate cardiaca electrica normala, in reconstructia fluoroscopica a inimii arata o stransa corelatie cu cele obtinute pe tomograful computerizat. Rezultatele demonstreaza posibilitatea clinicilor de a aborda asupra acestei imagini noninvazive a aritmiilor cardiace in interventionala EP laborator.(3)
Imaginile electrocardiografice (ECGI), o diagnosticare inovativa
Identificam prima
aplicatie medicala a imaginii electrocardiogramei (ECGI), o noua si neinvaziva
modalitate imagistica pentru aritmii, a atletilor cu tahicardie ventriculara
(VT) originara dintr-un diverticul al ventricolului stang (
Masurarea si monitorizarea tensiunii centurii eletrocardiograma
Monitorizarea eletrocardiogramei la copii premaruti cu eletrozii adezivi conventionali le poate rani pielea sensibila. Folosirea inei centuri electrod previne iritarea pielii, dar efectul centurii asupra functiei restiratorii este necunoscut. Un sensor ce masoara tensiunea este aplicat centurii
Cadrul amapatului a fost cuprins intr-o cutie de alumini sa minimalizeze greutatea aparatului. Este descris designul mecanic si electric al aparatului de monitorizare a tensiunii electrozilor centurii electrocardiograma. In categoria aplicatiilor tensiunnii, funcctiile cardiovasculare si respiratorii nu sunt substantial negativ afectate de centura de electrozi 4)
Bibliografie
Measurement and monitoring of electrocardiogram belt tension in premature infants for assessment of respiratory function
Edward J Ciaccio,1,2 Mark Hiatt,3 Thomas Hegyi,4 and Gary M Drzewiecki5
1Department of
Pharmacology,
2Department of
Biomedical Engineering,
3Department of
Pediatrics, Saint Peter's
4Department of
Pediatrics,
5Department of
Biomedical Engineering,
Corresponding author.
Edward J Ciaccio: ejc6@columbia.edu; Mark Hiatt: mhiatt@saintpetersuh.com; Thomas Hegyi: hegyith@umdnj.edu; Gary M Drzewiecki: drzewiec@biomed.rutgers.edu
Received September 17, 2006; Accepted April 19, 2007.
This is an Open Access article distributed under the terms of the Creative Commons Attribution License (https://creativecommons.org/licenses/by/2.0), which permits unrestricted use, distribution, and reproduction in any medium, provided the original work is properly cited.
Background
Monitoring of the electrocardiogram (ECG) in premature infants with conventional adhesive-backed electrodes can harm their sensitive skin. Use of an electrode belt prevents skin irritation, but the effect of belt pressure on respiratory function is unknown. A strain gauge sensor is described which measures applied belt tension.
Method
The device frame was comprised of an aluminum housing and slide to minimize the device weight. Velcro tabs connected housing and slide to opposite tabs located at the electrode belt ends. The slide was connected to a leaf spring, to which were bonded two piezoresistive transducers in a half-bridge circuit configuration. The device was tested for linearity and calibrated. The effect on infant respiratory function of constant belt tension in the normal range (30 g-90 g) was determined.
Results
The mechanical response to a step input was second order (fn = 401 Hz, ζ = 0.08). The relationship between applied tension and output voltage was linear in the range 25-225 gm of applied tension (r2 = 0.99). Measured device sensitivity was 2.18 mV/gm tension using a 5 V bridge excitation voltage. When belt tension was increased in the normal range from 30 gm to 90 gm, there was no significant change in heart rate and most respiratory functions during monitoring. At an intermediate level of tension of 50 gm, pulmonary resistance and work of breathing significantly decreased.
Conclusion
The mechanical and electrical design of a device for monitoring electrocardiogram electrode belt tension is described. Within the typical range of application tension, cardiovascular and respiratory function are not substantially negatively affected by electrode belt force.
Electrode belts with standard leads are commonly used devices for monitoring heart rate [1-4] and its variability [5], to assess physical activity [6], for instrumentation of ergometers used in sports medicine studies [7], aerospace medicine studies [8], for electrocardiogram (ECG) monitoring and defibrillation [9], as well as for electrical impedance tomography [10]. Similarly, arrays of many electrodes fitted within electrode vests are used to monitor the spatial distribution of heart signals, and can be either strapped to the chest [11] or held in place by a pneumatic mechanism [12]. The importance heart monitoring with electrode arrays to indicate regions of bioelectric abnormality where cardiac arrhythmias can originate is firmly established [13-16].
Premature infants confined to the neonatal intensive care unit (ICU) are routinely monitored with electrodes to obtain a record of the electrocardiogram (ECG). Application of standard electrodes to a premature infant's skin in the required locations can be tedious and time consuming [17]. Furthermore, the skin of premature infants is delicate and sensitive, and application and removal of contact tape can injure the patient. To overcome this problem, ECG electrodes can be mounted on a rubberized belt and positioned at the required location for recording by wrapping the device about the subject's torso [17]. Electrode belts can be used for both short-term and long-term ECG monitoring [18]. By use of a belt rather than contact tape to position individual electrodes to the chest, skin irritation is avoided. There is also ease of electrode application and removal. However, premature infants typically suffer from diminished respiratory function, which may be complicated by an inappropriately large level of belt tension.
Very premature infants, presently born as young as 20 weeks gestational age [19], may be as light as 400-500 grams [20], and have chests approximately 5 cm in diameter. To monitor electrode belt tension would require construction of a miniaturized device that could be attached between the tabs that are used to fasten the belt. Herein we describe the design and implementation of such a device, which is then used to quantify electrode belt tension in a premature infant. We compare monitored respiratory parameters to the measured tension levels that are applied in the ICU.
To measure tension applied normal to the axis of the electrode belt, the device width should be significantly less than chest diameter. Further, to prevent application of a vertical torque during measurement, the frame thickness must be minimized. A stiff, lightweight frame material is needed to prevent bending of the frame and to minimize the weight on the infant's chest. The device must be electrically isolated from the infant's skin. The mechanical and electrical construction of the device took into account these considerations.
Device housing and transducers
The electrode belt
allows correct positioning of ECG electrodes on the patient without the need of
adhesive. The electrode belt that was used for this purpose consists of
conductive carbon electrodes that are mounted on foam rubber backing, and
fitted snugly about an infant's chest by means of Velcro fasteners (InfanTrode,
Survival Technology Inc.,
Electrode belt detail. The device is composed of foam rubber with embedded electrodes. Velcro tabs are located at the ends to fasten it in place when it is wrapped around a patient.
The tension gauge instrument that was devised is shown schematically in Fig. 2 as being attached to the ends of the electrode belt (denoted as square at infant's belly). The mechanical portions of the device are shown in Fig. 3. They consist of an aluminum frame and slide (mass = 36 and 2.1 grams, respectively), a leaf spring (stainless steel, Young's Modulus of Elasticity E = 29.5E6 lb/in2), pin (identical material as frame), and Velcro tabs which connect with the ends of the electrode belt.
Schematic showing the positioning of the electrode belt about the infant's chest. Square at center denotes the position of the tension gauge device.
Tension gauge device. The location of Velcro tabs which adjoin with corresponding tabs on the electrode belt are shown. One Velcro tab is affixed to the slide (top of the device as shown) while the other is affixed to the device housing. Machine screws (more )
The individual mechanical components of the device are shown disassembled in Fig. 4. Each piece interconnects, and the assembled device, when grounded, provides shielding from electrical noise through the Faraday cage principle. A Faraday cage is an enclosure formed by conducting material to block external electrical fields. The separate portions of the frame shown in Fig. 4 were joined by means of steel machine screws. Velcro fasteners, applied to the frame with their original adhesive backing, provided connection with opposite Velcro tabs on the electrode belt. Disposable cotton material was affixed by means of double-sided masking tape to the portion of the instrument's surface that was to be in contact with the infant's chest. The masking tape enabled replacement of cotton, and the instrument was cleaned with alcohol between monitoring periods.
The separate components of the frame. A pin is attached to the slide. The slide moves along grooves cut into side pieces. The leaf spring bends as the pin to which it is attached moves with the slide as belt tension changes.
The belt tension was
monitored by means of two piezoresistive semiconductor elements (Kulite
Semiconductor Products,
Close-up of slide-pin-leaf spring mechanism with piezoresistive strain gauges attached. The strain gauges are bonded to either side of the leaf spring with an insulating epoxy. Their ends are connected to a cable which is in continuity with the signal (more )
Signal conditioning electronics
The signal conditioning elements are drawn in Fig. 6. The circuit is powered by two nine volt batteries that are configured to provide a two-sided supply. Features of the circuit include:
Signal conditioning circuit. The device is powered by nine volt batteries. The regulator adjusts the excitation voltage to the bridge to 5 V. The half-bridge consists of the variable piezoresistances along one arm and the adjusting resistances on the (more )
. 9 volt battery power supply
. 5 V, low power voltage regulator (provides stable excitation voltage)
. LED; on asserts battery low condition
. Wheatstone bridge zero adjust
. calibration adjust to relate millivolts to grams of applied tension
The current drawn by the resistive circuit elements and voltage regulator provide an estimate of battery life according to the following equation:
Icircuit = Ivoltreg + Iamp + Iactivearm + Izero + Ical + Ibatset
7.9 ma = 2.6 ma +3.8 ma + 0.7 ma + 0.7 ma + 0.1 ma + 0.1 ma
The current drawn by the entire circuit Icircuit in Eq. 1 is a summation of the current Ivolt reg drawn by the voltage regulator (reg), the current Iamp of the amplifier (amp), the current Iactive arm through the active arm of the Wheatstone bridge (though 2Rg), the current Izero of the zeroing element (zero), the current Ical through the calibration component (cal), and the current Ibat set through the battery set circuitry (batt set). The lifetime of the power supply to maintain the ≥ 6.2 volts required by voltage regulator for constant 5.0 V output can be calculated as:
0.450 mahours/7.9 ma ≈ 55 hours
where the battery life of 0.450 mahours was
obtained from the battery specifications. When there is less than 6.2 V at the
regulator input (battery low condition), the excitation voltage to the
Wheatstone bridge is no longer maintained at 5 volts, thereby introducing
measurement error. The light emitting diode (LED) alerts the user to a battery
low condition. LED off draws approximately no current,
however LED on (battery low) was measured to draw an additional 10.2 ma (the
forward current requirement). After balancing, if no tension is exerted on the
leaf spring, the output will register at zero millivolts. As tension is
exerted, a difference in resistance at each strain gauge is created that is
translated into a potential difference across the half-active bridge (Fig. 6).
The differential bridge voltage is reduced via the calibration adjustment to
enable a 100 mV output to correspond to 100 grams of tension (100 g980 cm/sec2
= 0.98
The piezoresistive transducing elements (Kulite Semiconductor Products, Basingstoke, England) have a stated strain gauge constant of G = 175 5% at 75C, and resistance R = 5000Ω 1%. The maximum strain for linearity for these elements is 1000 με (units are microstrain, which is strain expressed as parts per million). For a rectangular beam with centrally applied force, we calculated the beam thickness needed to maintain linearity. The maximum allowable strain before irreversible deformation can be calculated as follows. The strain is given by [21]:
S = L/L = (3 . F . L)/(4 E b h2)
where F is the applied force in
Fmax = Smax . (4 E b h2)/(3 . L)
where the chosen values of parameters L and b were designed to minimize the size and weight of the device, and h was adjusted according to the required maximum force Fmax. From the initial experience with placing the electrode belt about the patient, normally applied levels of belt tension by clinical personnel in the ICU ranged from approximately 30 g-90 g. A maximum force that would be encountered about the belt due to patient breathing and motion might therefore be about 100 g of tension. To provide for maximum sensitivity with a margin of safety double the maximum estimated force to be encountered, we supposed that the maximum belt tension would be 200 g, and:
Fmax = 200 g . 9.8 N/1000 g = 1.96 N (5)
Rearranging Eq. 4:
h = [(3 . L . Fmax)/(4 . E . b . Smax)]1/2 = [(3 . 1.56 cm . 1.96 N)/(4 . 20.3E6 N/cm2 . 0.244 cm . 0.001 cm/cm) ]1/2 = 0.021 cm = 0.21 mm
which is the required thickness of the steel leaf spring for maximum sensitivity.
Transducer sensitivity
For a half-active bridge, the output is [22]:
Vout = Vin . Rg/2Rg
where Rg is the strain gauge resistance, and the sensitivity is given in units of differential output voltage Vout per gram of tension per bridge input voltage Vin. The relationship between the gauge factor, strain, and resistive changes for a half-active bridge is [22]:
R/R = G . L/L = 175 . 5.25 με = 9.19 10-4
where G and L/L are properties of the particular strain gage that was used, and με are units of microstrain. For 1 gram (gm) of tension, the sensitivity is Vout/1 gm tension/5 V input excitation:
sensitivity = (5.0 V . 9.19 E-4/2)/gm tension/5 Vex = 2.30 mV/gm tension/5 Vex
where T = tension and Vex is the excitation voltage of the bridge. Therefore, without adjusting the gain, a 100 gm input tension would be expected to generate a 230 mV output. The unit was tested for electrostatic discharge and electrical isolation prior to connecting it to the EKG belt on actual patients.
Clinical protocol
Clinical monitoring
was done at Saint Peter's
Bench tests
The mechanical and electrical response of the tension gauge were tested following construction of the device. The mechanical step response was determined by anchoring a taut elastic band to the slide, followed by quick release. The resulting curve indicates an underdamped second order mechanical response (Fig. 7). The damping coefficient, ζ, and the resonant frequency, fn, can be respectively determined as follows [23]:
The step response to the tension gauge is a second order function. The resonant frequency and damping coefficient can be mathematically computed from this response (see text).
ζ = [(ln(x2/x1))2/(π2 + (ln(x2/x1))2]1/2
fn = fd/(1 - ζ2)1/2
where x1 and x2 are the step input and first maximum, respectively, measured x2/x1 from Fig. 7 was 0.78, and Td, the time from first to second maximum, was 2.5 ms from Fig. 7, and fd = 1/Td = 400 Hz. Thus from Eq. 10, ζ = .08 and fn = 401 Hz. The device was designed to measure the DC level of tension and low frequency components, which are well below the resonant frequency of this device.
Force was then
applied to different portions of the frame with varying amplitudes and
directions, while output of the tension gauge was tabulated. A 1-3 mV output
was observed upon compression of the sensor with approximately 100
The tension gauge frame was then clamped to the edge of a desk top, while weights of known value were attached to the slide, via the Velcro communication, and allowed to swing freely to study the effect of constant stress on the measurement output [24]. The weights were released by hand as rapidly as possible without bouncing. The sensor output was measured at 7 intervals over a 200s period. Some creep was noted in the output (Fig. 8, solid circles), which is attributable to the viscoelastic properties of the epoxy. Any viscoelastic effects by the electrode belt would not be measured in this test, since they would have no effect on the leaf spring tension. Extrapolating to Vo from the curve, τ was determined from Vo/e to be 12.0 seconds. This is less than the normal breathing frequency in premature infants (40-60/minute) [19], and indicates that minimal distortion of the tension gauge output in the form of integration of breathing motion will occur. Hence monitoring the average level of belt tension, the main purpose of the device, is not effected.
Creep effect when a level tension is applied to the device by either hanging weights or wrapping the device about a cylinder. The amount of creep is approximately 10% and it occurs over several minutes' time.
The viscoelastic properties of the electrode belt and Velcro connections were considered by wrapping the belt/tension gauge about a cylinder 22 cm in circumference. One hundred grams of tension was applied by tightening the strap; the response indicates a similar viscoelastic time constant to the previous test (Fig. 8, open circles). Thus the material properties of the electrode belt would not be expected to influence the clinical measurement beyond the initial decrease in the output of ~10%.
A static calibration curve was produced by recording the device output 2 seconds after releasing a weight in the weight range 25-225 gm and (Fig. 9). From linear regression analysis of the scatter plot points, r2 = 0.99. Therefore the device exhibits highly linear behavior in the expected measurement range.
Measurement to determine the linearity of the device. Weights are added at 25 gm increments after the device was calibrated to 1 gm tension = 1 mV. The output was linear in the range from 25 g-225 g (r2 = 0.99).
The compliance of the belt itself was nonlinear (Fig. 10). As tension was increased, the compliance decreased. Hence the electrode belt could not be used to accurately measure the magnitude of chest wall movements unless it is first calibrated to the specific level of tension and circumference of the patient. However, the direction of chest wall movement, and the relative movement, will be evident from the direction of the signal deflections.
Compliance of the foam rubber electrode belt with increasing applied tension. Initially, belt length increases approximately linearly by several centimeters when up to 150 gm tension are applied. However, the belt begins to become inelastic at higher (more )
The actual measured output was found to be 218 mV per 100 g tension (estimate was 230 mV - see Methods). However, for clinical use the output was adjusted through the calibration circuitry so that a 100 mV output reading corresponded to a 100 gm input.
Clinical recordings
In the neonatal ICU, to obtain good contact between the ECG electrodes and the infant's skin, a belt tension of 30-90 grams was required as measured with the tension gauge. The subject used for testing the device was a 3 day old female, gestational age 25 weeks at birth, weight 526 g. Her breathing was assisted with a mechanical ventilator (35/min, PO2 = 34 mmHg) but otherwise her functions and vital signs were normal for the circumstance as confirmed by a physician. She was moving during the measurements and had the appearance of good health. After a level tension of 30-90 gm was applied as read from the gauge output, the reading slowly decreased by approximately 5 mV (5 gm tension) over several minutes, which was attributable in part to the viscoelastic property of the epoxy and also to redistribution of tension about the belt during patient movement. It was also noted that large-scale motion by the infant caused transient increases in tension of several tens of grams. However, the response of the device output to infant breathing was negligible. During the entire measurement period, the infant's heart rate was constant at 158 bpm at the applied levels of tension and the O2 saturation level was also constant at 89%. The respiratory parameters are provided in the accompanying table, Table 1 (the results of one subject).
Relationship between Tension Level and Respiratory Parameters
The clinical data showed some change in most respiratory functions during monitoring with three different levels of belt tension. In Table 1, respiratory frequency is higher than the rate for the normal term infant (60/min). The tidal volume increases slightly with increasing tension level but at all three levels it is in range for a normal term infant (6-8 ml/kg). Minute ventilation increased significantly with increased tension level, in tandem with the increase in tidal volume and the approximately flat respiratory frequency. The dynamic compliance also increase significantly with increased tension level, but was still far below the normal for a term infant (1.00 ml/cm H2O). Pulmonary resistance did not change significantly from 30-90 g of tension, but was still far above that of a normal term infant (40 cm H2O/L/s). There was a significant increase in the work of breathing from 30 g to 90 g tension. At all three levels work of breathing was in the normal range for a term infant (10-40 g . cm/kg).
In this study, the design and construction of an electrode belt tension gauge was described. The device was tested for mechanical and electrical response. It was then clinically tested using a preterm infant who was already connected to an electrode belt for monitoring the electrocardiogram in an ICU setting.
Device properties
The tension gauge was constructed to minimize weight and encumbrance to the infant. The device was designed to convert the mechanical signal (electrode belt tension) to an electrical signal. Two strain gauges bonded to opposite sides of a leaf spring registered differing levels of resistance depending on the degree of tension imparted to the slide mechanism. During bench tests, the device exhibited a linear response to increasing tension levels within the range that would be expected during clinical measurement. The mechanical response to a step input was a second order function. The computed resonant frequency (400 Hz) was above the mechanical frequency range that would be expected to be encountered in a clinical setting.
For the creep tests, a constant load was applied during the test to allow for stiffness measurement [24]. The bonding epoxy did exhibit some creep (~10%) over the course of a few minutes when a constant level of tension was applied. However, the electrode belt was connected to the device frame, not to the leaf spring, and therefore its tension level would be unaffected by the properties of the bonding epoxy used to anchor the strain gauges. Yet, epoxy was also used to cement the Velcro tabs onto the device frame. Creep in this epoxy over time would be expected to diminish the actual tension in the electrode belt to which it was directly connected. This response would be anticipated to affect the measurement (decrease in tension reading over time). However, during actual clinical measurement, the decrease in tension over time was limited to about 10% at each tension level. Epoxies which exhibit less creep when subject to a constant stress should be used in subsequent manifestations of this measuring device [25]. One other difficulty was the nonlinear elastic response of the belt to differing levels of tension (Fig. 10). Thus with increased stretch, tension in the belt increased disproportionately. In terms of clinical recording, this would mean that there would be less compliance of the belt (greater force applied to the infant chest) for increases occurring at higher starting tension levels.
Clinical result
The clinical table (Table 1) and other results suggest that differing levels of tension used to emplace the electrode belt had some effects on respiratory function in this infant. At intermediate belt tension level (50 g), improvement in respiratory function occurred. The intermediate tension level may have stabilized the infant's chest wall, which underwent paradoxical breathing [19], in a manner that promoted more efficient breathing. Premature infants are known to breath paradoxically during rapid eye movement (REM) sleep, due to the very high level of compliance of their chest walls. In the case of the intermediate tension level, the chest wall may be supported and stabilized in a manner that promotes more efficient breathing. However, it may also be the case that the infant's long-term breathing response will differ from the short-term results depicted in the table. Additional subjects and a longer monitoring time will be required to know if these results will hold for a representative population.
Even distribution of tension about the electrode belt was probably not achieved during clinical measurement. Areas with greater tension were likely located near the tension measuring device, where the belt was connected above the infant's chest. Lesser tension would be expected at the back, where the weight of the infant would partially prevent even distribution of the applied tension. Therefore, we would expect the degree of tension to be less than the read value at some areas about the circumference of the belt. Segments of the belt with reduced tension would not impart as much force on the torso and therefore would contribute less to the effect of the belt on respiratory function.
Limitations and future directions
The piezoresistive transducers were bonded to a leaf spring with an epoxy that exhibited creep over several minutes time. This limited the accuracy of the measurement to determine whether electrode belt tension remained constant over time. Single recordings at varying levels of tension were made on one subject. Due to constraints in interaction with the patient, these recordings were done during a short period of time at one setting. It is uncertain whether the respiratory measurements at fixed levels of tension are time invariant. Supposing that these measurements are approximately time invariant, or that correction or normalization can be used to account for time-varying differences, a large population of subjects would still be required to determine the statistical significance of the effects of belt tension on respiratory function. Thus the approach that we have described is preliminary; other methodology may improve the accuracy of the measurements. Heart rate remained stable during the measurement interval; however, correlation of tension level and respiratory function to heart signals such as electrocardiogram and blood pressure would be useful to state more definitively whether the mechanical properties of the ECG belt affect the heart.
The instrument was not used to measure chest wall motion, but such information could improve understanding of the mechanism of paradoxical breathing. Although the tension gauge monitor was tested with an electrode belt attached to a premature infant, monitoring of belt tension would be useful in settings such as heart rate monitoring and variability [1-5], for sports and aerospace medical activities [6-9], as well as for electrical impedance tomography [10]. Monitoring of tension would assure that any change in respiratory or cardiovascular function is not due to the mechanical constraint offered by the belt. For very long term monitoring, the power supply of the device would need to be upgraded. Since some electrode belts and vests apply tension across the chest in multiple directions, monitoring of each axis will likely be important for understanding respiratory and cardiovascular effects.
Li R, Deurenberg P, Hautvast JG. A critical evaluation of heart rate monitoring to assess energy expenditure in individuals. American Journal of Clinical Nutrition. 1993 -607. [PubMed]
Maffeis C, Zaffanello M, Pinelli L, Schutz X. Total energy expenditure and patterns of activity in 8-10-year-old obese and non-obese children. Journal of Pediatric Gastroenterology & Nutrition. 1996 -261. doi: 10.1097/00005176-199610000-00009. [PubMed]
Raija M, Laukkanen T, Paula K. Heart rate monitors: State of the art. Journal of Sports Sciences. 1998 -7.
Geverink NA, Ruis MA, Eisen R, Lambooij E, Blokhuis HJ, Wiegant VM. The effect of shot biopsy on behavior, salivary cortisol, and heart rate in slaughter pigs. Journal of Animal Science. 1999 -1619. [PubMed]
Loimaala A, Sievnen H, Laukkanen R, Prkk J, Vuori I, Huikuri H. Accuracy of a novel real-time microprocessor QRS detector for heart rate variability assessment. Clinical Physiology. 1999 -88. doi: 10.1046/j.1365-2281.1999.00152.x. [PubMed]
Yamauchi T, Umezaki M, Ohtsuka R. Influence of urbanisation on physical activity and dietary changes in Huli-speaking population: a comparative study of village dwellers and migrants in urban settlements. British Journal of Nutrition. 2001 -73. [PubMed]
MacFarlane DJ, Edmond IM, Walmsley A. Instrumentation of an ergometer to monitor the reliability of rowing performance. Journal of Sports Sciences. 1997 -173. doi: 10.1080/026404197367434. [PubMed]
Rafolt D, Gallasch E. Polygraphic belt with force-sensing expander for physiological tests on cosmonauts. Biomedizinische Technik. 2001;46:230-235. [PubMed]
Reek S, Geller JC, Meltendorf U, Wollbrueck A, Szymkiewicz SJ, Klein HU. Clinical efficacy of a wearable defibrillator in acutely terminating episodes of ventricular fibrillation using biphasic shocks. Pacing and Clinical Electrophysiology. 2003 -2016.
Calderwood JH, Mognaschi ER. A novel field for possible use in medical impedance tomography. Journal of Medical Engineering & Technology. 1998 -125. [PubMed]
Ramanathan C, Ghanem RN, Jia P, Ryu K, Rudy Y. Noninvasive electrocardiographic imaging for cardiac electrophysiology and arrhythmia. Nature Medicine. 2004 -428. doi: 10.1038/nm1011. [PubMed]
Sadleir RJ, Fox RA, Turner VF. Inflatable belt for the application of electrode arrays. Review of Scientific Instruments. 2000 -535. doi: 10.1063/1.1150236.
Ciaccio EJ. Localization of the slow conduction zone during reentrant ventricular tachycardia. Circulation. 2000 -469. [PubMed]
Ciaccio EJ. Dynamic relationship of cycle length to reentrant circuit geometry and to the slow conduction zone during ventricular tachycardia. Circulation. 2001 -1024. [PubMed]
Ciaccio EJ, Tosti AC, Scheinman MM. Relationship between sinus rhythm activation and the reentrant ventricular tachycardia isthmus. Circulation. 2001 -619. [PubMed]
Ciaccio EJ, Costeas C, Coromilas J, Wit AL. Static relationship of cycle length to reentrant circuit geometry. Circulation. 2001 -1951. [PubMed]
McAdams ET, McLaughlin JA, McC Anderson J. Multi-electrode systems for electrical impedance tomography. Physiological Measurement. 1994:A101-AI06. doi: 10.1088/0967-3334/15/2A/014. [PubMed]
Kelly
DH, O'Connell K,
Lubart,
S.; D'Apolito, K. Overview of Nursing Practice. In: Avery GB. , editor.
Neonatology: Pathophysiology and Management of the Newborn. JB
Lippincott Co,
Vohr BR, Wright LL, Dusick AM, Mele L, Verter J, Steichen JJ, Simon NP, Wilson DC, Broyles S, Bauer CR, Delaney-Black V, Yolton KA, Fleisher BE, Papile LA, Kaplan MD. Neurodevelopmental and functional outcomes of extremely low birth weight infants in the national institute of child health and human development neonatal research network, 1993-1994. Pediatrics. 2000 -1226. doi: 10.1542/peds.105.6.1216. [PubMed]
Timeshenko,
SP.; Goodier, JN. Theory of Elasticity. McGraw-Hill,
Webster, JG.;
(Editor). Medical Instrumentation: Application and Design. John
Wiley & Sons Inc,
van Langen H, Brienesse P, Kopinga K, Wijn P. Dynamic response of a neonatal catheter-manometer system in situ. Journal of Clinical Monitoring. 1993 -340. doi: 10.1007/BF01618675. [PubMed]
Wren TA, Lindsey DP, Beaupre GS, Carter DR. Effects of creep and cyclic loading on the mechanical properties and failure of human Achilles tendons. Annals of Biomedical Engineering. 2003 -717. doi: 10.1114/1.1569267. [PubMed]
Kinloch AJ. Toughening epoxy adhesives to meet today's challenges. Materials Research Society Bulletin. 2003
Heart-Surface Reconstruction and ECG Electrodes Localization Using Fluoroscopy, Epipolar Geometry and Stereovision: Application
to Noninvasive Imaging of Cardiac Electrical Activity
Raja
R. N. Ghanem is with
the Department of Biomedical Engineering,
Corresponding author.
See other articles in PMC that cite the published article.
Top
Abstract
I. Introduction
II. Methods
III. Results
IV. Discussion
V. Limitations
References Abstract
To date there is no
imaging modality for cardiac arrhythmias which remain the leading cause of
sudden death in the
Index Terms: Cardiac arrhythmias, cardiac electrophysiology, cardiac imaging, cardiac mapping, electrocardiographic imaging, epipolar geometry, fluoroscopy, heart modeling
Top
Abstract
I. Introduction
II. Methods
III. Results
IV. Discussion
V. Limitations
References
Cardiac arrhythmias remain the leading cause of death and disability with over 300 000 annual cases of sudden death in the United States alone.1 Despite this fact, a noninvasive imaging modality for cardiac electrical function and arrhythmias does not yet exist in clinical practice. Standard electrocardiographic techniques infer information about the cardiac electrical activity from electrocardiograms (ECGs) measured on the body surface, far away from the heart. These methods are very limited in their ability to detect and localize electrophysiological processes in the heart (e.g., arrhythmogenic foci or regions with abnormal electrophysiological properties). With advances in electronics and computers, it has become practical to record ECG potentials from many sites on the body surface simultaneously [1], [2]. The resulting body surface potential maps (BSPM), while containing more information than the standard ECG, provide a very low-resolution projection of cardiac electrical events due to the smoothing effect of the torso volume conductor [3]. Moreover, each body surface ECG reflects the electrical activity in the entire heart [4], so that geometrical relationships and locations of cardiac events are not preserved in the BSPM. In contrast, measurements made directly on the heart surface provide a high-resolution image with accurate localization of the underlying cardiac electrophysiological processes in normal and pathophysiological states [5], [6]. It is therefore crucial to image cardiac electrical activity on the heart surface for the purpose of electrophysiological diagnosis and guidance of arrhythmia therapy.
A noninvasive imaging modality, electrocardiographic imaging (ECGI) [3], [7]-[10], that images cardiac electrical activity on the heart surface from body surface potential measurements has been under development in our laboratory. To date we have demonstrated in a human shaped torso-tank experimental setup the ability of ECGI to 1) reconstruct epicardial potentials during normal sinus rhythm [7], 2) reconstruct epicardial potentials, electrograms and activation sequences (isochrones) during single and dual site pacing and locate the pacing sites (representing ectopic arrhythmogenic foci) with high accuracy [8], [9], 3) localize and characterize abnormal electrophysiological substrates associated with myocardial infarction [11], [12], 4) map reentrant arrhythmias [12], [13], and 5) characterize regions with repolarization heterogeneities [14], [15].
In order to apply ECGI, the geometrical relationship between the heart surface and the positions of the recording body surface ECG electrodes is required, in addition to the recorded body surface potentials. More specifically, an epicardial envelope [8] containing the heart forms the surface on which cardiac electrical activity is imaged using ECGI. In the clinical environment, the geometrical information can be acquired using standard imaging modalities such as computed tomography (CT) or magnetic resonance imaging. However, it is highly desirable to develop a fluoroscopy-based method for ECGI because fluoroscopy is available in the cardiac electrophysiology (EP) laboratory where EP diagnostic procedures and interventions for arrhythmia management are conducted. This paper addresses the problem of acquiring the geometrical information necessary for application of ECGI in humans. It describes 1) a fluoroscopy-based method to reconstruct an epicardial envelope around the heart surface and 2) a photography-based method to localize the three-dimensional (3-D) coordinates of body surface ECG electrodes. Results are validated in phantom and human studies through comparison with CT images. We also conduct an initial evaluation of this approach in the context of ECGI, by comparing potentials imaged on the fluoroscopy-reconstructed envelope to potentials imaged on the CT-reconstructed epicardium.
Top
Abstract
I. Introduction
II. Methods
III. Results
IV. Discussion
V. Limitations
References II. Methods
A. Theoretical Approach
1) Pinhole Model. A camera or an X-ray system can be described by the basic pinhole model [16] that represents central projection, a mapping from a 3-D scene onto a two-dimensional (2-D) image (Fig. 1). Let the center of projection (the focal point, e.g., camera center or X-ray source) be the origin o of a Euclidean coordinate system and the image plane that at z = d, then under the pinhole model, the image of an object point m(x, y, z) is formed by the intersection of a ray drawn from the center through m and the image plane (Fig. 1). Using similar triangles, the point m(x, y, z) is mapped to the image point q(xd/z, yd/z) on the image plane. Using homogeneous coordinates, central projection can be described by a linear matrix multiplication equation
The pinhole model. The camera or X-ray source forms the center of projection and the image plane is at z = d. The point q on the image plane represents the projection of the object point m (i, j, and k represent unit vectors in the x, y, and z directions). (more )
where q = (u, v, 1)T represents the homogeneous coordinates vector of the image point q, m = (x, y, z, 1)T the homogeneous coordinates vector of the object point m, s the scaling factor, and P the 3 4 projection matrix describing the perspective projection.
The ray from the center of projection to the image plane is called the principal axis (line oc in Fig. 1), and the image of the center of projection on the image plane is called the principal point (point c in Fig. 1).
2) Single View Calibration. Equation (1) represents a simplistic expression of the projection matrix under central projection. However, in a real world application, the camera or X-ray source coordinate system is not aligned with the 3-D scene coordinate system and the image points are not referenced to the principal point. Therefore, the projection matrix is represented in the general form P = KR [I| − t] and (1) becomes (2)
In (2), K is a matrix that represents the internal parameters of the camera (focal length and principal point coordinates), R and t represent the external parameters (rotation and translation between the 3-D scene and camera coordinate systems).
In single-view calibration techniques [17], the objective is to determine the projection matrix P given a set of points in the scene with known 3-D coordinates (mi, Fig. 1) and their corresponding 2-D image points (qi, Fig. 1). For each point in the scene, mi, and its image point qi (2) provides
Expanding (3) and using homogeneous coordinates we obtain
Performing the matrix multiplication and substituting for s we obtain
The above linear system of two equations with 12 unknowns (p11, p12 . p34) is obtained for each object point and its corresponding image. Stacking the system of equations for six or more points in the scene and with some matrix manipulation, the problem can be expressed in matrix form as shown in (6) at the bottom of the next page.
The projection vector (p11, p12, p13 . p34)T and consequently the projection matrix P is obtained by determining the eigenvalue decomposition of the matrix BTB and selecting the eigenvector associated with the minimum eigenvalue as the solution. Note that homogeneous equations of the form Ax = 0 are generally solved using the least squares technique to minimize ||Ax|| subject to ||x|| = 1. It is shown that the solution x is the eigenvector corresponding to the smallest eigenvalue of the matrix ATA [17]. In order to minimize the effect of noise, the coordinates of the image and scene points are normalized [17] (referenced to their centroid and isotropically scaled by the maximum coordinate) prior to single view calibration.
3) Epipolar Geometry. In many instances, the scene is imaged from two views simultaneously (stereovision or biplane fluoroscopy) or sequentially (a moving camera around the scene). The geometry relating two views is described by the epipolar constraint [18]. It is independent of the scene and depends only on the camera intrinsic parameters and relative relationship between the two views. Fig. 2 represents the epipolar geometry of two views described by projection matrices P1 and P2, respectively. The image points q1 and q2 on I1 and I2, respectively, are termed corresponding image points as they represent the images of the same object point m in the scene. These points are constrained by the epipolar geometry; given an image point in I1, it defines an epipolar line in I2 on which the corresponding image point must lie. All epipolar lines in I2 intersect at the epipole (e21, Fig. 2); the image of the camera center or X-ray source for the first view (f1, Fig. 2) on I2. Similarly, all epipolar lines in I1 intersect at the epipole (not shown); the image of the camera center or X-ray source for the second view (f2, Fig. 2) on I1.
Epipolar geometry of two views. The corresponding image points q1 and q2 of the object point m are in the plane (m, f1, f2). The intersections of the plane (m, f1, f2) with the image planes form the epipolar lines on which q1 and q2 lie.
Analytically, the epipolar geometry is represented by F, a 3 3 matrix called the fundamental matrix, that relates the homogeneous coordinates of corresponding image points in two views
The fundamental matrix F can be determined from a set of corresponding image points, without prior knowledge of the scene or the projection matrices [19]. Conversely, if the projection matrices for the first and second views are known, F can be derived from these matrices and the epipole in the second view (taking the coordinate system for the first view as reference) [20]
where P1 is the projection matrix for the first view, the pseudoinverse of the projection matrix for the second view and [e21]x the skew matrix formed from the epipole in the second image. The homogeneous coordinates of the epipole e21 are determined from e21 = P2f1, where f1 is determined by solving P1f1 = 0 (f1 is the eigenvector corresponding to the smallest eigenvalue of ).
4) Point Reconstruction From Two Views. Given the Euclidean calibrated projection matrices P1 and P2 for the first and second views, respectively, the homogeneous coordinates m = (x, y, z, t)T of a point m in the scene can be recovered from a pair of corresponding image points q1 = (u1, v1 1)T and q2 = (u2, v2 1)T by triangulation [21]. The following relationships hold for the first and second views: (9)
Substituting for s1 and s2 and combining (9) and (10) for a pair of corresponding image points, we obtain the system
where p1, p2, and p3 represent the first, second, and third rows of the projection matrix , and represent the first, second, and third rows of the projection matrix P2. The homogeneous coordinates m = (x, y, z, t)T are determined by the eigenvector corresponding to the smallest eigenvalue of the matrix DTD in (11). The 3-D Euclidean coordinates (x/t, y/t, z/t) of the point m are then obtained.
B. Fluoroscopy-Based Approach for Determining Heart Geometry
In this section, we describe an algorithm to reconstruct the heart surface geometry from two or more biplane fluoroscopic projections. The algorithm combines principles from projective geometry, epipolar geometry, point reconstruction, surface interpolation and 3-D visualization. Note that distortion correction is not implemented on the acquired fluoroscopic images. The flowchart for the algorithm is shown in Fig. 3. The different steps are described below.
Flowchart of the fluoroscopy-based algorithm for reconstructing the heart-surface (envelope).
1) Single-View Calibration. A V-shaped calibration object containing twenty lead markers and a planar board containing more than fifty lead markers are used for calibration. The calibration object and the board are made of acrylic material in order to render them X-ray transparent. Using a V-shaped calibration object ensures that at least five noncoplanar lead markers can be seen in anterior, lateral and oblique views. This is a necessary condition for performing single view calibration [16]. During fluoroscopy the planar board is placed under the mattress below the subject's back, while the calibration object is supported above the subject's torso (the subject is lying in the supine position). Biplane fluoroscopy (Hicor Bicor, Siemens, 30 frames/s) is acquired. Care is taken to make sure that sufficient number of lead markers (more than 6) appear in each view. Both views need not reveal the same markers. The coordinates of the lead markers from the scene are acquired using a 3-D digitizing mechanical arm (Microscribe G2L, Immersion Corporation). The image coordinates of the markers in the fluoroscopic projections are digitized offline on a computer. Knowing the image coordinates of the lead markers and their corresponding 3-D coordinates in the scene, we perform single view calibration to obtain the projection matrix for each view. Once the projection matrices are obtained, the location of the lead markers observed in both views are reconstructed back in the scene using point reconstruction (11). If the reconstructed lead markers (reference points) were within 5 mm of their actual digitized 3-D coordinates, then the calibration is considered correct, otherwise single view calibration is repeated. This constitutes a self-test for the calibration process.
2) Heart Contour Segmentation. Multiframe animated images from biplane fluoroscopic projections are displayed for each view. The user identifies the outer boundary of the beating heart and delineates the contour interactively on a single frame. Since the objective of ECGI is to image cardiac electrical activity on an envelope around the heart, it suffices to take the outermost contour.
3) Matching Corresponding Contour Points. The fundamental matrix F relating both views is derived from the projection matrices P1, P2 and the epipole e21 (8). In the first view, each point q1 = (u1, v1 1)T (yellow circle, Fig. 4, view 1) on the heart contour defines an epipolar line in the second view determined by l2 = Fq1. The intersection of the epipolar line l2 with the heart contour in the second image determines the corresponding (matching) contour point, q2 (white circle, Fig. 4, view 2). Similarly, q2 defines an epipolar line in the first view determined by l1 = FTq2. Consequently, a set of four matching contour points can be extracted from a pair of epipolar lines (Fig. 5). For frontier points (yellow diamond, Fig. 4) in the first view, the epipolar line in the second view is tangent to the heart contour and the user visually selects a corresponding point as the tangent point between the epipolar line and the heart contour.
RAO 40 (view 1, left) and LAO 50 (view 2, right) views of acquired biplane fluoroscopic images. The heart contour (red) is delineated in each view. Yellow circle in RAO 40 represents a given point on the heart contour. Yellow (more )
Given four matching contour points (white circles) from two biplane fluoroscopic images, four object points (black circles) are reconstructed using point reconstruction. Weights are assigned to the reconstructed points based on their distance from the (more )
4) Point Reconstruction From Corresponding Points. For a pair of matching contour points, the 3-D coordinates of the object point are reconstructed according to (11). A total of four object points are reconstructed in space (Fig. 5). In the case of a pair of corresponding frontier points, a single object point is reconstructed.
5) B-Spline Approximation of Heart Splines. The coordinates of the focal point f1 for the first view are determined by solving the homogeneous equation P1f1 = 0. Similarly, the coordinates of the focal point f2 are determined. The distance of each of the reconstructed 3-D points from the line f1f2 (Fig. 5) is computed and the farthest point is assigned a 0.1 weight with the remaining three assigned 0.3. The weighted 3-D points (V0, V1, V2, V3) approximate a b-spline. This is performed as follows: 1) eight control vertices (V0, V1, V2, V3, V0, V1, V2, V3) are formed to generate a closed curve, 2) a quadratic spline is approximated from the control vertices using eleven knots (double knots at the end points enforce function continuity). The resulting spline, generated using the SPMAK function in MATLAB (Mathworks, Inc.), is tangent to the polygon lines joining (V0, V1, V2, V3).
Using the assigned weights, the point farthest from line f1f2 has the smallest effect on the shape of the spline whereas the three points closer to the line f1f2 have a greater influence. Using phantom studies we found that these empirically determined weights resulted in the most accurate approximations of the heart and confined the reconstructed splines within the torso. Other methods (not shown), using uniform weights or weights inversely proportional to the distance from the centroid of the four reconstructed points resulted in less accurate surface reconstructions.
6) Surface Generation and Visualization. Steps 3-5 are repeated for all contour points resulting in a set of 3-D splines. The 3-D convex hull of the splines is determined and a surface is meshed according to the following algorithm. The centroid of all splines (3-D points) is computed. All points are projected unto a unit sphere centered at the centroid. The convex hull of the points on the unit sphere is determined. The connectivity information returned by the convex hull is used to triangulate the original set of points resulting in a meshed and closed surface. In addition to simple meshing of 3-D points, interpolation or fitting of the given points to result in a smooth surface is also possible. The degree of discretization or smoothness of the reconstructed heart surface is controlled by interpolation or fitting. This is implemented by transforming the rectangular coordinates of the input points to spherical coordinates and interpolating or fitting a surface through the spherical points (Fig. 6). The fitting algorithm is based on a bicubic spline least squares fit. We used the NAG (NAG Ltd. Oxford, U.K.) foundation toolbox (functions E02DFF and E02DEF for bicubic spline fitting) to implement the algorithm in MATLAB. The algorithm is outlined as follows (Fig. 6).
Meshing algorithm. (a) Three-dimensional reconstructed splines. (b) Surface is fitted or interpolated through the transformed spherical coordinates corresponding to the 3-D splines. (c) Convex hull of the projected points on the unit sphere returns the (more )
Given 3-D points compute corresponding spherical coordinates:
interpolate or fit spherical points;
project onto unit sphere;
compute convex hull on unit sphere;
compute corresponding cartesian coordinates of interpolated or fitted spherical points;
use connectivity information (from 4) and points (from 5) to mesh the 3-D surface.
Once the surface is meshed we use MATLAB visualization commands to render the meshed surface in three dimensions. The triangulated surface elements are also used in the boundary element formulation [22] for ECGI.
7) Algorithm to Determine Body Surface ECG Electrode Positions. An algorithm to determine body-surface ECG electrode positions from stereo photographs has been developed. It is based on point reconstruction techniques. The calibration object (see Single View Calibration) is placed in the scene and two photographs are acquired sequentially using a digital camera (SONY DSC-S85). The absolute position of the camera or the relative relationship between the two sequentially acquired digital photographs is not required. The 3-D coordinates of the scene points (lead markers on the calibration object) are digitized (Microscribe G2L) in addition to four or more points on the torso. Single view calibration is performed to obtain the projection matrices for each photograph. The electrodes in each photograph are identified. Corresponding electrodes in a pair of photographs are matched by inspection and their corresponding 3-D coordinates are determined using point reconstruction.
C. Validation in a Phantom Study
1) Reconstruction of Heart Geometry. The fluoroscopy-based algorithm for determining heart surface geometry was validated using a realistic plastic heart model. The phantom heart was imaged using biplane fluoroscopy at various dual angles: anterior posterior (AP) 0, left anterior oblique (LAO) 70; right anterior oblique (RAO) 10, LAO 70; RAO 20, LAO 70; RAO 30, LAO 60; RAO 40, LAO 50; RAO 50, LAO 40. The heart surface was reconstructed from each pair of biplane angles. The phantom heart geometry was also acquired using an ultra fast spiral CT scanner (Philips Mx8000) at a sampling interval of 3.2 mm and a pitch of 0.5. The heart contour in each CT slice was segmented using deformable model segmentation [23]. The segmented cross sectional contours were then meshed to generate the CT heart. Four lead markers were affixed on the plastic heart model. The 3-D coordinates of the four lead markers were digitized during fluoroscopy using the Microscribe G2L digitizer. Also, the 3-D coordinates of the same markers were segmented from the CT slices. The four markers were then used to register the fluoroscopy reconstructed heart with the CT heart.
2) Three-Dimensional Localization of Body Surface ECG Electrode Positions. Accurate localization of the recording electrodes on the body surface is crucial for successful application of ECGI. A mannequin with ninety two visible markers (simulating actual electrodes) on the anterior surface was used for this study (see Fig. 10). The V-shaped calibration object was placed over the mannequin. Eight markers on the calibration object and six markers on the mannequin were digitized using a mechanical digitizer (Microscribe G2L) and used for single view calibration of each picture in stereo photographs. A total of three pairs of stereoscopic photographs were taken with a digital camera. Taken in pairs, the photographs were calibrated and the 3-D coordinates of corresponding markers were determined using point reconstruction. These were compared with the actual coordinates digitized using the mechanical digitizer (Microscribe G2L).
Localization of body surface ECG electrode positions using photography. (a) Stereo photographs of the mannequin with the calibration object (transparent structure) in view. (b) Signed distance error map for reconstructed electrode locations relative to (more )
D. Validation in a Human Study
The fluoroscopy
-based algorithm for reconstructing the heart surface geometry was validated in
a human subject. Written informed consent was obtained and the study was
approved by the Investigational Review Board at University Hospitals,
E. Error Analysis
Signed (positive implies outside; negative implies inside) distance measure is used to quantify the differences between the fluoroscopy-reconstructed heart and the gold standard CT heart. The distance error is computed as follows:
For each node, Nr , on the fluoroscopy-reconstructed heart:
compute the 3-D Euclidean distance to each node on the gold standard CT heart;
select the minimum Euclidean distance as the error, Er , associated with node Nr ;
denote the nearest node to Nr on the gold standard CT heart by NNg ;
compute the dot product between the vector joining the centroid of the gold standard CT heart and NNg with the vector joining NNg and Nr ;
assign the sign of the dot product to the error measure, Er .
Mean, maximum, minimum, and standard deviation of the signed distance error are computed over the entire surface of the fluoroscopy-reconstructed heart.
F. Application of Fluoroscopy-Reconstructed Heart Geometry to Electrocardiographic Imaging in a Human Subject
Noninvasive ECGI was performed in a human subject during normal heart rhythm. We acquired body surface potentials from 224 ECG electrodes using a previously described mapping system and an electrode vest [24] [Fig. 7(c)]. Recorded ECGs were amplified and bandpass filtered between 0.5 and 500 Hz. The heart was imaged using CT [Fig. 7(a)] as well as biplane fluoroscopy [Fig. 7(b)]. The fluoroscopy-based algorithm was used to reconstruct an envelope around the subject's heart. We also constructed the heart geometry from the CT slices. The locations of the body surface ECG electrodes were digitized using a 3-D mechanical digitizer (Microscribe G2L). Consequently, we formed two data sets describing the subject's geometry: 1) CT-constructed heart with digitized body surface electrodes [Fig. 7(d)] and 2) Fluoroscopy-reconstructed heart envelope with digitized body surface electrodes [Fig. 7(e)]. Using the boundary element method, the transfer matrices relating epicardial (for CT) or heart envelope (for fluoroscopy) potentials to body surface potentials were derived [22]. The recorded body surface potentials were used to compute potentials on the CT-constructed epicardium [Fig. 7(f)] and the fluoroscopy-reconstructed envelope [Fig. 7(g)] during normal cardiac electrical activation, using ECGI methodology [10]. We compared the imaged potentials on these two surfaces to evaluate the accuracy of the ECGI/fluoroscopy approach relative to the gold standard ECGI/CT approach. ECGI methodology was extensively validated and published previously [7]-[15], [25]. Briefly, body surface potentials were related to heart surface potentials through Green's second theorem. By discretizing the heart and body surfaces, we wrote
Evaluation of the fluoroscopy reconstructed heart in the context of ECGI. (a) CT image showing electrode locations and heart cross section. (b) Biplane fluoroscopic images. (c) Body surface vest for potential mapping. (d) Geometry data set derived from (more )
Where vT represented the vector of body surface potentials, vE the vector of heart surface potentials, and A the transfer matrix describing the geometrical relationship between the heart surface and positions of body surface ECG electrodes. Because of the ill posed nature of the problem Tikhonov regularization [26] was employed to minimize the following functional:
(13)
where λ represented the regularization parameter determined using the L-Curve [27] method.
Top
Abstract
I. Introduction
II. Methods
III. Results
IV. Discussion
V. Limitations
References III. Results
A. Validation of the Fluoroscopy-Reconstructed Heart Geometry - Phantom Study
Table I summarizes the results for the fluoroscopy-reconstructed phantom heart. For each pair of biplane angles, minimum, maximum, mean and standard deviation of the absolute distance errors relative to the CT heart are computed. In all cases, the mean distance error is approximately 4 mm. Fig. 8 shows results for selected biplane angles; AP, LAO 70 (left column); RAO 20, LAO 70 (second column); and RAO 30, LAO 60 (right column). The reference CT heart as segmented and constructed from the CT slices is shown in the top left column. The middle row shows the signed distance error maps for the fluoroscopy-reconstructed heart. Negative values indicate that the region of the fluoroscopy-reconstructed heart is interior to the CT heart and positive values indicate that it is exterior. The last row overlays the CT heart on the signed distance error map. In addition to biplane fluoroscopy, the algorithm for determining the heart geometry can be extended to multiple plane fluoroscopy. Fig. 9 shows the fluoroscopy-reconstructed heart from four views (AP, LAO 70 and RAO 30, LAO 60) in comparison to CT. Here, two sets of 3-D splines are reconstructed from each pair of biplane angles and the convex hull of all splines is obtained and meshed. Note that somewhat improved distance errors (mean decreased to 3.8 mm) are obtained suggesting that incorporation of four views can improve slightly the reconstructed heart geometry. Table I, last row summarizes the results for the four views case.
Summary of Errors for Phantom Study
Reconstructed phantom heart from biplane fluoroscopic views. CT heart (top) is shown for reference. Signed distance error maps (middle row) are shown for AP, LAO 70 (left column); RAO 20, LAO 70 (second column) and RAO 30, (more )
Reconstructed phantom heart from four fluoroscopic views. (a) CT heart.
(b) Signed distance error map. Maximum negative and maximum positive distance errors are displayed. (c) CT heart overlaid with signed distance error map.
B. Validation of ECG Electrodes Localization - Phantom Study
In a phantom study, point reconstruction techniques were employed to reconstruct the electrode positions from stereo photographs [Fig. 10(a)]. The electrode markers (black "x" marks) affixed on the anterior surface of the mannequin were identified in each image and matched. We obtained the projection matrix for each photograph using single view camera calibration. The reconstructed electrode positions were compared with the actual digitized coordinates from the scene. Fig. 10(b) shows the signed distance error map for the reconstructed electrodes on the anterior surface of the mannequin. The mean absolute distance error was 1 mm.
C. Validation of Fluoroscopy-Reconstructed Heart Geometry - Human Study
Fig. 11, left column, shows the signed distance error map for the fluoroscopy-reconstructed epicardial envelope in a human subject. The CT heart (right column) was used as gold standard for comparison. Anterior (top row) and posterior (bottom row) views are shown. Positive values indicate that the fluoroscopy-reconstructed epicardial envelope is exterior to the CT heart surface, while negative values indicate that it is interior. The average absolute distance error is 10 mm. Inset shows the histogram of nodes on the fluoroscopy reconstructed epicardial envelope versus absolute distance (0, 5, 10, 15, and 20 mm) from the CT heart. Note that more than 70% of the nodes on the fluoroscopy reconstructed envelope are within 10-mm distance from the CT heart.
Left: Signed distance error maps for anterior (top) and posterior (bottom) views of a fluoroscopy reconstructed envelope in a human subject. The CT heart (right) is shown for reference. Inset shows the histogram of nodes on the fluoroscopy reconstructed (more )
D. Noninvasive Imaging of Cardiac Electrical Activity in a Human Subject
We evaluate the fluoroscopy-based algorithm in the context of ECGI. Fig. 12 shows epicardial potentials imaged noninvasively using the fluoroscopy-reconstructed epicardial envelope (left image) and using the CT heart (right image) at 25 ms following the onset of ventricular excitation (QRS onset). Note the close similarity between the two potential maps. The potential minimum (dark blue) associated with right ventricular (RV) breakthrough (arrival of the activation front to the RV epicardial surface) [3] is reconstructed in both hearts, albeit with reduced amplitude on the fluoroscopy-reconstructed epicardial envelope. In addition, the overall potential patterns in both hearts reveal a global potential gradient from base to apex (negative potentials in green to positive potentials in red). The correlation coefficient (a measure of pattern similarity) between the potentials on the fluoroscopy reconstructed envelope and the nearest points on the CT heart is CC = 0.70.
Noninvasively imaged
epicardial potential map in a human subject using the fluoroscopy-reconstructed
envelope (left) and CT heart (right). Image is obtained 25 ms after QRS onset. RA, right atrium; RV, right ventricle;
Top
Abstract
I. Introduction
II. Methods
III. Results
IV. Discussion
V. Limitations
References IV. Discussion
The goal of this paper is to develop methods for determining subject specific geometry (heart geometry and body surface ECG electrode positions) for clinical application of ECGI in the EP laboratory, where procedures for diagnosis, treatment and monitoring of rhythm disorders of the heart are conducted. Fluoroscopy is readily available in the EP laboratory and is therefore the method of choice for determining heart surface geometry. Stereo photography is used to determine the positions of the body surface ECG electrodes.
A. Characteristics of the Fluoroscopy-Based Approach for Determining Heart Geometry
The method presented in this paper makes use of calibration objects (planar board and a V-shaped calibration object with affixed lead markers) to obtain the projection matrices describing each view in biplane fluoroscopy. Different from Hoffmann et al. [28], [29] where a calibration object is imaged following acquisition of biplane images in a patient, here both the patient and calibration objects are imaged simultaneously eliminating possible errors due to sequential imaging. While the methods of Chen et al. [30] and Hoffmann et al. [31] do not use a calibration object to obtain the imaging geometry relating the two views of a biplane sequence, they do require a priori knowledge of the imaging system parameters including the source-to-image intensifier distance, the distance between the two focal points and/or the distance between two 3-D points in the scene. Recently, a new method to reconstruct the location of known sparse objects from a single projection has been developed [32]. However, this method requires the use of an a priori model of the imaged object whose location and orientation are iteratively modified to align the viewing lines with the measured single projection. In contrast to other methods [28]-[32] that use an iterative nonlinear optimization technique to reconstruct 3-D points in space, the method presented in this paper is linear and involves simple numerical algorithms. Other methods that reconstruct the 3-D structure and shape of smooth objects from their occluding contours [33]-[36] require the acquisition of multiple images from a camera rotating around the object. Acquisition of such a large number of fluoroscopic projections is impractical during cardiac EP procedures and exposes the patient to high radiation. The method presented in this paper requires only two fluoroscopic projections, does not require information about the imaging system or the geometrical relationship between the two projections, does not involve any a priori assumptions about the heart geometry, and minimizes radiation exposure to the patient by requiring at most two sets of biplane fluoroscopic projections.
B. Accuracy and Sensitivity
The geometrical information required for application of ECGI includes: 1) localization of the body surface ECG electrode positions and 2) reconstruction of an epicardial envelope around the heart on which cardiac electrical activity is imaged. The point reconstruction technique to localize body surface recording electrodes using stereo photography is validated in a phantom study (mannequin with visible markers). The electrode positions are reconstructed to within 1 mm of their actual locations. This is well within the diameter (5 mm) of the electrodes used in our ECGI multielectrode vest [10]. In previous experiments, we demonstrate that 10-mm error in body surface electrode positions still provides acceptable ECGI images [7], [11], [13], [15]. Therefore, an error of 1 mm in localizing the body surface electrodes is very adequate for generating accurate ECGI images in the clinical setting.
While it is essential to obtain accurate body surface electrode positions, the epicardial envelope can be anywhere between the body surface and the heart (provided it does not intersect electrically active cardiac tissue, since ECGI methodology assumes a source-free volume between the body surface and the epicardial envelope) [10]. The location of the envelope does not affect the accuracy of the results obtained using ECGI, however, it influences how closely the results approximate the actual electrical activity on the heart surface, with loss of spatial resolution as distance from the heart increases. In a previous study using a canine heart in a human-shaped torso tank, we verified that an envelope 10 mm from the heart surface provides a very close approximation to the electrical activity recorded directly from the epicardium [8]. Results from the phantom study show that the distance errors for the fluoroscopy-reconstructed heart are on average 4 mm relative to the CT heart, while for the human study, the distance errors are on average 10 mm. Based on the previous canine study, such accuracy is adequate for imaging important characteristics of the heart electrical activity using ECGI.
The fluoroscopy-based reconstruction of the heart surface geometry is insensitive to the choice of biplane imaging angles. This is evident from the fact that for the fluoroscopy reconstructed phantom heart the average distance error remains 4 mm for all biplane angles. This renders the method usable with any combination of biplane angles used in a cardiac EP procedure and makes the approach very practical and robust.
C. Initial Evaluation of Fluoroscopy-Based Heart Reconstruction for Electrocardiographic Imaging in a Human Subject
Using the fluoroscopy-based algorithm for determining heart surface geometry, we conduct an initial evaluation of ECGI in a human subject to noninvasively image cardiac electrical activity during normal sinus rhythm. As shown in Fig. 12, the fluoroscopy reconstructed envelope on which the ECGI potential image is overlaid is sufficiently proximal to the heart to reflect details of the underlying cardiac electrical activity. This is shown in comparison with the ECGI image obtained using CT. Noninvasively imaged potentials on the fluoroscopy reconstructed epicardial envelope approximate those on the CT-constructed epicardium. Importantly, properties of physiological significance such as potential patterns, gradients, and minima associated with epicardial breakthrough are captured in the fluoroscopy reconstructed ECGI image.
Top
Abstract
I. Introduction
II. Methods
III. Results
IV. Discussion
V. Limitations
References V. Limitations
In order to achieve reliable reconstructions of the 3-D heart surface geometry from two or more fluoroscopic projections, it is required that the heart projects entirely within the image. One way to achieve this requirement is to use maximum magnification in the imaging system for both projections. While increasing the magnification might result in larger noise, it is possible to minimize its effect by normalization of the image and scene coordinates prior to single view calibration [17]. While no distortion correction is implemented on the acquired fluoroscopic images, we predict that minor improvements can result with distortion correction. Others [37] have reported errors to within 6 mm for 3-D reconstruction of coronary bypass grafts without distortion correction. This error is within the 10 mm distance error seen in our human study. In addition, current state of the art flat panel detectors provide distortion free fluoroscopic projections. The diaphragm obstructs the view of the apical and right lateral regions of the heart in the right anterior oblique and anterior posterior projections. This problem can be overcome by extrapolating the heart contour in the diaphragm portion of the image. Extrapolation can be improved by playing the multiframe fluoroscopic projections in an animated movie. Using animation, the outer boundary as well as an extrapolation of the heart contour behind the diaphragm region is more accurately delineated. Moreover, heart contour segmentation would be improved whenever dye is injected as part of an interventional electrophysiological procedure, resulting in more accurate visualization of the heart and vasculature. Validation of the photographic method to localize body surface ECG electrodes in humans was not conducted here, as visual access to the back electrodes requires the design of a partially transparent bed. However, once such visual access is available, the photographic method, as validated in the phantom study, is adaptable and applicable to humans without any modification.
Acknowledgments
The authors would like to acknowledge the assistance of C. Fugate and S. Frame in acquiring and analyzing the X-ray fluoroscopic images; L. Ciancibello for his assistance in acquiring and transferring the CT imaging data and K. Ryu for his assistance in body surface potential mapping.
The work of Y. Rudy was supported by the National Institutes of Health (NIH) NHLBI under Grant R37 HL-33343 and Grant R01 HL-49054. The Associate Editor responsible for coordinating the review of this paper and recommending its publication was S. Aylward. Asterisk indicates corresponding author.
Top
Abstract
I. Introduction
II. Methods
III. Results
IV. Discussion
V. Limitations
References References
Kavuru, MS.;Vesselle, H.; Thomas, CW. Advances in body surface
potential mapping (BSPM) instrumentation. In: Liebman J, Plonsey R, Rudy Y editors. Pediatric and Fundamental
Electrocardiography.
He
YH, Ghanem RN, Waldo
Rudy, Y. The electrocardiogram and cardiac excitation. In: Sperelakis
N, Kurachi Y, Terzic A, Cohen MV. , editors. Heart Physiology and Pathophysiology.
Plonsey,
R.; Barr, RC.
Bioelectricity: A Quantitative Approach. 2.
Spach MS, Barr RC. Ventricular intramural and epicardial potential distributions during ventricular activation and repolarization in the intact dog. Circ Res. 1975 -257. [PubMed]
Spach MS, Barr RC, Lanning CF, Tucek PC. Origin of body surface QRS and T wave potentials from epicardial potential distributions in the intact chimpanzee. Circulation. 1977 . [PubMed]
Rapport BM, Rudy Y. Noninvasive recovery of epicardial potentials in a realistic heart-torso geometry. Normal sinus rhythm. Circ Res. 1990 -1039. [PubMed]
Oster HS, Taccardi B, Lux RL, Ershler PR, Rudy Y. Noninvasive electrocardiographic imaging: Reconstruction of epicardial potentials, electrograms, and isochrones and localization of single and multiple electrocardiac events. Circulation. 1997 -1024. [PubMed]
Oster HS, Taccardi B, Lux RL, Ershler PR, Rudy Y. Electrocardiographic imaging: Noninvasive characterization of intramural myocardial activation from inverse-reconstructed epicardial potentials and electrograms. Circulation. 1998 -1507. [PubMed]
Rudy Y, Burnes JE. Noninvasive electrocardiographic imaging. Ann Noninvasive Electrocardiol. 1999 -359.
Burnes JE, Taccardi B, MacLeod RS, Rudy Y. Noninvasive ECG imaging of electrophysiologically abnormal substrates in infarcted hearts: A model study. Circulation. 2000 -540. [PubMed]
Burnes JE, Taccardi B, Ershler PR, Rudy Y. Noninvasive electrocardiographic imaging of substrate and intramural ventricular tachycardia in infarcted hearts. J Amer Coll Cardiol. 2001 -2078. [PubMed]
Burnes JE, Taccardi B, Rudy Y. A noninvasive imaging modality for cardiac arrhythmias. Circulation. 2000 -2158. [PubMed]
Burnes JE, Ghanem RN, Waldo AL, Rudy Y. Imaging dispersion of myocardial repolarization-I: Comparison of body-surface and epicardial measures. Circulation. 2001 -1305. [PubMed]
Ghanem RN, Burnes JE, Waldo AL, Rudy Y. Imaging dispersion of myocardial repolarization-II: Noninvasive reconstruction of epicardial measures. Circulation. 2001 -1312. [PubMed]
Faugeras, O. Three
Dimensional Computer Vision: A Geometric Viewpoint.
Hartley,
R.; Zisserman, A. Multiple View Geometry in Computer Vision.
Zhang ZY. Determining the epipolar geometry and its uncertainty: A review. Int J Comput Vision. 1998 -195.
X, G.; Zhang, Z.
Epipolar Geometry in Stereo, Motion, and Object Recognition: A Unified
Approach.
Rothwell C, Faugeras O, Csurka G. A comparison of projective reconstruction methods for pairs of views. Comput Vision Image Understanding. 1997 -58.
Brebbia, CA.;Telles, JCF.; Wrobel, LC. Boundary Element Techniques:
Theory and Applications in Engineering.
Kass M, Witkin A, Terzopoulos D. Snakes - Active contour models. Int J Comput Vision. 1987;1:321-331.
Laurita, K.;Sun, G.;Thomas, CW.;Kavuru, M.;Liebman, J.; Waldo, AL. Interactive cardiac mapping. I. Data acquisition; Proc 11th Annu Int Conf IEEE, Engineering in Medicine and Biology Soc; 1989. pp. 204-205.
Rudy
Y, Oster HS. The electrocardiographic inverse problem. Crit Rev Biomed
Tikhonov,
AN.; Arsenin, VY. Solutions of Ill-Posed Problems.
Hansen PC, Oleary
DP. The use of the L-curve in the regularization of discrete
Ill-posed problems.
Hoffmann KR, Williams BB, Esthappan J, Chen SY, Carroll JD, Harauchi H, Doerr V, Kay GN, Eberhardt A, Overland M. Determination of 3D positions of pacemaker leads from biplane angiographic sequences. Med Phys. 1997;24:1854-1862. [PubMed]
Esthappan J, Harauchi H, Hoffmann KR. Evaluation of imaging geometries calculated from biplane images. Med Phys. 1998;25:965-975. [PubMed]
Chen
SY,
Hoffmann KR, Metz CE, Chen Y. Determination of 3-D imaging geometry and object configurations from two biplane views: An enhancement of the Metz-Fencil technique. Med Phys. 1995;22:1219-1227. [PubMed]
Hoffmann KR, Esthappan J. Determination of three-dimensional positions of known sparse objects from a single projection. Med Phys. 1997;24:555-564. [PubMed]
Ahuja N, Ponce J. Structure and motion estimation from dynamic silhouettes under perspective projection. Int J Comput Vision. 1999;31:31-50.
Weiss R. Robust shape recovery from occluding contours using a linear smoother. Int J Comput Vision. 1998;28:27-44.
Mohr R. Global three-dimensional surface reconstruction from occluding contours. Comput Vision Image Understanding. 1996 -96.
Dorsaz PA, Dorsaz L, Doriot PA. The effect of image distortion on 3-D reconstruction of coronary bypass grafts from angiographic views. IEEE Trans Med Imag. 2000 July -762.
Electrocardiographic imaging (ECGI), a novel diagnostic modality used for mapping of focal left ventricular tachycardia in a young athlete
Anselma Intini, MD,a Robert N Goldstein, MD,a Ping Jia, PhD,c Charulatha Ramanathan, PhD,c Kyungmoo Ryu, PhD,c Bartolomeo Giannattasio, MD, PhD,a Robert Gilkeson, MD,b Bruce S. Stambler, MD,a Pedro Brugada, MD,d William G. Stevenson, MD,e Yoram Rudy, PhD,cf and Albert L. Waldo, MDa
aDepartment of Medicine (Cardiology), Case Western
Reserve University/University Hospitals of Cleveland,
bRadiology, Case Western Reserve University/University
Hospitals of Cleveland,
cBiomedical Engineering, Case Western Reserve
University/University Hospitals of Cleveland,
dCardiovascular Center Aalst/OLV Hospital,
eDepartment of Medicine (Cardiology) Brigham and Women's
Hospital,
fPresent affiliation: Cardiac Bioelectricity and
Authors Ping Jia and Charulatha Ramanathan are employees and stockholders of CardioInsight, Inc., a company that plans to commercialize electrocardiographic imaging as a clinical tool. The other authors have no conflict of interest to disclose.
Address reprint requests and correspondence: Albert L Waldo, MD, Division of Cardiology, University Hospitals of Cleveland, 11100 Euclid Avenue, Cleveland, Ohio 44106. E-mail address: albert.waldo@case.edu.
The publisher's final edited version of this article is available at Heart Rhythm.
See other articles in PMC that cite the published article.
Top
Abstract
Case report
Methods and results
Discussion
References Abstract
We report the first
clinical application of electrocardiographic imaging (ECGI), a new, noninvasive
imaging modality for arrhythmias, in an athlete with focal ventricular
tachycardia (VT) originating from a left ventricular (
Keywords: Imaging, Mapping, Arrhythmia, Epicardial, Ventricular Tachycardia
Top
Abstract
Case report
Methods and results
Discussion
References
As summarized recently,1,2 electrocardiographic imaging (ECGI) is a new, noninvasive, imaging modality for cardiac electrophysiology (EP). This technique has been in development for many years. It derives from the desire to have a true noninvasive imaging modality for diagnosis of arrhythmias beyond the diagnostic capabilities of the 12-lead ECG. The latter technique still cannot provide precise information on or localization of regional electrical activity in the heart, nor can it provide the sequences of activation during arrhythmias. Body surface potential mapping (BSPM) can provide more electrical and diagnostic information than the 12-lead ECG, but, as summarized recently has serious limitations that stem from the remote locations of the body surface electrodes relative to the heart. Limitations include low sensitivity in detecting abnormal activation and repolarization and inability to determine their location in the heart. Importantly, BSPM cannot provide the actual sequence of activation of the cardiac impulse during arrhythmias. Therefore, its use has been quite limited. Because of the above limitations, efforts have been made over the last 25 years to reconstruct epicardial activation sequences from body surface measurements obtained noninvasively, that is, to solve the so-called inverse problem of electrocardiography.4
ECGI represents an inverse technique to determine noninvasively and with high resolution the electrical activity of the heart from electrical data recorded on the body surface together with cardiac CT images. These data are used to reconstruct epicardial potential maps, epicardial electrograms, and maps of epicardial activation and repolarization.1 This technique has been studied extensively and has been tested and validated experimentally in a torso-tank model, in the normal and abnormal canine heart,5-11 and, recently, in humans.1 In particular, it has successfully provided images of cardiac activation and repolarization during normal excitation, during ventricular pacing, in the presence of conduction disturbances, and during atrial flutter.
ECGI has been recently evaluated through comparison with intraoperative mapping in patients undergoing cardiac surgery and has demonstrated accuracy better than 10 mm in locating focal activity initiated by pacing.12,13 But to date ECGI has not been used as a primary clinical tool for arrhythmia diagnosis and management.
Here we describe the first case in which ECGI was used in a patient to assist in the diagnosis and management of a tachyarrhythmia, an unusual ventricular tachycardia (VT). In particular, ECGI was applied to guide the catheter ablation of a focal VT in a young athlete. This case further validates the ECGI technique, but in a real clinical setting.
Top
Abstract
Case report
Methods and results
Discussion
References Case report
A 29-year-old
athlete with no significant past medical history was referred to our
institution for EP consultation. He had asymptomatic premature ventricular
complexes (PVCs) on a routine, otherwise normal ECG and was subsequently shown
to develop a spontaneous, sustained, wide QRS complex tachycardia (WCT) during
an exercise treadmill test (Figure 1). On presentation to our hospital, the
physical exam was normal and the baseline ECG was normal. Further diagnostic
testing was performed. An echocardiogram was normal apart from a small left
ventricular (
Twelve-lead ECG of the patient's clinical tachycardia. Rhythm strip is shown in the bottom panel is lead II. Paper speed = 25 mm/second.
Cardiac
CT scan of a cross section of the LV. Note the small
Top
Abstract
Case report
Methods and results
Discussion
References Methods and results
Before an invasive EP study, isolated PVCs of an identical morphology to the WCT were recorded using a body-surface 224-electrode vest covering the circumference of the thorax, along with a chest CT anatomic scan (the ECGI procedure).1 The noninvasively reconstructed epicardial electroanatomic ECGI map localized the origin of the PVCs to the LV apex (Figure 3A), precisely to the area of the diverticulum. Importantly, the QS wave pattern of the reconstructed electrogram from the site of origin of the PVCs indicated that those beats were emanating from the ventricular epicardium at that site (Figure 3A).
Comparison of three different modalities of mapping in this patient with focal VT. A Reconstructed activation map of a single PVC using noninvasive ECGI. A reconstructed epicardial electrogram from the PVC site of origin (asterisk) is also shown. B Endocardial (more )
An invasive EP study
was then performed, guided by the noninvasive ECGI images. The tachycardia was
sustained but could only be induced in the presence of isoproterenol (1-2
μg/minute). Intracardiac activation mapping during tachycardia
demonstrated earliest activation in the apical
VT recurred, and
because we had the ECGI data indicating an epicardial origin of the arrhythmia,
an epicardial mapping and ablation procedure was performed at another center
via a subxiphoid puncture. Earliest activation of ventricular ectopic activity
with a morphology similar to that of VT was identified in a region of low
voltage (<1.45 mV) at the
Top
Abstract
Case report
Methods and results
Discussion
References Discussion
We describe the first case in which ECGI has been used in a real clinical scenario to assist in the diagnosis and therapy of a patient with a tachyarrhythmia, in this case a VT. Noninvasively, and before any invasive EP study, ECGI generated a map of the epicardial activation sequence during a single PVC. This map guided the following invasive EP studies by indicating the origin of the tachycardia. Furthermore, the map generated by the ECGI correlated precisely with the invasive epicardial maps created using standard EP mapping techniques. Thus, this example describes the first case in which ECGI provided important information regarding the origin of a patient's clinical arrhythmia before embarking on an invasive EP study and attempting therapeutic ablation. It serves also as a harbinger of the possible use of this technique to assist in the management of both simple and complex cardiac arrhythmias.
Footnotes
EDITOR'S NOTE: Although case reports are limited to four authors, we made an exception in this case because of its complexity and the need for collaboration among multiple experts.
Top
Abstract
Case report
Methods and results
Discussion
References References
Ramanathan C, Ghanem RN, Jia P, Ryu K, Rudy Y. Noninvasive electrocardiographic imaging for cardiac electrophysiology and arrhythmia. Nat Med. 2004 -428. [PubMed]
Rudy Y, Burnes JE. Noninvasive electrocardiographic imaging (ECGI). Ann Noninvas Electrocardiol. 1999 -359.
Taccardi, B.;
Punske, B. Body surface potential mapping. In: Zipes DP, Jalife J editors. Cardiac electrophysiology: from cell to
bedside. WB Saunders;
Oster HS, Taccardi B, Lux RL, Ershler PR, Rudy Y. Noninvasive electrocardiographic imaging: reconstruction of epicardial potentials, electrograms, and isochrones and localization of single and multiple electrocardic events. Circulation. 1997 -1024. [PubMed]
Oster HS, Taccardi B, Lux RL, Ershler PR, Rudy Y. Electrocardiographic imaging: noninvasive characterization of intramural myocardial activation from inverse-reconstructed epicardial potentials and electrograms. Circulation. 1998 -1507. [PubMed]
Burnes JE, Taccardi B, MacLeod RS, Rudy Y. Noninvasive ECG imaging of electrophysiologically abnormal substrates in infarcted hearts: a model study. Circulation. 2000 -540. [PubMed]
Burnes JE, Taccardi B, Rudy Y. A noninvasive imaging modality for cardiac arrhythmias. Circulation. 2000 -2158. [PubMed]
Ramanathan C, Rudy Y. Electrocardiographic imaging. II. Effect of torso inhomogeneities on the noninvasive reconstruction of epicardial potentials, electrograms and isochrones. J Cardiovasc Electrophysiol. 2001 -252. [PubMed]
Ghanem RN, Burnes JE, Waldo AL, Rudy Y. Imaging dispersion of myocardial repolarization. II. Noninvasive reconstruction of epicardial measures. Circulation. 2001 -1312. [PubMed]
Burnes JE, Taccardi B, Ershler P, Rudy Y. Noninvasive ECG imaging of substrate and intramural ventricular tachycardia in infarcted hearts. J Am College Cardiol. 2001;38:2071-2207.
Ghanem RN, Jia P, Ramanathan C, Ryu K, Markowitz A, Rudy Y. Noninvasive electrocardiographic imaging (ECGI): comparison to intraoperative mapping in patients. Heart Rhythm. 2005 -354. [PubMed]
Ghosh S, Rudy Y.
Accuracy of quadratic versus linear interpolation in noninvasive
electrocardiographic imaging (ECGI). Ann Biomed
|
Politica de confidentialitate | Termeni si conditii de utilizare |

Vizualizari: 7799
Importanta: ![]()
Termeni si conditii de utilizare | Contact
© SCRIGROUP 2025 . All rights reserved