| CATEGORII DOCUMENTE |
| Bulgara | Ceha slovaca | Croata | Engleza | Estona | Finlandeza | Franceza |
| Germana | Italiana | Letona | Lituaniana | Maghiara | Olandeza | Poloneza |
| Sarba | Slovena | Spaniola | Suedeza | Turca | Ucraineana |
HEALTH INDICATORS
Abstract: The state of health is a fundamental resource for persons as well for the society, being an important factor for the social development and for rising the economical level of a society. A sick society is less productive, and this is an obstacle in economical development and it takes high costs for curing, finally paid by the beneficiaries. Cristina Dobos noted a sick society could cost more the budget due to the consequences in long term, rather by resolving some health problems in the target points in present (Zamfir, 2006, 230). Therefore, the population health state is a social state which can negatively affect the good functioning of the society or the person condition, inscribing itself in this way in the social problem category, and the analysis of this indicators draws attention to the necessity of implementation of some health politics and especially for educating the persons with the goal of preventing the apparition of certain affections or chronic diseases.
Key words: health, diseases, social development, indicators, health politics
1. How to measure the state of health?
There are more categories of indicators by which this phenomenon can be measured. Depending on the method of measure there are objective indicators and subjective indicators. The objective indicators, regarding the measure of the state of health are based on the measure of this state in time while the subjective indicators depend on the evaluation of the populations opinions with regard to the conditions that lead to the state of health. For example, the measure of the number of ill persons from one population is an objective indicator, while the registering of the opinions regarding their own health is a subjective indicator. The subjective indicators must be used with precaution, allowing the identification of specific sides of social consciousness and under no circumstances should they be used as replacement for the objective indicators.
Depending on the characteristics that they measure, there are system indicators (global) and individual indicators. System indicators give information regarding the state of health at the level of population: crude mortality rate or rate of morbidity at the level of the population of the whole country. Individual indicators are aggregate indicators that include information about persons, highlighted by summing up all the information about those persons. For example, an individual indicator could be calculated based on some data from a research in which the persons included in the sample are questioned about a series by physiological symptoms. Totalizing the results for a measured item it results an indicator of the state of health.
Depending on the method of analysing the data, there are direct indicators and indirect indicators. Direct indicators rely on direct measurements of the variable itself, while indirect indicators rely on approximations or on indirect relations with other variables. For example, the state of health can be measured by direct indicators: blood test, symptomathology etc. In the same time, the state of health can be measured indirectly by death rate. The problem is that the indirect indicators can change their value without the state of health changing its value. It is possible that death rate decreases but the state of health of the persons doesnt decrease, in other words there are fewer people who die, but their sickness level is the same.
Not to be omitted the fact that when specialists from medical sociology analyze the problem of a persons state of health in their correlation with different factors, especially indirect-subjective or objective indicators are being used. The persons must declare if there are some symptoms or if they do or do not certain activities and depending on those results it is determined the sickness level of the persons. For example, a component of the state of health is physic health. The subjects declare if they can do certain activities, their physic mobility, if they can move without pain or discomfort, and depending on their responses they are included in different categories of health. Although the measuring indicators look like they are objective, because they measure real facts, they are rather subjective indicators, because they represent the mode in that the persons perceive that they can do certain things. An older man can declare that he has good physic mobility, but by a point of view of the younger person that older man has bad physic mobility. His opinion can be justified by the fact that he is comparing himself with other persons of his age. Anyway, these kinds of indicators measure much better the state of health than subjective indicators, which express globally the satisfaction by their own health.
2. Objective indicators of the state of health.
As a rule we can say that the state of a persons health is measured by general mortality rate, infant mortality rate, life expectancy and morbidity. The infant mortality rate supposes the knowledge of deaths until 1 year. Although apparently it is easier to calculate these indicators, problems appear because the number of deaths is affected by errors of registrations bigger than at other ages, because a series of infant deaths, especially those from the first birthdays, are not registered as they are.
Also the crude mortality rate has some difficulties, because it includes the influence of the age structure. A population A, which has an age structure grown old, will have a mortality rate bigger than a younger population B, but this one does not mean that population A is less healthy than population B. This indicator can be use especially for comparisons between populations with similar age structures. However, this indicator can offer general information about the state of health in a population.
Other indicator that measure the state of population health is morbidity, that measures the frequencies of ill cases new registered in a certain territory an in a certain period (month, semester, year) by territorial health centres or enterprise health centres and reported by medium number of population. (Novak Andrei, in Sociology dictionary -on-line).
The life expectancy is an indicator of the state of population health and an inverse indicator of mortality depending on the calculations made on the mortality table.
The life expectancy is The medium number of years that has to live from now one a hypothetic cohorts member at the moment of his birth, considering that he will continue having, at each age, the intensity of mortality caused by real population in the year when was made the mortality table. (Trebici, 1982, 60).
The author mentioned above presents more concepts that refer to the same indicator: medium life (medium age) or medium length of life or life expectancy at birth. The life expectancy can also be determined at other age not only at birth, that is why the exact name is life expectancy at age x. A different concept from life expectancy is length of life that refers to the maxim number of years that a life form is able to live. (Agabrian, 2003, 271).
The length of life of a person can not be measured with precision because it does not exist a way to calculate the superior limit of life. Referring to the same concept Vladimir Trebici names it longevity, which is considered by most specialists in biology to be approximately 110-115 years. It is considered that in the absence of different risks of death the people should normally reach this age.
Table no. 1: Main indicators of measurement of the state of health.
|
Health indicators |
||||
|
Objective |
Subjective |
|||
|
Indirect |
Direct |
Direct/Indirect |
||
|
Mortality Indicators |
|
Life expectancy |
Healthy life expectancy |
Indicators measured: trough opinion scale: -global indicators (regarding to the general state of health) -sectorial indicators (regarding to the dimensions of the healths state: mobility, rapidity, pain etc. |
|
Infant mortality |
Morbidity |
|||
|
Crude mortality rate | ||||
|
Modal age death | ||||
|
Secondary |
Median age death | |||
|
Indicators of ensuring with human resources (doctors, pharmacist etc) |
||||
|
The access to medical services |
||||
|
Incomes allocated to health |
||||
There are two other indicators that refer to the same demographic phenomenon (mortality) and give in this way information as well about life expectancy and state of people health: normal life and probable life.
Probable life, also named median life, is the age when the numbers of survivors diminish at half or in others words is the length of life that a new born child has one chance out of two to pass over (Trebici, 1982, 61).
The normal life, also named modal age death, is the age when most deaths occur (Trebici, 1982, 61).
From all indicators of mortality, life expectancy is the most used, because it synthesises the level of population mortality at all ages. At the same level also is infant mortality rate because there is a major effect to life expectancy, the death of children with age until 1 year meaning the loss of many years of potential life. The life expectancy reflects the mortality at all ages; therefore an increase in the life expectancy is caused primarily by the diminution of infant mortality.
2.1. The analysis of objective indicators
2.1.1. Direct indicator
2.1.1.1.The healthy life expectancy.
This indicator (Healthy Life Years-HLY) measures how many years a person has left to live according to his/her age, without any severe or moderate limitations due to health problems, in other words without disabilities. This indicator is calculated by the Sullivan method (the most famous -1970) and combines mortality data and morbidity data. This method is also used by Eurostat. In the mortality table, based on which life expectancy is calculated, at the rubric deceased are also included the persons which have severe or moderate health problems and whose daily activities are limited to at least six months.
The mortality data is
extracted from the mortality table and the data regarding morbidity is based on
superior measurement. The European Commission used a questionnaire for data
regarding morbidity. Some countries did not take part of this research so in
the table regarding this indicator there is not data for all the countries from
the European Union. There is no data regarding healthy life expectancy for
Table no. 1: Healthy life expectancy and life expectancy in UE in 2005.
|
Country |
Healthy life expectancy at birth |
Healthy life expectancy |
Healthy life expectancy at birth |
Healthy life expectancy |
|
men |
women |
|||
|
EU-25 | ||||
|
BE (2005) | ||||
|
CZ (2005) | ||||
|
DK (2005) | ||||
|
DE (2005) | ||||
|
GR (2005) | ||||
|
EE (2005) | ||||
|
ES (2005) | ||||
|
FR (2005) | ||||
|
IE (2005) | ||||
|
IT (2004) | ||||
|
CY (2005) | ||||
|
| ||||
|
LT (2005) | ||||
|
LU (2005) | ||||
|
HU (2005) | ||||
|
MT (2005) | ||||
|
NL (2005) | ||||
|
AT (2005) | ||||
|
PL (2005) | ||||
|
PT (2005) | ||||
|
FI (2005) | ||||
|
SW (2005) | ||||
|
| ||||
|
NO (2005) | ||||
|
ISL (2005) | ||||
Source: Eurostat on-line Database
It can be noticed that there are differences of approximately 5-7 years between the two indicators and 8-9 years for women, against the life expectancy. In other words, people live approximately 5-9 years in bad health conditions. It can be noticed that women have a longer life expectancy than men, but their length of healthy life expectancy is lower than the one of men.
2.1.1.2. Morbidity
It refers to the cases of sickness. Here there are more indicators regarding to the same thing but expressed in different ways
New cases of sickness: it takes into account only the sick that were discovered in the course of the year. There are included also those persons which were ill before but they got sick again.
It can be taken in consideration new people that are discovered being sick but also those that are chronic sick people and they are identified by the family doctor.
Hospitalization morbidity: refers to sick people cases which require few hospitalization days
It must be highlighted the fact that this indicator
refers only to the persons which are discovered. Of course, besides these
persons, there is another significant percent that does not discover the
sickness or does not visit the doctor only when the disease is chronic or
severe. According to the data presented further on, 7.4% from all the
population of
Tabel no.2: Morbidity in
|
Disease |
Thousands of people |
|
Infectious and parasitical illnesses | |
|
Tumours | |
|
Endocrine, nutrition and metabolism illnesses | |
|
Blood illnesses of the haematopoietic organs | |
|
Mental disorders | |
|
Nervous system and sense organs illnesses | |
|
Circulatory system illnesses | |
|
Breathing apparatus illnesses | |
|
Digestive apparatus illnesses | |
|
Genital and urinary illnesses | |
|
Birth, Pregnancy and Confinement complications | |
|
Skin and tissue illnesses | |
|
Bone and muscular system illnesses | |
|
Congenital anomaly | |
|
Prenatal illnesses | |
|
Defined bad state | |
|
Traumatisms, Poisoning | |
|
Total | |
|
Total country population |
2.1.2. Indirect indicators.
2.1.2.1. Life expectancy at birth
According to Eurostat data,
Table no.2: The Life expectancy in the world in 2005.
|
Rank |
Country |
Value/ |
Unit |
Rank |
Country |
Value / |
Unit |
|
|
years |
years |
|||||
|
|
years |
|
years |
||||
|
|
years |
|
years |
||||
|
|
years |
|
years |
||||
|
|
years |
|
years |
||||
|
|
years |
years |
|||||
|
|
years |
Romania |
years |
||||
|
Sweden |
years |
years |
|||||
|
Australia |
years |
Mozambique |
years |
||||
|
Iceland |
years |
Lesotho |
years |
||||
|
Angola | |||||||
|
Albania |
years |
Zambia |
years |
||||
|
Taiwan |
years |
Botswana |
years |
||||
|
Cuba |
years |
years |
Source: https://www.geographyiq.com
2.1.2.2. General mortality
The same unfavourable position is when we refer to general mortality: the 52nd place in the world and the 10th place in Europe. The 10th place in Europe can be explain by the fact that the Romanian population structure is younger than the other countries and so the mortality rate is lower, in reality the general mortality rate being higher. This indicator presents us an image of the state of health population rather grey, in the situation when countries with an older population than Romania (Italy, Germany, Sweden, and Spain) have a general mortality much lower. In comparison with countries from around the world, Romania is surpassed especially by the African countries.
Table no.3: The general mortality rate in the world in 2005.
|
Rank |
Country |
Value / |
Unit |
|
Botswana |
deaths/1,000 population |
||
|
Angola |
deaths/1,000 population |
||
|
Lesotho |
deaths/1,000 population |
||
|
Zambia |
deaths/1,000 population |
||
|
Mozambique |
deaths/1,000 population |
||
|
Zimbabwe |
deaths/1,000 population |
||
|
Romania |
deaths/1,000 population |
||
|
Libya |
deaths/1,000 population |
||
|
Brunei |
deaths/1,000 population |
||
|
American Samoa |
deaths/1,000 population |
||
|
Saudi Arabia |
deaths/1,000 population |
||
|
Jordan |
deaths/1,000 population |
||
|
Kuwait |
deaths/1,000 population |
Source: https://www.geographyiq.com
2.1.2.3. Infant mortality.
The situation that is more alarming is the infantile mortality, where according to Eurostat we were on the 2nd place in Europe in the year 2006, after Turkey and Moldavia. In the world we were situated on 89th place in 2005. The same with the general mortality and the infantile mortality Romania is mainly surpassed by the African countries. Romania has a high infantile mortality of 24 children from 1000 of new born babies in the situation that countries from Europe like Sweden, France, Finland or Norway have fewer than 4 dead children from 1000 of new born babies.
This indicator confers information about low quality of medical services in Romania because babies in their first year of life depend the most on medical services and are the most vulnerable to infections with viruses or bacteria.
Table no.4: The infantile mortality rate in 2005
|
Rank |
Country |
Value |
Unit |
Rank |
Country |
Value |
Unit |
|
Angola |
deaths/1,000 live births |
Romania |
deaths/1,000 live births |
||||
|
Sierra Leone |
deaths/1,000 live births | ||||||
|
Afghanistan |
deaths/1,000 live births |
Norway |
deaths/1,000 live births |
||||
|
Liberia |
deaths/1,000 live births |
Finland |
deaths/1,000 live births |
||||
|
Niger |
deaths/1,000 live births |
France |
deaths/1,000 live births |
||||
|
Somalia |
deaths/1,000 live births |
Iceland |
deaths/1,000 live births |
||||
|
Mozambique |
deaths/1,000 live births |
Hong Kong |
deaths/1,000 live births |
||||
|
Mali |
|
deaths/1,000 live births |
Japan |
deaths/1,000 live births |
|||
|
Guinea-Bissau |
deaths/1,000 live births |
Sweden |
deaths/1,000 live births |
||||
|
Chad |
deaths/1,000 live births |
Singapore |
deaths/1,000 live births |
||||
Source: https://www.geographyiq.com
Modal age at death and median age at death
Table no. 5: The death person count in 2005 depending on group of age
|
Group of age |
Year 2007 |
|
No. of persons |
|
|
0- 4 years | |
|
5- 9 years | |
|
10-14 years | |
|
15-19 years | |
|
20-24 years | |
|
25-29 years | |
|
30-34 years | |
|
35-39 years | |
|
40-44 years | |
|
45-49 years | |
|
50-54 years | |
|
55- 59 years | |
|
60-64 years | |
|
65-69 years | |
|
70-74 years | |
|
75-79 years | |
|
80-84 years | |
|
85 years and over | |
|
Total |
The modal age at death is somewhere between 75-79 years and the median age at death is between the age of 40-44 years. The life expectancy is approximate 72 years in Romania, by other words a Romanian can live nearly 72 years. This value is calculated taking into consideration also the deaths from a lower age. Therefore, if we want to know at what age a person can die, we look at modal age at death and we come to the conclusion that a person from Romania can live until 75-79 years. This value and also median age at death can be useful for comparisons between countries. In Romania half of the population dies until the 40-44 years. The causes to halving of population at this age must be seen by correlation with statistics regarding the causes of death.
2.1.2.5. Indicators of ensuring with human resources
Table no. 6: The insurance witch medical human resources of population from Romania in 2005
|
Medico-sanitary personnel |
Number of persons at 1000 inhabitants |
|
Doctors | |
|
Dentists | |
|
Pharmacists | |
|
Medium sanitary personnel |
Source: https://www.insse.ro
In 2002, according to the published data by European Commission, Romania has the smallest number of doctors for 1000 inhabitants from the European states.
2.1.2.6. Access to medical services
Table no.7: Sanitary units in Romania in 2005.
|
Sanitary units |
Number of units |
|
Hospitals | |
|
Ambulatory of hospital an speciality | |
|
Policlinics | |
|
Health centres | |
|
Health centres | |
|
Sanatoriums | |
|
Watering Sanatoriums |
Source: https://www.insse.ro
2.1.2.7. Incomes allocated to health
Table no. 8: The distribution of incomes in Romania in 2005.
|
Expenditure |
Percents |
|
Non-alcoholic and food products | |
|
Alcoholic drinks and tobacco | |
|
Shoes and clothes | |
|
House, water, electricity, methane gas and other combustible | |
|
Furniture, equipping and keeping of the house | |
|
Health | |
|
Transport | |
|
Communications | |
|
Recreation and culture | |
|
Education | |
|
Hotels/restaurants/coffee shops | |
|
Different services |
Source: https://www.insse.ro
These indicators can offer an image of the state of health. When Romanians are spending the least for health but they prefer to spend more for alcoholic drinks and tobacco, it is obvious that there is an incidence of diseases to the population caused by alcohol and tobacco.
2.1.2. Subjective indicators of the state of health.
From the data analysis of opinion barometric from 2006, realised by Metro Media Transylvania, it results that 49% of persons declare themselves satisfied by their state of health and 51% declare that they are unsatisfied. On the other hand 56.8% answer to another question that their problems in general are due to their health problems. By other words, in reality there can be a much higher number of unsatisfied persons than they declare. The major problems for the citizens are the incomes, expenditures and on the third place is their health. In Eurobarometru carried out in May-June 2007 by the European Commission, are presented data related to the state of health of the citizens from European Union. The indicators are subjective because the persons are interviewed about their lifestyle. Romanians perceive themselves as sedentary, considering that they do not eat healthy and they are saying that they smoke a lot.
However these results do not cross over the average for Europe, in other words, the life style of the Romanians is comparable with that of other citizens from Europe. Their representation about themselves is better on other dimensions questioned: stress at work and in relations, overweight, pollution environment and phonic pollution, alcohol consumption. Alcohol consumption is least admitted, with the exception of a few countries: Ireland, Leetonia, Lithuania, and Austria, where it is known to be a high consumption of alcohol. Only 6% of Romanians believe that they drink too much. The problem with subjective indicators is that sometimes because of social desirability we can obtain erroneous data, people answering how it should be and not how it is in the real life. Now in Romania, 10% from the Romanian population has problems with the alcohol, according to an official statistic of the Ministry of Health, Romania being one of the fewest countries where the pubs have customers from 7 a.m. The Romanians consume annually 21.1 litres of wine, 78.2 beers and 1.9 distilled drinks. Although only 6% of Romanians declare that they drink more alcohol, we being at the basement of the top, in reality we overcome the average of 15 litres of alcohol per year.
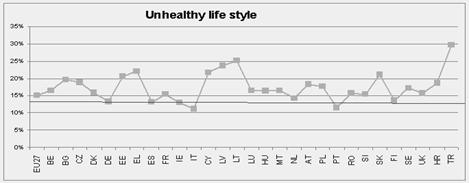
Figure no. 1: Unhealthy life style from European countries
Note: the percent from the graphic represents an average from the percentage for each identified item for the answering categories strongly agree and agree. The lowest values the highest declared healthy life style.
According to the peoples image about their own life style, Italy, Portugal are the countries witch the healthiest life style, being followed by Germany, Spain, Ireland and Finland. In the third category are included the majority of the countries among them Romania and on the last place Turkey, Lithuania, Leetonia, Cyprus and Greece. This classification does not show us that the things are like this also in reality, it could be a classification of the most earnest regarding to their life style.
More than 40% from the surveyed persons are informed regarding the consequences of their life style and they consider that if they give up habits the life expectancy could rise. Romania is one of the countries were the majority of the people think that a healthy life style could rise their life expectancy. In these conditions a prevention campaign regarding the health could have a great impact towards citizens, with the condition that this campaign should be made according to their expectancies.
Figure no. 2: The growing of life expectancy if the subjects should renounce at actually life style
Note: the percent represent percentage of the persons who consider that quitting the unhealthy elements could rise life expectancy with a few years.
Bibliography:
Agabrian, Mircea. (2003). General sociology. Iasi:Publishing House Institutul European.
Egidi, Viviana, Frova, Luisa and Verdecchia, Arduino. (1997). Speranza di vita totale e di vita in buona salute: un approccio statistico in La salute degli anziani in Italia (Atti del convegno tenuto a il 21-22 marzo 1995), Roma: Publicata di Istituto di ricerche sulla popolazione, pp.297-321.
Lucut, Grigore and Radulescu, Sorin M. (2000). Life quality and social indicators. Bucharest: Publishing House Luminalex.
Rotariu, Traian. (2003). Population demography and sociology. Bucharesti: Publishing House Polirom.
Trebici, Vladimir. (1982). What is demography? Bucharest: Scientific and enciclopeadic publishing house.
Trebici, Vladimir. (1975). A small demographic encyclopaedia. Bucharest: Scientific and enciclopeadic publishing house.
Zamfir, Catalin and Vlasceanu, Lazar (co-ordinatings). (1993). Sociology dictionary. Bucharest: Babel publishing house.
Tarca, Mihai (1997). Demography, information, methods, analyses and prognosis. Bucharest: Economical publishing house.
www.insse.ro
www.geographyiq.com
https://epp.eurostat.ec.europa.eu/
https://statistici.insse.ro https://ec.europa.eu/health/ph_information/indicators/lifeyears_en. htm
|
Politica de confidentialitate | Termeni si conditii de utilizare |

Vizualizari: 1114
Importanta: ![]()
Termeni si conditii de utilizare | Contact
© SCRIGROUP 2025 . All rights reserved