| CATEGORII DOCUMENTE |
| Bulgara | Ceha slovaca | Croata | Engleza | Estona | Finlandeza | Franceza |
| Germana | Italiana | Letona | Lituaniana | Maghiara | Olandeza | Poloneza |
| Sarba | Slovena | Spaniola | Suedeza | Turca | Ucraineana |
DOCUMENTE SIMILARE |
|||
|
|||
TERMENI importanti pentru acest document |
|||
GLOBAL ENERGY SOURCES
INTRODUCTION
The global energy problems have been discussed for a long time; they are well known. Depletion of natural energy carriers (oil, gas and coal) is the first problem. Environmental safety of energy carriers is the second problem. It is generally recognized that the solution of the issues connected with the aggregate of these two problems is of a global character. The scientific research results, which should belong to global (clear) energy, originate from it. First and foremost, they are such scientific investigations, which result in the possibility to use an inexhaustible and environmental friendly energy carrier.
Many experimental data concerning excessive heat production in various engineering processes have been published of late years. The most probable source of this heat is perfect vacuum energy being absorbed by destabilized valence electrons and emitted in the form of the photons.
In
Engineering practice has already proved that additional energy in the form of heat is generated in the ventilation systems and in the water cavitation systems. Deep scientific analysis of this problem shows that physical vacuum is the most probable source of additional energy in the systems of ventilation and water cavitation. Valence electrons of destroyed molecules of water take energy from physical vacuum and release it during repeated fusion of these molecules.
Why is additional energy generated in the air systems of ventilation and in water cavitation systems? Because they are mechanical systems; mechanical destruction of chemical links requires half energy as compared with thermal destruction of these links. This is the main reason why one fails to increase energy performance index of one step of cavitation processes over 200%.
An increase of efficacy of any process by 30 or 50% is a good result; if it is obtained, it is possible to get even better result. What if a water molecule is destroyed not mechanically, but electrodynamically? In this case, it becomes possible to find resonance frequencies of impact on the molecules and to reduce considerably electrical energy expenses for their destruction. Subsequent fusion of destroyed molecules will release prescribed quantity of energy unavoidably. It is a simple idea, and it has already been implemented.
1. The First Brief Theoretical Part
Now, it is possible to analyse serviceability of the resonance hypothesis, according to which a resonance destruction of chemical bonds in the molecules of water and its ions reduces energy consumption for this process considerably, and further fusion of these molecules and ions generates additional heat energy.
The analysis shows that ion ![]() is the main heat generator (Fig. 1). When
temperature is increased, the distance between the proton
is the main heat generator (Fig. 1). When
temperature is increased, the distance between the proton ![]() and the electron
and the electron ![]() as well as between the electron
as well as between the electron ![]() of the hydrogen atom and the electron 1 of the
oxygen atom is increased. As this increase takes place at the expense of the
photons absorbed by the electrons, this process becomes a pulsating one.
Frequency of these pulsations depends on the rate of increase of solution
temperature and is not great in general. Current pulses, which are supplied to
the electrodes, point the ion
of the hydrogen atom and the electron 1 of the
oxygen atom is increased. As this increase takes place at the expense of the
photons absorbed by the electrons, this process becomes a pulsating one.
Frequency of these pulsations depends on the rate of increase of solution
temperature and is not great in general. Current pulses, which are supplied to
the electrodes, point the ion ![]() in such a way that the proton
in such a way that the proton ![]() of the hydrogen atom is pointed to the
cathode, and the electron 2 of the oxygen atom is pointed to the anode. As a
result, the pulses are directed along the ion axis. As it is clear, it is
possible to separate the proton
of the hydrogen atom is pointed to the
cathode, and the electron 2 of the oxygen atom is pointed to the anode. As a
result, the pulses are directed along the ion axis. As it is clear, it is
possible to separate the proton ![]() of the hydrogen atom or the whole atom (the
proton
of the hydrogen atom or the whole atom (the
proton ![]() with the electron
with the electron ![]() ).
As a result, the oxygen atom remains. When only the proton is separated, it
will go to the cathode, will get the electron and will form the hydrogen atom.
If current density on the cathode surface is high, an array of the hydrogen
atoms being formed will generate plasma. It is a very unstable and undesirable
process in this case. What if the hydrogen atom separation is organized not in
the cathode area, but in the area between the electrodes?
).
As a result, the oxygen atom remains. When only the proton is separated, it
will go to the cathode, will get the electron and will form the hydrogen atom.
If current density on the cathode surface is high, an array of the hydrogen
atoms being formed will generate plasma. It is a very unstable and undesirable
process in this case. What if the hydrogen atom separation is organized not in
the cathode area, but in the area between the electrodes?
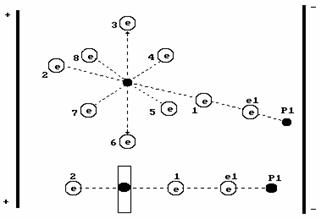
Fig. 1. Diagram of the hydroxyl ion ![]() in the electric field
in the electric field
If such pulses influence the
ion ![]() that the hydrogen atoms separate, after resonance
separation from the electron of the oxygen atom the electron
that the hydrogen atoms separate, after resonance
separation from the electron of the oxygen atom the electron ![]() of the hydrogen atom having lost the bond will
be in a state with a lack of energy (electromagnetic mass), which corresponds
to binding energy. Where will it take energy from? Only from the environment.
What if the environment has no photons, which are necessary for it? There is
only one source physical vacuum. Having absorbed necessary quantity of energy
from physical vacuum (electromagnetic substance), the electron of the hydrogen
atom is able to contact again. It has two opportunities: it can join with the
oxygen atom and form the ion
of the hydrogen atom having lost the bond will
be in a state with a lack of energy (electromagnetic mass), which corresponds
to binding energy. Where will it take energy from? Only from the environment.
What if the environment has no photons, which are necessary for it? There is
only one source physical vacuum. Having absorbed necessary quantity of energy
from physical vacuum (electromagnetic substance), the electron of the hydrogen
atom is able to contact again. It has two opportunities: it can join with the
oxygen atom and form the ion ![]() being destroyed lately or it can join the
second hydrogen atom and form a hydrogen molecule and two oxygen atom form
oxygen molecule. Both these processes are exothermic ones. The fusion processes
of the ions
being destroyed lately or it can join the
second hydrogen atom and form a hydrogen molecule and two oxygen atom form
oxygen molecule. Both these processes are exothermic ones. The fusion processes
of the ions ![]() ,
the molecules of hydrogen and oxygen will be accompanied by emission of the
heat photons.
,
the molecules of hydrogen and oxygen will be accompanied by emission of the
heat photons.
Energy of these photons depends on
energy levels where the valence electrons have been before electrodynamic
cleavage of their bond. At an optimal combination of the process parameters,
they are invisible infrared heat photons, which heat the solution. The
slightest disturbance of process parameter combination optimality disturbs the
process of destruction and
2. The First Experimental Part
The measurements have been carried out using a laboratory model of the most effective cell of the water electric generator of heat (Fig. 2). A diagram of the experimental assembly is shown in Fig. 3.
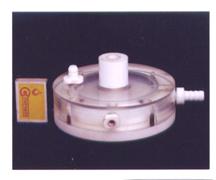
Fig. 2. Cell of the water electric generator of heat
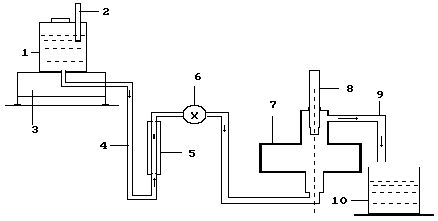
Fig. 3. Diagram of the experimental assembly: 1 a tank for the solution; 2 thermometer; 3 electronic scales; 4 solution feed duct; 5 rotameter; 6 solution feed regulator; 7 cell of the water electric generator of heat; 8 thermometer; 9 heated solution drain; 10 intake tank
Voltage and current at the input of the cell of the water electric generator of heat were measured with the help of two sets of the devices: a voltmeter of 0.2 accuracy class (GOST 8711-78), an ammeter of 0.2 accuracy class (GOST 8711-60) and ACK-20222 electronic oscillograph.
In order to reduce heat losses that were not taken into consideration in the experiment, a solution temperature difference before its heating in the cell and after heating was maintained as not very high: Dt=2 C. Connection diagram of metering equipment is given in Fig. 4.
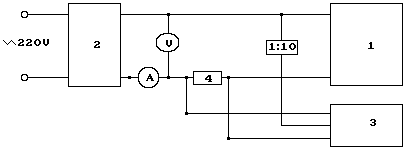
Fig. 4. Connection diagram of metering equipment:
1 the cell of the water electric generator of heat; 2 pulse generator;
-2022 oscillograph; 5 - 33 resistance bridge
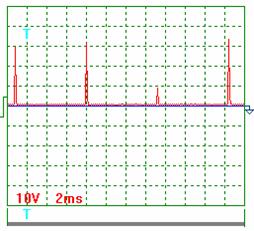
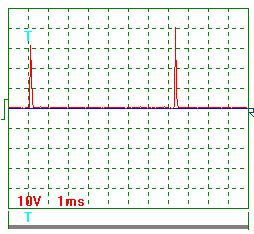
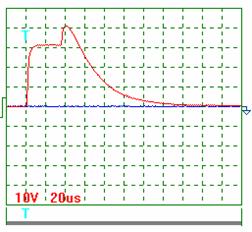
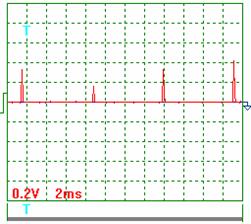
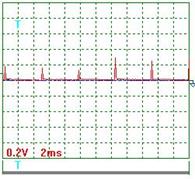
The oscillograms of voltage (Fig. 5, 6 and 7) and current (Fig. 8) as well as the method of their processing are given below.
|
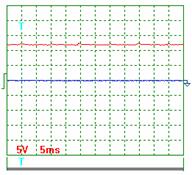
Fig. 5. Tension |
Fig. 6. Tension |
|
Fig. 7. Tension |
Fig. 8. Current |
Pulse scale is 10. Average voltage amplitude (Fig. 5, 6 and 7):
Uаср = (29+31+8+33+ )x10/7 = 304.3 V.
Current magnitude was determined as voltage drop on the resistor with resistance of 0.1 Ohm. Taking this into account, average current amplitude is (Fig. 8):
Iаср = (1.7+0.8+1.7+2.1) x 0.2x10/(4x0.1) = 31.5 А.
Pulse repetition period Т = 7.25 ms.
Pulse duration was determined according to the oscillogram in Fig. 7. The pulse form was reduced to a triangular form in such a way that an area of a triangle was equal approximately to the area described by a complex form of the pulse curve.
Pulse duration (Fig. 7) tp = 0.14 ms.
Pulse frequency f = 1000/7.25 = 137.9 Hz.
Relative pulse duration S = 7.25/0.14 = 51.78.
Pulse ratio Z = 0.5/51.78 = 0.01.
Average value of pulse voltage Ucр = 0.01 x 304.3 = 3.04 V.
Average value of current in pulses Iср = 0.01 x 31.5 = 0.32 A.
The results of the experiment are given in Table 1.
Table 1
|
Indices |
Average |
|||
|
1 - mass
of the solution, which has passed through the sell | ||||
|
2 -
temperature of solution at the input of the sell | ||||
|
3 -
temperature of the solution at the output of the sell | ||||
|
4 -
temperature difference of the solution | ||||
|
5 -
durability of the experiment | ||||
|
6 -
reading of voltmeter | ||||
|
6 -
readings of oscillograph | ||||
|
7 -
reading of ammeter | ||||
|
7 -
readings of oscillograph | ||||
|
8 -
electric power consumption according to the readings of voltmeter and
ammeter, | ||||
|
8 -
electric power consumption according to the readings of oscillograph, | ||||
|
9 heated
solution energy | ||||
|
10 - COP of the sell according to the readings of voltmeter and ammeter, | ||||
|
10 - COP of the sell according to the readings of readings of oscillograph, |
|
It is known that a determination of the values of voltage and current in electric circuits with complicated electric pulses (Figs 5, 6, 7 and 8) with the help of the oscillograms is considered to be the most reliable.
3. The Second Brief Theoretical Part
Low voltage process of
water electrolysis is known from Faradays times. It is widely used in modern
industry. Voltage of 1.6-2.3 volts is operation voltage between the anode and
the cathode of the electrolyzer; current strength is tens and hundreds of
amperes. In accordance with Faradays law, energy consumption for production of
one cubic meter of hydrogen is nearly ![]() in this case. When one cubic meter of hydrogen
is burnt, 3.55 kWh of energy is released.
in this case. When one cubic meter of hydrogen
is burnt, 3.55 kWh of energy is released.
An interest to hydrogen energetic is being increased of late years. It is explained by the fact that hydrogen is an inexhaustible and environmental-friendly energy carrier. But the implementation of these properties is slowed down by large energy consumption for its production from water. Many laboratories in the world are busy solving a problem of a reduction of energy consumption for hydrogen production from water, but there are no significant results. In the meantime, a money-saving process of decomposition of water molecules into hydrogen and oxygen exists in the Nature. This process takes place during photosynthesis. Hydrogen atoms are separated from water molecules and are used as connecting links while forming organic molecules, and oxygen is released into the air.
It is known that carbon dioxide CO2 is absorbed during photosynthesis. It is considered that carbon C of the molecule CO2 is used for plant cell construction, and oxygen O2 is released. Now we have every reason to doubt at it and to suppose that the molecule CO2 is used totally for plant cell construction. Water molecules release oxygen; the hydrogen atoms of water molecules are used as connecting links of the molecules, from which the plant cells are constructed.
A question emerges: is it possible to model an electrolytic process of water decomposition into hydrogen and oxygen, which takes place during photosynthesis?
The analysis of the water molecule structure (Fig. 9) worked out by us shows the possibility of water electrolysis at minimal current and even without it. The protons of the hydrogen atoms in water molecules can be combined with each other and can form clusters. As a result, an orthohydrogen molecule is formed (Fig. 10). A question emerges: is it possible to separate this molecule from such cluster?
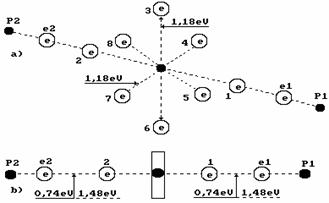
Fig. 9. Water molecule diagram
1,2,3,4,5,6,7,8 are numbers of the electrons of the oxygen atom; P1, P2 are the hydrogen atom nuclei (the protons); e1 and e2 are the electron numbers of the hydrogen atoms
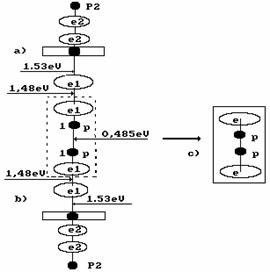
Fig. 10. Formation diagram of the second model of orthohydrogen
a) and b) water molecule diagrams; c) orthohydrogen
In Fig. 11, the anode (+) is shown leftward and the cathode (-) is
shown rightward. The proton P of the
hydrogen atom in water molecule![]() is oriented to the cathode (-); another proton of this molecule is connected
with the proton of the ion
is oriented to the cathode (-); another proton of this molecule is connected
with the proton of the ion ![]() (leftward). As a result, a cluster chain is formed; rightward, the
water molecule
(leftward). As a result, a cluster chain is formed; rightward, the
water molecule ![]() is situated; leftward, the ion
is situated; leftward, the ion ![]() is situated (Fig. 11, a); the orthohydrogen
molecule
is situated (Fig. 11, a); the orthohydrogen
molecule ![]() is in the center (Fig. 11, a, b).
is in the center (Fig. 11, a, b).
Thus, the complex cluster chains with strict orientation between the anode and the cathode are formed in the electrolytic solution under the influence of the electrostatic field.
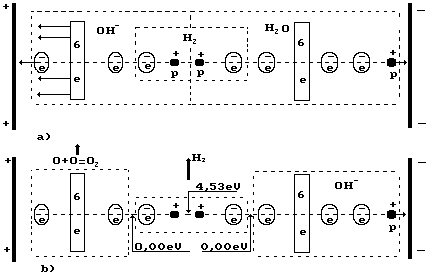
Fig. 11. Diagram of low current electrolysis process
Let us pay attention to
the fact that the axis electron of the oxygen atom (Fig. 1 and 11 left) and its six ring electrons of the ion ![]() are attracted to the anode simultaneously.
Electrostatic forces attracting six ring electrons to the anode deform the
electrostatic field in such a way that the axis electron comes to the nucleus
of the oxygen atom, and six ring electrons withdraw from the atomic nucleus. In
this case, binding energies between the protons and the electrons in a hydrogen
molecule being formed are distributed in such a way that binding energy between
the hydrogen atoms in its molecule are increased up to 4.53 eV. Between the
electrons of the oxygen atom and the ion, they become equal to zero, and the
hydrogen molecule is released from the cluster chain. Two oxygen atoms form a
molecule of this gas, and it is released as well. Certainly, it is a simplified
diagram. If the process is more complicated, it is possible to form the
molecules of hydrogen peroxide prior the oxygen molecule formation. But well
not analyze this process here.
are attracted to the anode simultaneously.
Electrostatic forces attracting six ring electrons to the anode deform the
electrostatic field in such a way that the axis electron comes to the nucleus
of the oxygen atom, and six ring electrons withdraw from the atomic nucleus. In
this case, binding energies between the protons and the electrons in a hydrogen
molecule being formed are distributed in such a way that binding energy between
the hydrogen atoms in its molecule are increased up to 4.53 eV. Between the
electrons of the oxygen atom and the ion, they become equal to zero, and the
hydrogen molecule is released from the cluster chain. Two oxygen atoms form a
molecule of this gas, and it is released as well. Certainly, it is a simplified
diagram. If the process is more complicated, it is possible to form the
molecules of hydrogen peroxide prior the oxygen molecule formation. But well
not analyze this process here.
4. The Second Experimental Part
A search of a reply to the question: is it possible to model an electrolytic process of water decomposition into hydrogen and oxygen, which takes place during photosynthesis? The answer on this question has resulted in a simple structure of a cell (Fig. 12), in which the process takes place by voltage of 1.5-2.0 V between the anode and the cathode and amperage of 0.02 amperes, thats why it has been called low current one.
First of all, we should note that the anode and the cathode are made of one and the same material: steel. It excludes the possibility of formation of a galvanic cell. Nevertheless, at the cell electrodes a potential difference of nearly 0.1 V takes place in complete default of electrolytic solution in it. When the solution is charged, the potential difference is increased. The positive sign of the charge appears on the upper electrode always, and the negative sign appears on the lower one. If a direct current source generates pulses, gas output is increased.
Let us note a very important thing. If a gap between the electrodes of the low voltage electrolyzer is commensurable with the gas bubble size; so the gas bubbles go upwards and promote mechanical destruction of the bonds between the atoms in the molecules. As we have already shown, it consumes less energy that it is spent for thermal destruction of these bonds.
Gas generation process is manifested by release of the bubbles being formed. The bubbles go on being released after the electrolyzer is disconnected from the supply line (Table 2). When the electrolyzer is de-energized, gas release intensity is reduced, but it is not stopped during many hours. It is proved by the fact that electrolysis takes place at the expense of potential difference on the electrodes.
After electrolyzer de-energizing, gas release during a long period of time proves the fact that the molecules of oxygen and hydrogen are formed without the electrons emitted by the cathode, i.e. at the expense of the electrons of the water molecule itself.
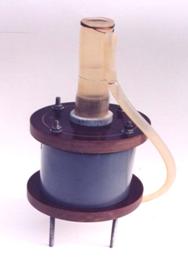
Fig. 12. Model of a low current cell of the electrolyzer (at the stage of patenting)
As a laboratory model of the low current electrolyzer cell generates small quantity of gases, a solution mass change definition method during the experiment and further calculation of released hydrogen and oxygen is the most reliable method of definition of their quantity.
It is known that a gram atom is equal to atomic mass of substance; a gram molecule is equal to molecular mass of substance. For example, the gram molecule of hydrogen in the water molecule is equal to two grams; the gram-atom of the oxygen atom is 16 grams. The gram molecule of water is equal to 18 grams. Hydrogen mass in a water molecule is 2x100/18=11.11%; oxygen mass is 16x100/18=88.89%; this ratio of hydrogen and oxygen is in one liter of water. It means that 111.11 grams of hydrogen and 888.89 grams of oxygen are in 1000 grams of water.
One liter of hydrogen weighs 0.09 g; one liter of oxygen weighs 1.47 g. It means that it is possible to produce 111.11/0.09=1234.44 liters of hydrogen and 888.89/1.47=604.69 liters of oxygen from one liter of water. It appears from this that one gram of water contains 1.23 liters of hydrogen. Energy consumption for production of 1000 liters of hydrogen is 4 kWh and for one liter 4 Wh. As it is possible to produce 1.234 liters of hydrogen from one gram of water, 1.234x4=4.94 Wh is spent for hydrogen production from one gram of water now.
Instruments and equipment used during the experiment
Special experimental low current electrolyzer (Fig. 12); voltmeter of the highest accuracy class (accuracy class of 0.2 GOST 9711-78); ammeter of the highest accuracy class (accuracy class of 0.2 GOST 9711-78); electronic scale with scale division value of 0.1 and 0.01 g; stop watch with scale division value of 0.1 s; oscillograph
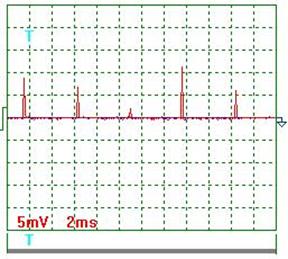
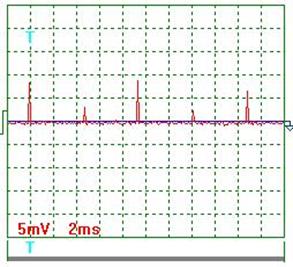
In Figs 13-18, the oscillograms of voltage and current across the input into the electrolyzer are shown.
|
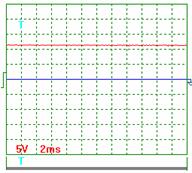
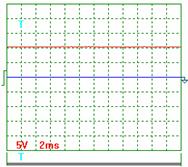
Fig. 13. Voltage |
Fig. 14. Voltage |
Fig. 15. Voltage |
In Fig. 13, the oscillogram of voltage with pulse frequency of nearly 200 Hz is shown. The record scale is 1:1. The pulses are invisible, because their amplitude is negligibly small. The measurements show that voltage of nearly 13.5 V was registered on the oscillogram. The voltmeter showed 11.4 V at that time.
Fig. 14 shows the oscillogram of voltage across the input into the electrolyzer in 1 second after it is disconnected from the mains. Fig. 15 shows the oscillogram of voltage across the input into the electrolyzer in 3 seconds after it is disconnected from the mains. The oscillograms in Figs 14 and 15 show that when the electrolyzer is disconnected from the mains, the process of its discharge takes place. It should be noted that voltage is reduced, but it does not become equal to zero. It means that the electrolyzer is not only a capacitor, but it is an energy source as well.
As it is clear, at the initial time after the electrolyzer is disconnected from the mains (Fig. 14 and 15), it preserves the potential, which is close to the potential of the mains and which has been formed during electrolyzer chargings when it is connected to the mains and is adjusted to a specified operation mode. It should be noted that current during charging exceeded its operation value of 0.02 A greatly. In 3 seconds after de-energizing (Fig. 15), potential across the input into the electrolyzer is reduced approximately from 13.5 V to 10 V.
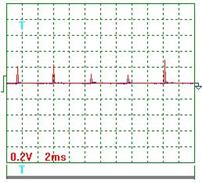
In the oscillogram (Fig. 13), the pulses are not seen, because their amplitude is negligibly small. If the scale is increased, the pulses are as follows (Figs 16 and 17).
Voltage oscillogram processing results (Figs 16 and 17). Taking into consideration the scale factor, which is equal to 10, we'll find a mean value of voltage pulse amplitude
![]() =[(0.20+0.24+0.12+0.10+0.30+0.18+0.16+0.12+0.30+
0.24+0.30)/11] x10=2,05 V .
=[(0.20+0.24+0.12+0.10+0.30+0.18+0.16+0.12+0.30+
0.24+0.30)/11] x10=2,05 V .
Pulse period 2)/10=4.8 ms.
Pulse duration ![]() 1.45)/10=0.29 ms.
1.45)/10=0.29 ms.
Pulse frequency ![]() =(1/0.001x4.8)=208.3 Hz.
=(1/0.001x4.8)=208.3 Hz.
Pulse period-to-pulse duration ratio ![]()
Duty factor ![]()
Equivalent mean component of voltage pulses calculated according to the
oscillograph readings ![]() 0.0302=0.062 V. At that time, the voltmeter
readings were 11.4 V.
0.0302=0.062 V. At that time, the voltmeter
readings were 11.4 V.
|
Fig Voltage |
Fig Voltage |
Thus, there is every reason to believe that the low current electrolyzer has the properties of a capacitor and an electric source at the same time. It has been charged at the very beginning; then it is discharged gradually under the influence of the electrolytic processes, which take place in it. Quantity of electric power generated by it is insufficient for the electrolysis process support, and it is discharged gradually. If it is charged with the help of voltage pulses, which compensate for power consumption, the charge of the electrolyzer as the capacitor will remain constant, and the electrolysis process will remain stable.
A value of potential being necessary for the electrolyzer discharge compensation is registered on the oscillograms (Figs 16 and 17). This value should be used when calculating power expenses for hydrogen production from water during its low current electrolysis.
Thus, according to the readings of the voltmeter and the ammeter, capacity of power source of the laboratory model of the low current electrolyzer is P=IU=0.0211.4=0.228 W. But the analysis of the oscillograms shows that this power is necessary only to put the electrolyzer in operation. After starting, when it is charged, capacity for its charging is P=IU=0.020.062=0.0012 W, i.e. 190fold less (Table 2).
Availability of a constant component of electric potential across the input into the electrolyzer shows that in order to calculate power consumption for the electrolysis process it is necessary to use not the voltmeter readings, but the oscillograph readings, which register the electrolyzer charge potential originating from the oscillograms given in Figs 16 and 17.
|
Fig Current |
Fig Current |
In Figs 18 and 19, the oscillograms of current are shown when the electrolyzer power supply source generates pulses with frequency of nearly 200 Hz.
Current oscillogram processing results (Figs 18 and 19). Taking into consideration the scale factor, which is equal to 10, and resistance of 0.1 Ohm resistor we'll find a mean value of current pulse amplitude
![]()
Mean current in the
electrolyzer supply circuit is ![]() . The ammeter readings are 0.02
. The ammeter readings are 0.02
Table 2.
|
Indices |
Amount |
|
1 period of service of the electrolyzer connected to the line, in six cycles t, min |
x |
|
voltmeter readings V volts | |
|
2 oscillograph readings V, volts; | |
|
ammeter readings I ampere |
0.02 |
|
3 oscillograph readings, I, ampere; | |
|
4 energy consumption according to the voltmeter and ammeter (P=VxIxτ/60), Wh; | |
|
4 energy consumption according to oscillograph readings (P=VxIx τ/60) Wh; | |
|
5 period of service of the electrolyzer disconnected from the line, in six cycles, min |
x |
|
6 solution mass change m, grams | |
|
7 evaporating water mass m, grams | |
|
8 mass of water passed into gases, m=m-m, grams | |
|
9 energy consumption per gram of water passed into gases according to the readings of the voltmeter and ammeter E=P/m, Wh/gram of water | |
|
9 energy consumption per gram of water passed into gases according to oscillograph readings E=P/m, Wh/gram of water | |
|
10 existing energy consumption per gram of water passing into gases E, Wh/gram of water | |
|
11 reduction of energy consumption for hydrogen production from water according to the readings of voltmeter and ammeter K=E/P, fold | |
|
11 reduction of energy consumption for hydrogen production from water according to the oscillograph readings K=E/P, fold | |
|
12- released hydrogen quantity =0.54x1.23x0.09=0.06, gram | |
|
13 energy content of produced hydrogen (W=0.06 142/3.6) =2.36, Wh | |
|
14 energy effectiveness of water electrolysis process according to the readings of the voltmeter and the ammeter (W 100/P), % | |
|
14 - energy effectiveness of water electrolysis process according to the oscillograph readings (W 100/P), % |
Thus, the voltmeter shows a capacitor charge voltage value, and the oscillograph shows a value of its recharge, which characterizes the energy consumed by the cell from the line. It appears from this that in order to calculate energy consumed by the low current electrolyzer cell from the line it is necessary to use voltage, which is registered not by the voltmeter, but by the oscillograph. As a result, energy consumption for hydrogen production from water in case of low current electrolysis are reduced not 12fold, but almost 2000fold.
The correspondence of the water electrolysis process during low current electrolysis to its electrolysis process taking place during photosynthesis is confirmed by intensive production of gas bubbles within several hours after the electrolyzer is disconnected from the mains.
CONCLUSION
The method of conversion of electric energy into thermal energy with energy efficiency index of more than 100 folds has been found.
Thus, the convincing theoretical and experimental proofs of existence of a method, which reduces energy consumption for hydrogen production from water 1000 folds and more, have been got. Such reduction of energy consumption for hydrogen production from water affords ground for an assumption that low-current water electrolysis is similar to its electrolysis, which takes place during photosynthesis.
The way of a transfer to economical and environmental friendly power engineering is opened. But it will not be an easy one. There will be a lot of work concerning optimization of the parameters of the global energy generators.
Acknowledgement. The author thanks A.I. Tlishev, candidate of technical sciences, for production of the low-current hydrogen generators and the water electric generators of heat and his participation in their tests.
REFERENCES
1. Kanarev Ph.M. The Foundations of Physchemistry of Micro World. The Third Edition. 2003. (In Russian). https://Kanarev.innoplaza.net
2. Kanarev Ph.M. The Foundations of Physchemistry of Micro World. The Fourth Edition. 2004 (in English). https://Kanarev.innoplaza.net
Ph.M. Kanarev. Prediction of Evolution of Fundamental Physical Investigation. 2004. 160 pages. (In Russian). https://Kanarev.innoplaza.net Book 2.
4. Kanarev Ph.M. Procedure Analysis of Measurement of Electric Power Consumed by the Water Electric Generator of Heat. 2004. (In English) https://Kanarev.innoplaza.net
|
Politica de confidentialitate | Termeni si conditii de utilizare |

Vizualizari: 1654
Importanta: ![]()
Termeni si conditii de utilizare | Contact
© SCRIGROUP 2026 . All rights reserved