| CATEGORII DOCUMENTE |
| Bulgara | Ceha slovaca | Croata | Engleza | Estona | Finlandeza | Franceza |
| Germana | Italiana | Letona | Lituaniana | Maghiara | Olandeza | Poloneza |
| Sarba | Slovena | Spaniola | Suedeza | Turca | Ucraineana |
Biopotentials Biopotential Amplifiers and ECG Overall Design
The body produces several bioelectric signals that can be recorded with surface electrodes:
EKG or ECG: electrocardiogram- from muscles and nerves of the heart
EMG: electromyogram- from muscles (usually skeletal)
EEG: electroencephalogram- from neurons in the brain
ENG- electroneurogram- from nerves or neurons
ERG- electroretinogram- from neurons in the retina.
A recording is generally a summation of potentials from excitable cells (neurons, muscle cells, glands). Below is a recording from a single neuron, along with how the recording was obtained.
The refractory periods refer to times when the neuron cannot generate an other action potential (absolute) or when it is much more difficult to elicit a potential (relative). This limits the frequency of discharge.
The action potential travels along the cell membrane. A solenoidal current flow where the membrane is depolarized. This current reduces the membrane potential to the left. When the membrane potential is reduced to a voltage below the threshold voltage, depolarization occurs there. To the right, the membrane is in the refractory period, so it cannot be repolarized. This keeps the depolarization wave travelling to the left.
The above description is true for a single neuron. However, think of that neuron being enclosed in a large, fluid, conducting media (the body). The electrical signal will be attenuated by the media and mixed with the signal from its neighbors. What one measures on the surface of the skin is the superposition of the electrical signal from many excitable cells. Even when a well-known simple response from individual nerves can be measured, it is often a superposition of several types of neurons, each which have a different shaped action potential (muscle cells also have a different looking action potential). The below example is Figure 4.5 for an example from the sciatic nerve.
The Electrocardiograph
The ECG is an EMG of the heart. The heart is composed of many tissues
SA, AV nodes
Atria
Purkinje fibers
Ventricals
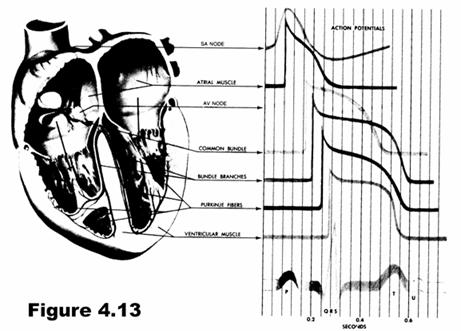
They are all electrically excitable with different characteristics. For instance, the ventricular cells are long cells somewhat parallel to each other. The myofibrils from lengthwise and provide contraction. So the ECG is a summation of the electrical potentials from these various heart tissues. Since different parts of the heart are electrically active at different times, various portions of the ECG waveform can be mapped to different portions of the heart.
The first portion of the heart to be exicited is the SA node. From there the potential travels and causes atrial contraction, then it travels down the bundle of His to to excite ventricular tissue.
In the ECG, the heart is viewed as an electrical dipole (dipoles are represented by a line segment with a positive charge on one end and a negative charge on the other). The orientation and strength of the dipole changes in time, and the dipole is fixed in position at the electrical center of the heart. The dipole moment can be represented by the vector M. With increasing distance from the center of the dipole, the measured signal strength decreases.

BA take a weak electric signal of biological origin and increase its amplitude so that it can be further processed, recorded, or displayed. They must have
high input impedence
protection to the subject
have a proper frequency response
be calibrated.
The ECG has a magnitude of about 5 mV, so a reasonably high gain, high quality biopotential amplifier is needed.
Where on the surface of the body should the ECG be measured? If M can have any direction in space, then at least three measurements are required to determine it. In practice, the potential between many different electrodes (the leads) is measured. The below image shows perhaps the three most common. These make up the frontal plane ECG. The leads are redundant. Given the reading from two leads, the third, as well as the cardiac vector M in the frontal plane, can be determined.
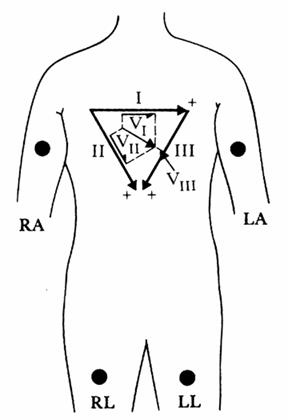
Three additional frontal-plane leads (Augmented leads AVR, AVL, and AVF) can taken by referencing the potential from RA, LA, or LL respectively to the average of the potential from the other 2 electrodes.
Precordial leads (V1 V6) can be used to determine the value of M in the transverse plane. These electrodes are referenced to the average of the three frontal-plane electrodes.
Below is a block diagram of an ECG amplifier to measure lead 1, and a short description of the blocks. There is a more complete block diagram in Webster, but these are the most important components.
The instrumentation amplifier must have a high common mode rejection ratio (CMRR) to be able to eliminate the potential that exists between both electrodes and ground and only amplify the differential potential that exists between the two electrodes. A driven right leg circuit (see Webster as well as many specification sheets for instrumentation amplifiers) will help reduce the common mode and is safer than connecting the right leg to ground. The gain of this stage is usually around 100.
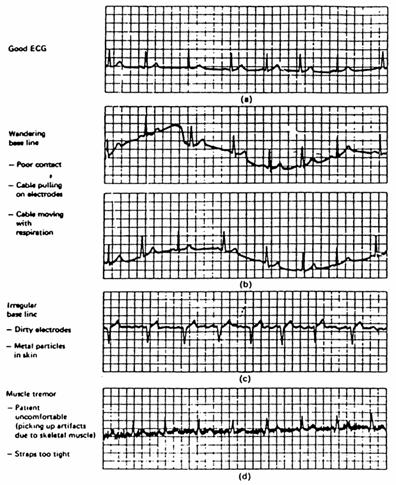
The high pass filter is necessary to remove the wandering baseline that is so common in ECG circuits (usually due to electrodes). Otherwise this baseline drift might saturate the other amplifiers. The cutoff frequency should be around 0.01 Hz, and a simple RC circuit works well although you may wish to try others.
The isolation amplifier must be placed somewhere in the chain. This is a good spot. Everything on the patient side must be powered with batteries; everything on the computer side can be powered with the power supplies on the bench. The ICs you are using should be fine powered with two 9 V batteries (connect the positive terminal of one to the negative terminal of the other and call this ground. Then you have 9V on the two remining terminals). You may wish to have a gain of 10.
Right before the A/D converter should be a low pass filter. This will eliminate white noise and perhaps other noise (power line harmonics, 20 kHz from the lights,?) Try cutoff frequencies above 150 Hz. Gain is 1 or may be adjusted as necessary to fill the dynamic range of the A/D converter.
Not shown is a 60 Hz notch filter. You will need one of these. It may be analog or digital (analog if amplitude really large- place after Iso Amp).
Problems you may have with your ECG
Frequency distortion. If you use two high of a HPF cutoff frequency, your baseline will not appear flat. If the cutoff frequency of your LPF is too low, the peak of the QRS will appear rounded and lower amplitude.
Saturation. Two high of amplification will saturate the detectors. This is usually pretty obvious. Dont put all your gain in the instrumentation amp or the DC component will cause saturation. Reduce differential DC component with good electrode-skin contact and common mode component with good design and instrumentation amp.
Ground loop. If the subject is hooked to two diffent ground wires from different instruments, and the grounds of these instruments are at different potentials, a ground loop will be formed. This is dangerous and can cause an additional common mode. Dont hook yourself to more than one ground!
Open (broken or disconnected) lead wires. The open wire becomes an antenna, picking up potentials from electric fields in the room.
Transients. A large transient potential can saturate the amplifiers, building up charge on the capacitors in the amplifier, which takes a period of time to recover. You may see this if you move suddenly. In the hospital, it occurs during defibrillation (bad if you want to see if the heart has started beating normally again). Solution: limit the maximum input to the amplifiers.
Electric field pickup. Electric fields caused by power lines in the room will capacitively couple into the body and the leads. Current induced in the leads flows through the body to ground. If the electrode impedences differ, a differential voltage will be created (read more on pp 248-253). Solution: shield wires and reduce skin-electrode impedence. Also a driven right leg will reduce this effect.
Magnetic field pickup. The change in magnetic field passing through a loop created by the subject, lead wires, and ECG will induce a current in the loop. Solution: twist wires together.
EMG interference. The electrical activities of your skeletal muscles are on the same order of magnitude as the ECG. They will be picked up in the electrodes when the subject moves. However, their frequency composition is mostly higher, so much can be eliminated with the LPF.
What needs to be in your ECG project and notebook:
Introductory section with
Objectives
Equipment used
References
Procedure of designing ECG amplifier. Include blind alleys and wrong turns!
Final overall design of the amplifier system. It must include the pieces described above (electrodes, instrumentation amp, HPF, isolation amp, LPF, A/D board, LabVIEW interface).
LabVIEW interface: may be modified from one of the examples (be sure to change the name and save). You must modify the interface to remove all the unnecessary junk (buffer size, etc.).
Complete diagrams of all stages, with resistor values and IC manufacturers and type. Include calculations to come up with these resistor values. Include actual nominal (and real) resistor values used.
Assessment of circuit performance. For each stage, include measured gain or measured frequency response. For overall system, include a plot of gain vs. frequency. Identify any artifacts in your signal.
Printout of front panels under all the conditions you tested your circuit.
This much will get you a C. If you want an A, you must add more. Below are some suggestions. You are welcome to come up with you own- you may want to check with me and make sure I agree they are feasible/worthwhile.
Other stuff you can do:
assess the common mode rejection ratio of your circuit.
make an R wave detector to determine heart rate.
assess your results- evaluate sensitivity and specificity with EMG present, and resolution using students t-test to determine statistical significance of resolution results. See if these change over a range of heartrates.
evaluate the frequency response of the measured signal with and without your filters and EMG.
make an super GUI
make a driven right leg circuit
build your own instrumentation amp using op amps. assess CMRR
try optical isolation (see me before hooking yourself up)
compress and save ECG
|
Politica de confidentialitate | Termeni si conditii de utilizare |

Vizualizari: 2519
Importanta: ![]()
Termeni si conditii de utilizare | Contact
© SCRIGROUP 2024 . All rights reserved