| CATEGORII DOCUMENTE |
| Bulgara | Ceha slovaca | Croata | Engleza | Estona | Finlandeza | Franceza |
| Germana | Italiana | Letona | Lituaniana | Maghiara | Olandeza | Poloneza |
| Sarba | Slovena | Spaniola | Suedeza | Turca | Ucraineana |
Welcome to TeeChart version 3


Contents
Introduction
TOC o '1-3' Introduction GOTOBUTTON _Toc378759117 PAGEREF _Toc378759117 7
Licensing issues GOTOBUTTON _Toc378759118 PAGEREF _Toc378759118 7
About TeeChart GOTOBUTTON _Toc378759119 PAGEREF _Toc378759119 7
TeeChart version 3 GOTOBUTTON _Toc378759120 PAGEREF _Toc378759120 8
TeeChart Pro GOTOBUTTON _Toc378759121 PAGEREF _Toc378759121 8
Getting Started
Installing TeeChart GOTOBUTTON _Toc378759122 PAGEREF _Toc378759122 11
Installation steps GOTOBUTTON _Toc378759123 PAGEREF _Toc378759123 11
TeeChart version 3 runtime contents GOTOBUTTON _Toc378759124 PAGEREF _Toc378759124 11
Packages GOTOBUTTON _Toc378759125 PAGEREF _Toc378759125 11
TeeChart GOTOBUTTON _Toc378759126 PAGEREF _Toc378759126 11
Online help GOTOBUTTON _Toc378759127 PAGEREF _Toc378759127 12
TeeChart & QuickReport v2.0 GOTOBUTTON _Toc378759129 PAGEREF _Toc378759129 12
TeeChart Manual (MS Word format) GOTOBUTTON _Toc378759130 PAGEREF _Toc378759130 12
Using TeeChart on-line help GOTOBUTTON _Toc378759131 PAGEREF _Toc378759131 13
Using TeeChart on-line help GOTOBUTTON _Toc378759132 PAGEREF _Toc378759132 13
Selecting a TeeChart component GOTOBUTTON _Toc378759133 PAGEREF _Toc378759133 13
Selecting a TeeChart property, method or event GOTOBUTTON _Toc378759134 PAGEREF _Toc378759134 13
TeeChart Wizard GOTOBUTTON _Toc378759135 PAGEREF _Toc378759135 14
Using the TeeChart Wizard GOTOBUTTON _Toc378759136 PAGEREF _Toc378759136 14
A TeeChart quick start guide GOTOBUTTON _Toc378759137 PAGEREF _Toc378759137 15
Which TeeChart component should I use? GOTOBUTTON _Toc378759138 PAGEREF _Toc378759138 15
Creating a new chart with TChart or TDBChart component GOTOBUTTON _Toc378759139 PAGEREF _Toc378759139 15
Create a new Form. GOTOBUTTON _Toc378759140 PAGEREF _Toc378759140 15
Edit the new chart GOTOBUTTON _Toc378759141 PAGEREF _Toc378759141 16
The Chart editor GOTOBUTTON _Toc378759142 PAGEREF _Toc378759142 17
Add a data series GOTOBUTTON _Toc378759143 PAGEREF _Toc378759143 17
Edit the series GOTOBUTTON _Toc378759144 PAGEREF _Toc378759144 18
Configuring data series in a TChart GOTOBUTTON _Toc378759145 PAGEREF _Toc378759145 18
Example Pie-series GOTOBUTTON _Toc378759146 PAGEREF _Toc378759146 19
Editing the series GOTOBUTTON _Toc378759147 PAGEREF _Toc378759147 19
Configuring data series in a TDBChart GOTOBUTTON _Toc378759148 PAGEREF _Toc378759148 20
Using the TeeChart demos GOTOBUTTON _Toc378759149 PAGEREF _Toc378759149 24
Charting Reference
The Chart components GOTOBUTTON _Toc378759150 PAGEREF _Toc378759150 28
Two Chart components GOTOBUTTON _Toc378759151 PAGEREF _Toc378759151 28
Chart subcomponents GOTOBUTTON _Toc378759152 PAGEREF _Toc378759152 28
The Chart as backdrop to your series GOTOBUTTON _Toc378759153 PAGEREF _Toc378759153 28
Associating a series with a Chart GOTOBUTTON _Toc378759154 PAGEREF _Toc378759154 28
Often used parameters GOTOBUTTON _Toc378759155 PAGEREF _Toc378759155 29
TChart component GOTOBUTTON _Toc378759156 PAGEREF _Toc378759156 32
TDBChart component GOTOBUTTON _Toc378759157 PAGEREF _Toc378759157 32
Creating the Dataset GOTOBUTTON _Toc378759158 PAGEREF _Toc378759158 32
Connecting your series to a database Dataset GOTOBUTTON _Toc378759159 PAGEREF _Toc378759159 32
Coding your datasource GOTOBUTTON _Toc378759160 PAGEREF _Toc378759160 33
Series types GOTOBUTTON _Toc378759161 PAGEREF _Toc378759161 35
TChartSeries GOTOBUTTON _Toc378759162 PAGEREF _Toc378759162 35
Line series GOTOBUTTON _Toc378759163 PAGEREF _Toc378759163 35
Line GOTOBUTTON _Toc378759164 PAGEREF _Toc378759164 35
Fast line GOTOBUTTON _Toc378759165 PAGEREF _Toc378759165 35
Bar GOTOBUTTON _Toc378759166 PAGEREF _Toc378759166 35
Example bar series configuration GOTOBUTTON _Toc378759167 PAGEREF _Toc378759167 36
Bar series display GOTOBUTTON _Toc378759168 PAGEREF _Toc378759168 37
Horizontal bar GOTOBUTTON _Toc378759169 PAGEREF _Toc378759169 39
Area GOTOBUTTON _Toc378759170 PAGEREF _Toc378759170 39
Point GOTOBUTTON _Toc378759171 PAGEREF _Toc378759171 40
Pie GOTOBUTTON _Toc378759172 PAGEREF _Toc378759172 40
Arrow GOTOBUTTON _Toc378759173 PAGEREF _Toc378759173 41
Bubble GOTOBUTTON _Toc378759174 PAGEREF _Toc378759174 41
Gantt GOTOBUTTON _Toc378759175 PAGEREF _Toc378759175 41
How to add Gantt bars manually GOTOBUTTON _Toc378759176 PAGEREF _Toc378759176 42
Shape GOTOBUTTON _Toc378759177 PAGEREF _Toc378759177 43
Combining series GOTOBUTTON _Toc378759178 PAGEREF _Toc378759178 44
Example series combination GOTOBUTTON _Toc378759179 PAGEREF _Toc378759179 44
Extended series GOTOBUTTON _Toc378759180 PAGEREF _Toc378759180 46
Candle GOTOBUTTON _Toc378759181 PAGEREF _Toc378759181 46
Volume GOTOBUTTON _Toc378759182 PAGEREF _Toc378759182 47
Errorbar GOTOBUTTON _Toc378759183 PAGEREF _Toc378759183 47
Surface GOTOBUTTON _Toc378759184 PAGEREF _Toc378759184 48
Polar GOTOBUTTON _Toc378759185 PAGEREF _Toc378759185 48
Custom series GOTOBUTTON _Toc378759186 PAGEREF _Toc378759186 48
QuickReport Integration GOTOBUTTON _Toc378759187 PAGEREF _Toc378759187 49
Adding a Chart to QuickReport GOTOBUTTON _Toc378759188 PAGEREF _Toc378759188 49
Notes on working with QuickReport GOTOBUTTON _Toc378759189 PAGEREF _Toc378759189 49
Functions GOTOBUTTON _Toc378759190 PAGEREF _Toc378759190 50
Standard functions GOTOBUTTON _Toc378759191 PAGEREF _Toc378759191 50
Add GOTOBUTTON _Toc378759192 PAGEREF _Toc378759192 50
Subtract GOTOBUTTON _Toc378759193 PAGEREF _Toc378759193 51
Multiply GOTOBUTTON _Toc378759194 PAGEREF _Toc378759194 52
Divide GOTOBUTTON _Toc378759195 PAGEREF _Toc378759195 52
High GOTOBUTTON _Toc378759196 PAGEREF _Toc378759196 53
Low GOTOBUTTON _Toc378759197 PAGEREF _Toc378759197 54
Average GOTOBUTTON _Toc378759198 PAGEREF _Toc378759198 54
Extended Functions GOTOBUTTON _Toc378759199 PAGEREF _Toc378759199 55
Moving average GOTOBUTTON _Toc378759200 PAGEREF _Toc378759200 55
R.S.I. GOTOBUTTON _Toc378759201 PAGEREF _Toc378759201 55
Exponential Average GOTOBUTTON _Toc378759202 PAGEREF _Toc378759202 55
Momentum GOTOBUTTON _Toc378759203 PAGEREF _Toc378759203 56
Fitted Curve GOTOBUTTON _Toc378759204 PAGEREF _Toc378759204 56
Custom Functions GOTOBUTTON _Toc378759205 PAGEREF _Toc378759205 56
Working with charts and series GOTOBUTTON _Toc378759206 PAGEREF _Toc378759206 57
Click events GOTOBUTTON _Toc378759207 PAGEREF _Toc378759207 57
Chart OnClickSeries GOTOBUTTON _Toc378759208 PAGEREF _Toc378759208 57
Chart OnClick GOTOBUTTON _Toc378759209 PAGEREF _Toc378759209 57
Series OnClick and OnDblClick GOTOBUTTON _Toc378759210 PAGEREF _Toc378759210 58
Custom drawing on the chart GOTOBUTTON _Toc378759211 PAGEREF _Toc378759211 58
Calculating Co-ordinates GOTOBUTTON _Toc378759212 PAGEREF _Toc378759212 58
Chart Canvas GOTOBUTTON _Toc378759213 PAGEREF _Toc378759213 60
Internal bitmap GOTOBUTTON _Toc378759214 PAGEREF _Toc378759214 61
Repainting GOTOBUTTON _Toc378759215 PAGEREF _Toc378759215 62
Where to draw ? GOTOBUTTON _Toc378759216 PAGEREF _Toc378759216 62
Chart Regions GOTOBUTTON _Toc378759217 PAGEREF _Toc378759217 62
Drawing GOTOBUTTON _Toc378759218 PAGEREF _Toc378759218 62
Setting Axis scales GOTOBUTTON _Toc378759219 PAGEREF _Toc378759219 63
CustomDraw (Axis) GOTOBUTTON _Toc378759220 PAGEREF _Toc378759220 66
Series manipulation GOTOBUTTON _Toc378759221 PAGEREF _Toc378759221 66
Creating Series at runtime. GOTOBUTTON _Toc378759222 PAGEREF _Toc378759222 67
Series array property GOTOBUTTON _Toc378759223 PAGEREF _Toc378759223 67
SeriesCount property GOTOBUTTON _Toc378759224 PAGEREF _Toc378759224 68
Deleting Series GOTOBUTTON _Toc378759225 PAGEREF _Toc378759225 68
Changing the Series Z order at runtime. GOTOBUTTON _Toc378759226 PAGEREF _Toc378759226 68
Adding Points GOTOBUTTON _Toc378759227 PAGEREF _Toc378759227 69
Null Values GOTOBUTTON _Toc378759228 PAGEREF _Toc378759228 69
Controlling Points Order GOTOBUTTON _Toc378759229 PAGEREF _Toc378759229 70
XY Points GOTOBUTTON _Toc378759230 PAGEREF _Toc378759230 71
Point Limits GOTOBUTTON _Toc378759231 PAGEREF _Toc378759231 71
Deleting Points GOTOBUTTON _Toc378759232 PAGEREF _Toc378759232 71
Retrieving and modifying Points GOTOBUTTON _Toc378759233 PAGEREF _Toc378759233 71
Locating Points GOTOBUTTON _Toc378759234 PAGEREF _Toc378759234 72
Point Statistics GOTOBUTTON _Toc378759235 PAGEREF _Toc378759235 72
Notifications GOTOBUTTON _Toc378759236 PAGEREF _Toc378759236 73
Point Colours GOTOBUTTON _Toc378759237 PAGEREF _Toc378759237 73
Point Labels GOTOBUTTON _Toc378759238 PAGEREF _Toc378759238 73
Changing the Series type at runtime - Advanced GOTOBUTTON _Toc378759239 PAGEREF _Toc378759239 73
Printing Charts GOTOBUTTON _Toc378759240 PAGEREF _Toc378759240 74
Margins GOTOBUTTON _Toc378759241 PAGEREF _Toc378759241 74
Resolution GOTOBUTTON _Toc378759242 PAGEREF _Toc378759242 74
Print, PrintLandscape. GOTOBUTTON _Toc378759243 PAGEREF _Toc378759243 75
PrintPartial GOTOBUTTON _Toc378759244 PAGEREF _Toc378759244 75
Multiple Charts per Page GOTOBUTTON _Toc378759245 PAGEREF _Toc378759245 75
Windows and printers limitations GOTOBUTTON _Toc378759246 PAGEREF _Toc378759246 75
Chart Zoom and Scroll GOTOBUTTON _Toc378759247 PAGEREF _Toc378759247 76
Zoom GOTOBUTTON _Toc378759248 PAGEREF _Toc378759248 76
Animated Zoom GOTOBUTTON _Toc378759249 PAGEREF _Toc378759249 76
Zooming by code GOTOBUTTON _Toc378759250 PAGEREF _Toc378759250 77
Undoing Zoom GOTOBUTTON _Toc378759251 PAGEREF _Toc378759251 77
Zoom Events GOTOBUTTON _Toc378759252 PAGEREF _Toc378759252 78
Scrolling GOTOBUTTON _Toc378759253 PAGEREF _Toc378759253 78
Scroll event GOTOBUTTON _Toc378759254 PAGEREF _Toc378759254 79
Controlling scroll GOTOBUTTON _Toc378759255 PAGEREF _Toc378759255 79
Keyboard Scrolling GOTOBUTTON _Toc378759256 PAGEREF _Toc378759256 79
Real-Time Charting and Speed GOTOBUTTON _Toc378759257 PAGEREF _Toc378759257 79
BufferedDisplay GOTOBUTTON _Toc378759258 PAGEREF _Toc378759258 80
Functions GOTOBUTTON _Toc378759259 PAGEREF _Toc378759259 80
Adding a function with the Chart editor GOTOBUTTON _Toc378759260 PAGEREF _Toc378759260 80
Deleting a function with the Chart editor GOTOBUTTON _Toc378759261 PAGEREF _Toc378759261 81
Changing a FunctionType with the Chart editor GOTOBUTTON _Toc378759262 PAGEREF _Toc378759262 81
Adding a function by code GOTOBUTTON _Toc378759263 PAGEREF _Toc378759263 81
Deleting a function by code GOTOBUTTON _Toc378759264 PAGEREF _Toc378759264 82
Period GOTOBUTTON _Toc378759265 PAGEREF _Toc378759265 82
Editing charts GOTOBUTTON _Toc378759266 PAGEREF _Toc378759266 83
Navigating the Chart Editor and using the Object Inspector GOTOBUTTON _Toc378759267 PAGEREF _Toc378759267 83
Pages of the Chart Editor GOTOBUTTON _Toc378759268 PAGEREF _Toc378759268 83
Page tab sections of the Chart Editor GOTOBUTTON _Toc378759269 PAGEREF _Toc378759269 83
Object Inspector GOTOBUTTON _Toc378759270 PAGEREF _Toc378759270 83
Index 85
Introduction
Thank You for using TeeChart version 3 - we hope you enjoy working with it!
This manual is aimed at helping those with or without experience of development with TeeChart. Theres a Quick Start section to get you up to speed on the fundamentals of TeeChart version 3, a chart type overview and a comprehensive Charting reference section. Weve packed in many hints and tips, basing the contents on our experience of types of questions received from TeeChart customers.
The manual is protected by copyright. Please dont distribute the whole manual. Feel free, however, to copy and distribute any specific parts of this manual you find useful.
TeeChart version 3 contains many exciting new features.
There are many new enhancements and extensions to both Chart and data series types. The Chart Editor has improved to offer an integrated configuration interface (one-stop shop) for both chart and series.
All the underlying native
Series can be connected to Tables, Queries and
RemoteDatasets residing on different Forms or DataModules. You can create
ActiveX Forms containing Chart components and deploy them on the WWW using new
TChart is seamlessly integrated with
QuickReport with a custom built TChart component on the QuickReport palette in
Royalty free!! If you wish to distribute your programs compiled with TeeChart components you are free to do so with no royalties XE 'royalties' !! If you wish to distribute your programs with the possibility that users may retouch or access the code of any TeeChart components therein, or use TeeChart components to re-compile their code, you should purchase TeeChart for those users as they will require access to TeeChart source code or compiled units.
Disclaimer
TeeMach SL disclaim all warranties, either express or implied, including but not limited to implied warranties of merchantability and fitness for a particular purpose, with respect to the instructions contained in this manual.
In no event shall TeeMach SL be liable for any damages whatsoever (including without limitation, damages for loss of business profits, business interruption, loss of business information, or other pecuniary loss), even if TeeMach SL have been advised of the possibility of such damages.
TeeChart charting components have been
written in
Runtime TeeChart libraries are included as
part of
Features of TeeChart 3 runtime version:
|
32-bit version
for standard Series types Statistical functions Data aware Series Gallery 2D, 3D QuickReport Integration Zoom, scroll and real time Royalty free Custom drawing Custom printing Extensive demos Design time integrated Chart and Series editor Online help Electronic reference manual (Word format) |
TeeChart Pro is a comprehensive charting tool aimed at those developers wishing to program with or make use of extended TeeChart functionality. TeeChart Pro includes 100% source code.
Extended features of TeeChart Pro:
|
100 % Source code 16-bit version
for 32-bit version
for Extended Series types Custom Series creation Developer Custom Series guide Extended Statistical functions Extensive demo code Runtime Chart Editor and Gallery Extended Online help Printed reference manual with developer guide |
With TeeChart Pro you define the limits. Use the developer guide to help you create hot-spots for drilldown on your charts or customise the TeeChart code to create your own series types and functions and permanently add them to the TeeChart Gallery. With 100% source code you can choose which functionality to deliver.
How to obtain TeeChart Pro
To obtain TeeChart Pro you could use the
auto-create order form in the about
TeeChart section, accessible via a right-mouse click on your chart in
Getting Started
This section should bring you up to speed if you are trying out TeeChart version 3 for the first time. Building a chart from scratch is very quick with TeeChart so we recommend it worth your while to run through the examples in your Delphi IDE.
You may already have TeeChart v3 runtime installed as shipped with
Copy these four
Tee30.dpl
TeeDB30.dpl
TeeUI30.dpl
DCLTee30.dpl
2. Install DCLTee30 as a Delphi 3 package
using the
Packages
Tee30
TeeDB30
TeeUI30
DCLTee30
They are installed in the recommended default Borland directory for packages.
TeeChart
3 runtime version (the version shipped as standard
with Delphi version 3) is only available as a package for
TeeChart comes with its own context sensitive help file. Help will become available when the TeeChart package is installed. If you experience any problems, confirm that the TeeChart.hlp file is installed in the default Borland helpfile directory.
TeeChart has been written to integrate with QuSofts QuickReport. QuickReport integration is installed as standard with the TeeChart version 3 runtime package.
TeeChart v3 runtime supports QuickReport version 2.
This manual may be printed, copied and distributed as required. Please maintain the reference of source for the document when used out of direct context (TeeMach TeeChart version 3 Chart Guide).
Whilst designing your project using a TeeChart component you may select the component from the component palette or on the form where you have placed it and key F1. Context sensitive help relating to that component will appear.
Highlight a property or event in Object Inspector and key F1 to obtain help for that item. Alternatively write the word for which you would like some help in your code. Select the word by placing and clicking the cursor on that word and key F1. If help is available, TeeChart context sensitive help will access directly a description relating to that functionality.
To create a Chart using TeeChart Wizard
select the File menu in
Simply double-click the icon to start creating charts! The Wizard will lead you through the steps necessary to create your own non-database or database aware chart.
There are three TeeChart icons in the component palette.
|
|
|
|
|
|
|
|
|
TChart |
TDBChart |
TQRChart |
TQRChart, is a component especially tailored for use with Qusofts QuickReport - We will discuss it in another chapter. TQRChart XE 'TQRDBChart is descendant of TDBChart
The 2 components, TChart XE 'TChart and TDBChart XE 'TDBChart are the basic building blocks of all TeeChart charts.
If you wish to create the data series for your chart manually, or via a coded procedure then use the TChart component. If you wish to source your graph data from a table or SQL query then use the TDBChart component. You may, of course, use TDBChart in all cases but it will result in a larger compiled size of your code which would be inefficient if you are not using a datasource (explanation follows).
Once an initial data series is defined, both chart components, TChart and TDBChart support the use of another data series as a data source.
So why two kinds of Chart components? - couldnt we achieve this functionality via just one component?
Answer:
Projects compiled with using only TChart components, don't need the Borland Database Engine DLL's (BDE).
Internally, both derive from the TCustomChart XE 'TCustomChart component, which is responsible for most charting capabilities.
Many of the steps necessary for defining a TChart or TDBChart are the same. This section describes the common steps needed to start defining either of the two types of chart.
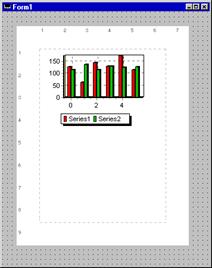
Create a new form and place a TChart or TDBChart component on it (drag it across from the component palette).
Drag the corners of the new TChart or TDBChart component out to a size that helps you visualise the contents of the new chart as you define it. Later you can adjust the size of the chart to suit your needs.
Position the mousepointer over the new chart and press the right mousebutton. A menu appears that includes the Edit Chart option.
|
Fig. STYLEREF 1 n SEQ Fig. * ARABIC r 1 Using the right mouse button on the chart will call the Chart options menu. |
|
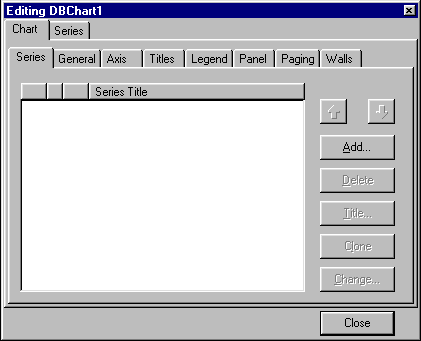
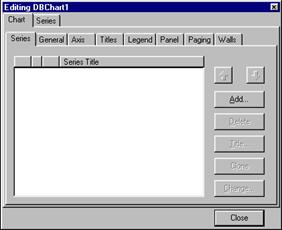
Select the Edit Chart option to edit the chart and define and populate its data series.
|
Fig. STYLEREF 1 n SEQ Fig. * ARABIC The Chart Editor screen |
|
The Chart page (1st page) of the Chart editor contains definition information for the chart. There are various sections to define general and other more specific, chart parameters. Some parameters wont apply until you have some data series defined in the chart. Try modifying a parameter, the Title for example, and you will see it update in real time on the chart.
All OK. - But what we really want to see is our data charted. To do that we need to create a data series.
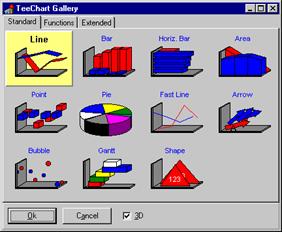
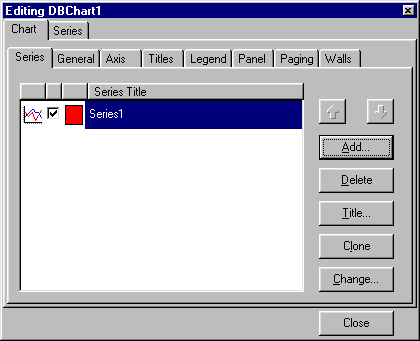
Press the Add button in the Series tab section of the Chart page. TeeChart will show you a gallery of series types. Select one to add to your chart, you can change its type later if you decide that you would prefer to visualise your data in a different way.
|
Fig. STYLEREF 1 n SEQ Fig. * ARABIC The Chart Gallery |
|
Select a series type by mouse or with arrow keys and press OK. Double-clicking on the series type will achieve the same result. The Extended series page is only available in the Gallery with TeeChart Pro[1].
The series type is automatically added to your chart. In the chart editor you will see a new configuration tab added for the new series.
Suppose we had selected a line series. The editor will appear as follows:
|
Fig. STYLEREF 1 n SEQ Fig. * ARABIC New series added to chart |
|
TeeChart has added the series to the chart. It has also added some random values so that you can visualise, in the chart, the series appearance at design-time to easily follow any changes you are making.
Press the F9 key to compile your project. The project should compile to show you an empty chart. The random values dont work at runtime so the next step is to go back to the chart editor and add a data source or write your own code to add data values.
Selecting the series tab allows you to edit your series. The next step is to add data to the series. The steps necessary to include the data for the series vary slightly between a TChart component and a TDBChart component. See the following 2 sections:
Configuring data series in a TChart for a description on how to add data to a TChart series.
Configuring data series in a TDBChart describes the actions necessary to add data to a TDBChart series.
We have a TChart on the form and have added a series to it. We are ready to populate the series.
Lets type some Pascal code to add points values programmatically.
We'll see later how to create a database-aware Chart with automatic record retrieval.
Suppose the series we added was a Pie series. We could populate the series in the following way. For the following code to work we should leave the series name as its default of Series1.
Place a TButton on your Form and go to the OnClick event .
Copy the following code at the Button1.OnClick event:
With Series1 do
Begin
Add( 40, 'Pencil' , clRed ) ;
Add( 60, 'Paper', clBlue ) ;
Add( 30, 'Ribbon', clGreen ) ;
end;
A description of the Add method and other available methods and properties is available at design time via the context sensitive help included with TeeChart. Place the cursor on the word Add in your code and press F1 for a full description of the method.
Return to your code and press F9 again to run the project.
Press Button1 to see the Pie chart appear - the code works!
Close the program to go back to
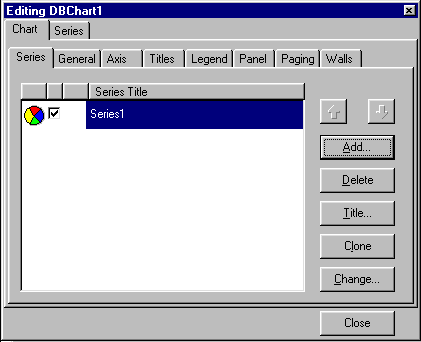
In design mode, all Chart and Series properties are accessible through the Delphi Object Inspector or by right-clicking the Chart and selecting the Edit chart option or double-clicking on the part of the Chart that you wish to edit. Here well use the Chart editor to edit our new chart and series. Fig. 5 Shows the first editor screen.
To edit features of the series we can double-click on the series in the list or highlight the series and select Edit or directly select the tab for the series - each technique will take us to the editor for the series.
|
Fig. STYLEREF 1 n SEQ Fig. * ARABIC The Chart Editor screen showing the new Pie series |
|
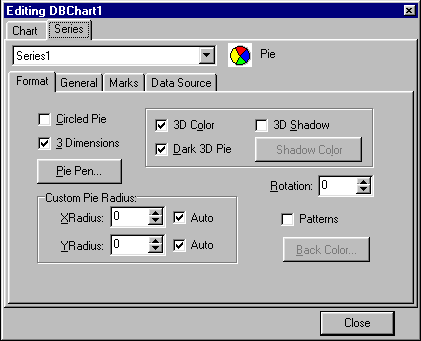
Try changing some properties of the Pie series; you will see the results update automatically on the chart. There is no cancel to undo changes but most parameters are easily toggled. Remember, in design time the TChart component hasnt yet run your code so it shows the randomly generated set of data. You will need to start your project to see how the new parameters show up with your own data.
|
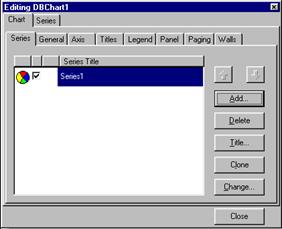
Fig. STYLEREF 1 n SEQ Fig. * ARABIC The Chart Editor series page showing editor tab for our Pie series |
|
Many things can be done visually in the editor, or try modifying some parameters in Object Inspector, or modifying a property with your own code. For more advanced projects, youll most likely find yourself typing some Object Pascal code.
Now well take a closer look at adding data to the TDBChart component.
Prior to using any database facilities, you should have correctly installed the Borland Database Engine (or equivalent) and the Database Delphi VCL components.
A Step by step guide to creating a database aware chart.

![]()
Place a TTable XE 'TTable component and point it to the 'DBDEMOS' database and the 'ANIMALS.DBF' dBase table.
Place a TDatasource XE 'TDatasource component and set its DataSet property to Table1.
Place a TDBGrid XE 'TDBGrid and set the DataSource XE 'DataSource property to DataSource1.
Set the Table XE 'Table 1.Active property to TRUE to see the Grid filled with table data.
Place a TDBChart XE 'TDBChart component onto a Form.
Select and install a Pie XE 'Pie' series as described in section REF _Ref369794094 n Edit the new chart
Go to the series page of the Chart editor by either double-clicking on the series name, highlighting the series and selecting Edit, or by selecting the series tab.
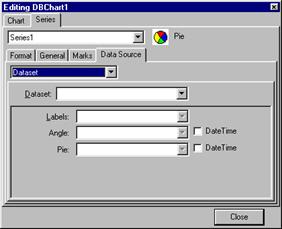
Select your series from the series listbox and go to the datasource tab.
From the listbox select your data source type.
There are 4 types of data source available. The DataSource XE 'DataSource style is a component property that may be one of the following:
No data if points are being added programmatically (at source code).
or
Random values draw your chart series with random values.
or
A function XE 'function' which may be:
One or more other series (like LineSeries1, BarSeries2, etc.) which could come from this chart or from another chart in your project. A function may work with a combination of one or more other series and an algorithmic function (min, max, average, etc.).
or..
A Dataset which may be a:
TTable, TQuery, TClientDataset or any other TDataset component. (like Table1, TQuery1, etc.)
Adding a dataset
For our example, let's choose the 4th option from the previous section, Dataset style. In our TDBChart well include data from the table that weve already added to the form.
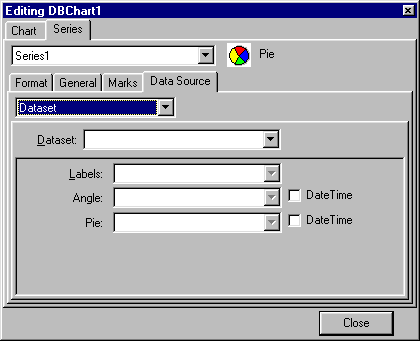
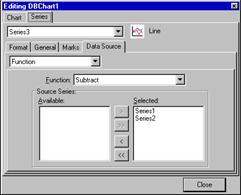
You need to select the listbox option A dataset to map this series to the table that you have included in the project. As you make the selection you will notice new page options appear to define the dataset for the pie series. Your editor should look like Fig. 5-7
|
Fig. STYLEREF 1 n SEQ Fig. * ARABIC The Chart Editor screen showing the Data source tab for our pie series |
|
All you need to define a simple dataset for the series lies here. You have already included a table and datasource in your form, and set the table to active. But the options here offer you the flexibility to define the dataseries in varying ways:
Click on the down-arrow for the Dataset: combobox.
If you have an activated table in the form it will be
highlighted here.
Select your table.
Define the values that will be plotted in the chart:
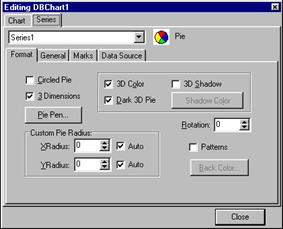
As we have defined a Pie XE 'Pie' series we are presented with pie specific configuration options. Each series has parameters that vary, but only slightly, in definition from the example below.
The Pie field is mandatory, and must contain a valid numeric field or a string field with values that can be converted to numbers.
In our example, choose the Weight field.
(The ANIMALS table is a collection of animal names with weight and size information.)
You can optionally select an Labels XE 'Labels' field to draw the corresponding string for each point on the pie.
In our example, choose the Name field.
This label will be used to draw the Pie Legend.
Note
Some chart series types have more than one figure to represent a point. Values that are plotted by date or time are an example of X Values XE 'X Values' Series. Not all date-time values should be equally spaced. The X Value is the specific horizontal position for each Y value XE 'Y value' . Later try deleting the pie series and adding a series of a different type, - ie. Lineseries -, you will see the option to apply X and Y values appear.
(We don't have X Values in a Pie series.)
Now click the 'OK' button.
The TDBChart component will show a Pie Chart and a Legend.
You are seeing exactly the same chart you saw when you pressed F9 to run the project.
You have seen the most basic TeeChart procedures.
The next step is to look at some examples in the demo files.
First Thing To Do:
Open in DEMOSTEEDEMO folder the TEEDEMO XE 'TEEDEMO' .DPR Delphi Project.
There are many included forms in this demo.
Each form shows a specific TeeChart feature or Series type.
Many Forms contain Pascal source code to show event handling or interactive
charting.
Let's see the ScrollForm XE 'ScrollForm' demo form. Click on Project Manager and search for USCROLL unit or ScrollForm form. This form shows a basic TChart component with one TLineSeries component.
Note:
In this example weve named the series LinesSeries1 to clearly identify it in the code. Its not necessary though to name the series according to series type as the flexibility of TeeCharts components offers the ability to change type at any time - thus series names by default are generic, Series1, Series2, etc..
Click on Form.OnCreate or switch to source code to see the following:
procedure TScrollForm.FormCreate(Sender: TObject);
begin
FillDemoPoints;
end;
procedure TScrollForm.FillDemoPoints;
var t:Longint;
begin
LineSeries1.Clear;
for t:= 0 to 59 do
AddXY( EncodeTime( 12, t, 0,0),Random(100),,clRed );
for t:= 0 to 59 do
AddXY( EncodeTime( 13, t, 0,0),Random(100),,clRed);
end;
This code will Clear LineSeries and plot two hours of random values from 0 to 100.
Because it is placed on the Form.OnCreate event, each time the form is shown, this code is executed.
Double click the Button1 component to see its associated OnClick code:
procedure TScrollForm.Button1Click(Sender: TObject);
var h,m,s,msec:word;
begin
if CheckBox1.Checked then
DecodeTime( LineSeries1.YValues XE 'YValues' .Last , h, m, s, msec)
else
DecodeTime( LineSeries1.XValues.Last , h, m, s, msec);
inc(m);
if m=60 then
begin
m:=0;
inc(h);
end;
AddXY XE 'AddPoint' ( EncodeTime( h, m, s, msec), Random(100),, clYellow );
end;
This code increments the last added point Time by one more minute.
The incremented Time value is added to the LineSeries, thus giving a new point.
The next source code is the demo purpose:
How to scroll the Horizontal Axis as new Points are added to the end ?
The easy way is to type the following code at the Series.OnAfterAdd event. This event is called each time a new point is added to the Series.
In this example, we scale the bottom horizontal chart axis to show 55 minutes prior to the last point and 5 minutes after the last point.
procedure TScrollForm.LineSeries1AfterAdd(Sender: TChartSeries;
ValueIndex: Longint);
begin
if CheckBox1.Checked then
begin
With Sender.GetVertAxis do
Begin
Automatic := False;
Minimum := 0;
Maximum := Sender.YValues.MaxValue +
DateTimeStep[ dtFiveMinutes ];
Minimum := Maximum - DateTimeStep[ dtOneHour ];
end;
end
Many possibilities can be achieved by manually setting the Axis properties.
Each Chart component has four axis: LeftAxis XE 'LeftAxis' , TopAxis XE 'TopAxis' , RightAxis XE 'RightAxis' and BottomAxis XE 'BottomAxis' . Each Axis has a boolean 'Automatic XE 'Automatic' ' property that defaults to True, meaning TeeChart will always calculate the Minimum and Maximum values for each Axis.
The Minimum and Maximum properties are of type double, allowing float numbers or DateTime representations like 'Date', 'Time', 'Now' or any other valid datetime value.
We have seen a specific TeeChart feature in detail.
Now, compile and execute this project and look at each sample form.
They should give you ideas that you can apply to your projects while you learn about TeeChart features.
The TEECHART.HLP file describes each component property in detail, with some source code examples mostly taken from the TEEDEMO project.
We suggest that you to play with each different sample form and create new small projects to test TeeChart with your real data.
Charting reference
This section describes design considerations specific to each chart and series type. Rather than attempting to list all properties that are, anyway, better covered and more easily navigable via the online help file, we would like to bring to your attention points of interest that may help in the design of your application.
To understand the design paradigm of TeeChart we need to separate conceptually, the contents of the chart -the data series- from the chart itself, e.g. its axis format, legend and titles. We can define and work with series across chart boundaries, referencing series components independently of the chart. We may, however, copy and paste a chart and it will copy with all its defined contents, axis, legends and series.
There are 2 chart components - The distinction serves simply to help cut down memory use for Charts that do not need to access a database.
Projects compiled with using only TChart components, don't need the Borland Database XE 'Database' Engine DLL's (BDE XE 'BDE' ). A new TChart will not contain configuration parameters for connecting to a database.
Version 3
The 2 chart components have subcomponents. If, for example, you wish to access or modify the property of an axis XE 'axis' of your chart you will be modifying the property of one of the following subcomponents:
BottomAxis
TopAxis
LeftAxis
RightAxis
See the online help to get a complete list of axis properties. Legend XE 'Legend is another example of of a TChart subcomponent.
The Chart components provide the backdrop for your data series. The overall look of your chart is controlled by the chart properties accessible via the Chart Editor, the Delphi Object Inspector or by coding - see the online help for a complete list.
As a backdrop you have available to you the Delphi Canvas XE 'Canvas' property and methods to calculate screen co-ordinates from values and vice-versa. The UDRAW.PAS XE 'UDRAW.PAS' example unit is a good reference point to see some examples of access to the canvas. In short, every TChart component has a 'Canvas XE 'ACanvas' t 'See Canvas' ' property which is a standard Delphi TCanvas XE 'TCanvas' t 'See Canvas' object.
Series associate with a chart via a series property called ParentChart XE 'ParentChart . The series are moveable between charts by changing the chart defined in the ParentChart property.
Via the Chart editor
After a Chart has been placed on a form, a right button click gives access to the Edit chart menu (alternatively double-click). The first screen of the Edit chart menu offers a list of button options to add, delete, clone, change type or title of a series. Adding a data series via this menu automatically associates the new data series with the chart.
Via the Object Inspector
Whilst browsing the list of components of a form in the Object Inspector you should see all series added to any chart on that form. Those series components are not directly visible on the form but are nevertheless components with accessible properties.
If, for example, and you could try this with a simple test, you have 2 charts on your form and have used the Chart editor to add a series to one of the charts - you could now access the property list of that series in the Object Inspector and change the name of ParentChart to the other chart on the form. On now opening the Chart editor for the new ParentChart you will see the series. Of course if you make this move for a series defined with DataSource from a TDBChart to a TChart you will lose the ability to access the DataSource as the TChart is not database aware.
Via code
Use the ParentChart property to associate (or disassociate) a series with a chart.
Example:
In Form1, we'll create and show another Form (Form2), and assign Form1.LineSeries1 to Form2.ChartInForm2 :
With TForm2.Create(Self) do
try
Self.LineSeries1.ParentChart := ChartInForm2 ;
ShowModal ;
finally
Free ;
end ;
That will show Form2 (containing a Chart component) and drawing Form1.LineSeries1.
All the parameters associated with charts are useful at the time you need them. There are a few parameters, however, that are worth mentioning here in special context. They are often used or serve to change the overall look, performance, or exportability of your chart.
For a more detailed study of these and many other configurable parameters please refer to section Chart reference.
Label increment, % separation and angle
It may be difficult to fit all your axis XE 'axis' labels onto the axis that displays onscreen - As an example, this is often true of date labels XE 'axis:labels' XE 'labels' t 'See axis' which are long and can have a high incidence of change on the axis.
Label Increments
TeeChart offers Label increment XE 'increment' as a means to controlling the frequency of labelling on your Chart axis. You can access the property via the Chart Editor under Axis (select your axis) - Scales - Desired increment XE 'Desired increment' . The menu shows you a list of the standard options for time increments (e.g. One second, one minute one day, etc.) Selecting one day will cut out repetitions of date on the axis, showing the date label only once for the point range of that date.
Via code you may access the property as a property of the subcomponent XE 'subcomponent' for the relevant axis.
Example:
Chart1.BottomAxis.Increment := DateTimeStep[ dtOneHour ] ;
Chart1.RightAxis.Increment := 1000 ;
% Separation XE '% Separation' t 'See Separation'
If the labels on the axis have a look of rolling into one another you can increase the % separation XE 'separation' which will forcibly increase the gap between them. In some cases this may, as a result, hide some labels. It will very much depend on your labels and whether your chart users will have the option to resize their chart.
The option is available in the Chart Editor under Axis (select your axis) - Labels - % Separation.
Setting Labels Separation to 0 % means no overlapping checking will be performed, thus all axis labels will be displayed.
Angle
If it is neither practical or possible to place the axis labels side to side along the axis another option is change the angle of the labels to 90s to the axis. This option is available in the Chart Editor under Axis (select your axis) - Labels - % Angle.
BitMaps (BMP XE 'BMP' ) or Metafile XE 'Metafile' s
TeeChart offers both the bitmap (BMP ) and the Metafile format to save charts. Two type of metafile formats are supported WMF (Windows Metafile Format) and EMF (Extended Metafile Format).
Bitmap format is used internally by TeeChart. It is quicker to draw onscreen than a Metafile. When requiring a Chart to be exported to another application or to be embedded in a container application such as MSWord a Metafile format handles resizing better onscreen - TeeChart uses Metafile format with QuickReport XE 'QuickReports'
Zoom
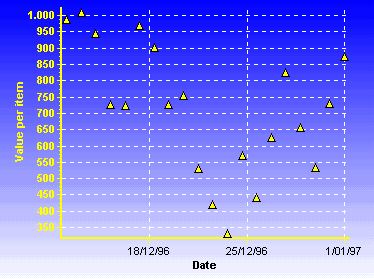
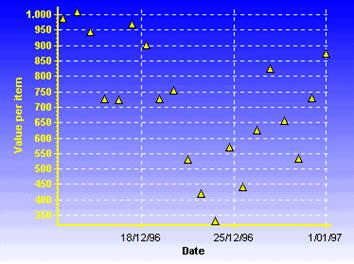
TeeChart offers as default zoom XE 'zoom' on all charts. To obtain zoom at runtime hold the left mouse button and drag mouse toward down/right. You'll see a rectangle around the selected area. Release the left mouse button to Zoom. You can continue zooming again and again. To RESTORE (or UNDO) the zoom, drag a rectangle in the opposite direction (up/left).
Note
You may use mouseclicks to activate code associated with points in data series. That OnClick behaviour will override zoom behaviour. You can set toggle between OnClick events and zoom with the CancelMouse property.
You may enable or disable zoom functionality in the Chart Editor - Chart page, General tab. The option, AllowZoom XE 'AllowZoom accesses the chart property, also changeable by code:
Chart1.AllowZoom := False;
False deactivates zoom.
Zoom can also be obtained via coding. It is necessary to obtain the screen pixel co-ordinates for the area in which you wish to do the zoom.
Example 1:
Zoom an area with 'pixel' co-ordinates:
Rect.Left := 123 ;
Rect.Top := 67 ;
Rect.Right := 175 ;
Rect.Bottom:= 100 ;
Chart1.ZoomRect XE 'ZoomRect' ( Rect );
Example 2:
Zoom an area with point value co-ordinates:
You need first to translate from value to pixel co-ordinates. To do so, you can use the Axis or Series components.
Rect.Left := LineSeries1.CalcXPosValue XE 'CalcXPosValue'
Rect.Top := LineSeries1.CalcYPosValue XE 'CalcYPosValue'
Rect.Right := LineSeries1.CalcXPosValue(57.6);
Rect.Bottom:= LineSeries1.CalcYPosValue(15000);
Chart1.ZoomRect(Rect);
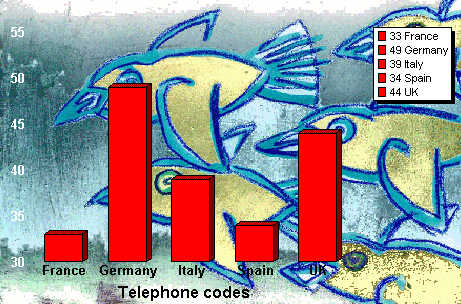
Backdrop
You can add more information to your chart or simply enhance its appearance by adding a bitmap as a backdrop.
|
Fig. STYLEREF 1 n SEQ Fig. * ARABIC r 1 Bitmap as a chart backdrop |
|
You will find the parameters to define your Chart backdrop in the General tab of the chart page of the Chart editor.
The TChart XE 'TChart component is the basic building block for
non-database-aware charts. Select the TChart component from the
TDBChart XE 'TDBChart derives from TChart and inherits all its functionality. When a Chart Series is connected to a TDBChart component, TDBChart looks in the Series DataSource property.
The datasource XE 'datasource for the series is defined by the series definition - not by the chart - Thus multiple series in a TDBChart could access different data sources. However, if those series are not associated, via ParentChart, with a TDBChart then the option to define a series database-datasource wont be available.
TeeChart charts will connect with 3 different types of Dataset XE 'Dataset'
TTable XE 'TTable
TQuery XE 'TQuery
TClientDataset XE 'TClientDataset XE 'ClientDataset'
The minimum that requires to be set in each case is:
The name of the database,
For the table the TableName of a table
or
in the case of the query a valid SQL XE 'SQL' t 'See TQuery' string.
or
in the case of a ClientDataset Define source (right button on TClientDataset object in form).
Remember to activate the Dataset by setting the Active property to True
In Getting Started you saw how to connect a data series to a database dataset XE 'dataset' t 'See datasource' . Lets recap here on the key components.
When you select your new Series in the Chart Editor Series page you will see the tab option for Data Source XE 'Data Source' t 'See Datasource' . If you want your data series to be connected to a new dataset then you should select Dataset from the drop down combo listbox. A new selector box will appear with the options for definition of the new dataset XE 'Database' t 'See Datasource'
The exact contents of the page will change depending on the series type you have chosen. The parameters you set here modify the properties in the series definition which vary between series type. The following table shows the possible options for normal series types (function series are different).
|
Series Type |
Datasource Properties |
|
Basic | |
|
Line |
XValues, YValues, XLabel |
|
Fast Line |
XValues, YValues, XLabel |
|
Bar |
XValues, YValues (called Bar), XLabel |
|
Area |
XValues, YValues, XLabel |
|
Point |
Xvalues, YValues, XLabel |
|
Pie |
PieValues, XLabel |
|
Arrow |
StartXValues, StartYValues, XLabel, EndXValues, EndYValues |
|
Bubble |
Xvalues, YValues, XLabel, RadiusValues |
|
Gantt |
StartValues, EndValues, AY (Y axis level), AXLabel (Label optionally shown on Y-axis or as mark) |
|
Shape |
X0 (Top), Y0 (Bottom), X1 (Left), Y1 (Right) |
|
Extended | |
|
Candle |
OpenValues, CloseValues, HighValues, LowValues, DateValues |
|
Error Bar |
XValues, YValues, XLabel, ErrorValues |
|
Polar |
XValues, YValues |
|
3D Surface |
XValues, YValues, ZValues |
|
Volume |
XValues, YValues (VolumeValues), XLabel |
You may populate your Chart at runtime by coding which series to add to the chart and defining the fields of those series.
It assumes you have a table on your form, Table1 with fields Name and Amount.
Var
MySeries,Ave:TLineSeries;
MySeries:=TLineSeries.Create( Self );
With MySeries do
begin
ParentChart:=DBChart1;
DataSource:=Table1;
XLabelsSource:='Name';
YValues.ValueSource:= 'Amount';
CheckDatasource;
end;
Adding values, accessing values
The TChartSeries XE 'TChartSeries component is the ancestor of all series types. When referencing the properties XE 'properties' of the series type with which you are working check, in addition to the properties listed with that series, the properties of the TChartSeries in the online help to get a full list of properties common to all series.
There are 2 line series types available, Line and Fast Line. Which one should be used ? Fast line is just what its name describes - it is fast. It is distinct from Line because to achieve speed - speed to add new points to the series - the price paid is that it foregoes some properties that the Line series has. See the section on Fast Line for a description of those differences.
|
Fig. STYLEREF 1 n SEQ Fig. * ARABIC r 1 A 3D Line series showing one series with the stairs property set to true. The stairs XE 'stairs' can be inverted. |
|
This line series draws only at 2
Dimensions but draws very quickly - performance will depend on your hardware -
The series type was originally conceived to tackle high volume requirements of
technical and financial applications but serves well for any dataset of very
If, when using Fast Line you know approximately how many data points will be added to your series you could use the global variable TeeDefaultCapacity XE 'TeeDefaultCapacity to prepare memory. For example, assuming a data series of 10,000 you should set TeeDefaultCapacity to 10,000. This will, in one pass, allocate memory to populate the whole series replacing the need to incrementally allocate memory which costs more time.
The bar XE 'bar' series in 2 or 3 dimensions doesnt have to be represented by a rectangular bar -
|
Fig. STYLEREF 1 n SEQ Fig. * ARABIC Choose a barstyle XE 'barstyle' for your Chart series or mix and match to suit your needs. |
|
Mixing bar XE 'bar' series styles may be useful for some applications. Below is an example stacked bar chart.
|
Fig. STYLEREF 1 n SEQ Fig. * ARABIC Mixed bartypes |
|
Steps taken to build this demo chart and populate it with data are as follows:
1. Drag a Chart component onto your form and drag it out to the size you want.
2. Click the right mouse button over the chart and select editor from the menu.
Add 3 bar series and give them individual titles using Title on the first editor screen (titles in our example East West and Other).
Select Multi Bar and set as stacked in the Format page of any one of the 3 series (The change will apply to all 3 series).
Add a title using the entry tab for Titles XE 'Titles' in the Chart page of the editor.
Go to the axis tab. Select Left axis and add the title. We allowed the axis to automatically size itself but took minor XE 'minor' ticks XE 'ticks' off on the bottom axis.
Each series has a different shape defined for its bars. We define the shape individually in the configuration page of each barseries. The first tab, Format, has the option for Style.
You could code the style with:
East.BarStyle:= bsPyramid ;
West.BarStyle:= bsInvPyramid ;
Other.BarStyle:= bsRectangle ;
Lookup BarStyle in the TeeChart online help to get the full list of options.
For this chart it would be necessary to control the series order to achieve the correct effect. This can be done in the Chart Editor at design time by selecting the series in the series list of the Chart page and using the arrows to change the order. At runtime we can achieve the same with the following code:
Drawing order is always based on the order for which the series are assigned to ParentChart XE 'ParentChart
The order can be altered at run-time via the Serieslist XE 'Serieslist property:
Chart1.SeriesList[ 0 ] := East;
Chart1.SeriesList[ 1 ] := West;
Chart1.SeriesList[ 2] := Other;
We added some random XE 'random' values to populate this demo. We could launch the code at form creation or put a button on the form to run the code.
procedure OurForm.Button2Click(Sender: TObject);
var t:integer;
begin
Randomize;
with East do
for t:=1 to 12 do AddY( Random(70), ShortMonthNames[t],clTeeColor);
with West do
for t:=1 to 12 do AddY( Random(70), ShortMonthNames[t],clTeeColor);
with Other do
for t:=1 to 12 do AddY( Random(30), ShortMonthNames[t],clTeeColor);
end;
We populated the data for 12 months but are showing only 5 months. The Paging XE 'Paging' tab in the Chart page of the editor has the definition of points per page.
The Multi Bar XE 'Multi Bar' parameter set in the Format tab of the series page for one of the bar series sets the display alignment of the bars for each bar series in the Chart. - It is not necessary to go to each bar series to change the parameter.
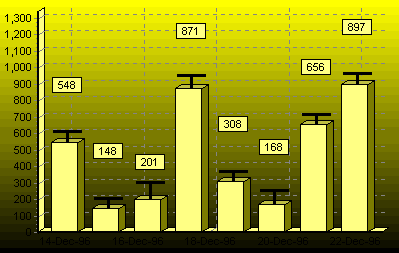
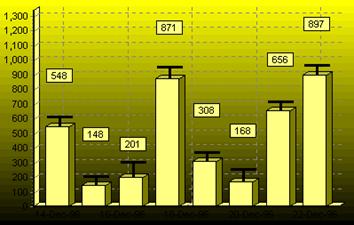
The following figure shows different formats to display bar series. Each Chart has the same information only displayed in a different way. The Stacked 100% series display doesnt represent the actual values but rather the relative value of each element of the series to a total of 100%.
|
Fig. STYLEREF 1 n SEQ Fig. * ARABIC . a A 3D Bar series showing four methods to display the same information. |
|
Stacked XE 'Stacked' property None |
|
Fig. 8-4. b |
|
Side |
|
Fig. 8-4. c |
|
Stacked |
|
Fig. 8-4. d |
|
Stacked 100% |
The horizontal bar XE 'horizontal bar' series shares the same properties as the bar series. Apart from any aesthetic requirement, one occurrence of the need to use a horizontal bar series may be to adequately display long axis labels which are best read horizontally.
|
Fig. STYLEREF 1 n SEQ Fig._ * ARABIC 2D Horizontal bar |
|
An Area series XE 'Area series' has similar characteristics to a line series - filled -
|
Fig. STYLEREF 1 n SEQ Fig. * ARABIC 3D Area series |
|
A Point series XE 'Point series' is similar in definition to a Line series without the line.
|
Fig. STYLEREF 1 n SEQ Fig. * ARABIC 2D Horizontal bar |
|
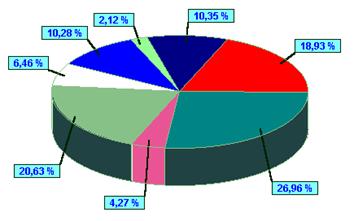
A Pie series XE 'Pie series' is unique in not needing any axis. It is possible to mix a Pie series in a Chart with another series that requires an axis.
|
Fig. STYLEREF 1 n SEQ Fig. * ARABIC 3D Pie |
|
|
Fig. STYLEREF 1 n SEQ Fig. * ARABIC 3D Arrow series |
|
The arrow XE 'arrow' series is useful for displaying start and end points of many individual events.
The Bubble XE 'Bubble' series has 3 configurable parameters that define the value of the data in your series.
Xvalues, YValues, RadiusValues
The bubble series is useful for showing importance weighting. For example, comparing high volume selling product that, by income, doesnt bring in a revenue of the scale of another low volume seller. We can see at a glance, literally, that big bubbles are important !
|
Fig. STYLEREF 1 n SEQ Fig. * ARABIC 2D Bubble Chart |
|
Shapes
Bubble series can be configured in variable shapes, triangles, etc..
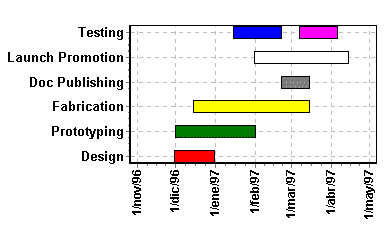
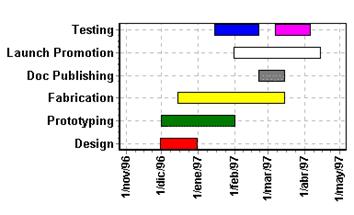
Use the Gantt chart as a planner or to track progress of a project or series of activities.
The Gantt series draws bars that have start and end values which may be of datetime format. You may define a Y axis value for the vertical position of the bar and you may define next bar to draw connection lines between the bars.
|
Fig. STYLEREF 1 n SEQ Fig. * ARABIC 2D Chart with a Gantt series. |
|
Use the AddGantt or AddGanttColor methods.
Example:
GanttSeries1.AddGantt( EncodeDate( 1997, 1, 1 ),
EncodeDate( 1997, 1, 31 ),
0,
'Programming' );
Or
GanttSeries1.AddGanttColor(EncodeDate( 1997,1,1 ),
EncodeDate( 1997,1,31),
0, 'Programming',
clGreen );
Where '0' is the desired vertical position for this bar.
Choose the vertical position you prefer.
To connect gantt bars:
1) Store the 'AddGantt' or 'AddGanttColor' function return longint:
Var tmp1, tmp2 : Longint;
tmp1:=GanttSeries1.AddGantt(EncodeDate(1997,1,1 ),
EncodeDate( 1997,1,31 ),
0,'Programming' );
tmp2:=GanttSeries1.AddGantt( EncodeDate( 1997,4,1 ),
EncodeDate( 1997,4,30),
0, 'Testing' );
2) Then use the NextTask property:
GanttSeries1.NextTask[ tmp1 ] := tmp2 ;
This will draw a line from 'Programming' gantt bar to 'Testing' bar. The 'ConnectingLinePen' property is the pen used to draw lines.
Shape series are useful for defining or adding any additional information to your chart, perhaps in runtime as a result of receipt of exceptional data. You may add text to any shape you add to your chart and relate the shape to another series.
|
Fig. STYLEREF 1 n SEQ Fig. * ARABIC Shape series |
|
Each shape has two co-ordinates associated with it, top left and bottom right of the invisible rectangle that encloses the shape. You may add text to the box. These co-ordinates and messages could be updated at runtime by your code to dynamically put the shapes anywhere on your chart.
There is no practical limit to the number of series that you can add concurrently to your chart.
You may mix different series types, almost any series type with any other series type. For certain combinations it is not practical as axis definition between series may directly conflict. For those cases the series not available are greyed out in the series gallery so that you cannot mistakenly select them.
See the section on functions for more about combining series types. Functions work with other series to create and display algorithmic relationships.
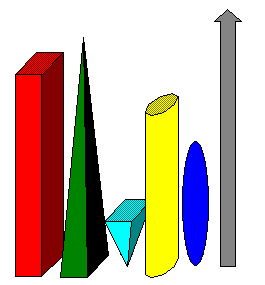
|
Fig. STYLEREF 1 n SEQ Fig. * ARABIC Combining series |
|
Combining seriestypes in one chart can add a great deal of information value. The following example shows the incomes by Division and puts the $ index in the same chart to measure the effect of that external influence on incomes (perhaps no influence at all in this example !!).
|
Fig. STYLEREF 1 n SEQ Fig. * ARABIC 2D Combining series types |
|
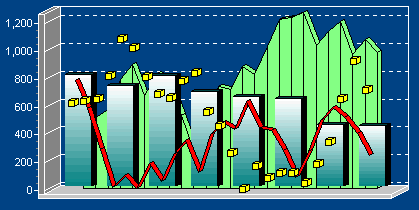
You may combine series in 3D Charts. The previous example is represented in 3D below. The chart looks attractive although a high degree of 3D perspective makes it more difficult to visualise the monthly $ index with Division incomes.
|
Fig. STYLEREF 1 n SEQ Fig. * ARABIC 3D combining series types (60% 3D) |
|
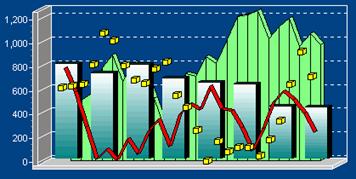
You could minimise the effect by reducing the extent of side view (percentage 3D).
|
Fig. STYLEREF 1 n SEQ Fig. * ARABIC 3D combining series types (6% 3D) |
|
Or you could modify code so that at runtime the chart will put all series in the same Z-plane. 3D charts have a property called Z-Order (see figure) which controls the depth position of each series.

It is possible to put all series on the same plane although we advise caution as the effect may be confusing depending on which series types you are combining.
The following line of code (name of chart here Chart1) will put all series in the same Z plane:
Chart1.ApplyZOrder:=False;
Extended series XE 'Extended
series' types are only available with TeeChart Pro XE 'TeeChart Pro' . For more
information on how to obtain TeeChart Pro see the section About TeeChart or right-click on your chart at design time in
|
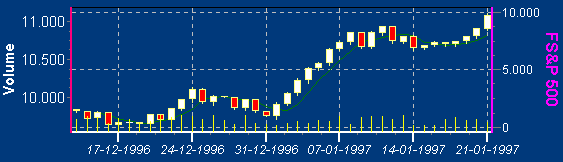
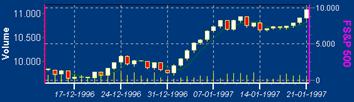
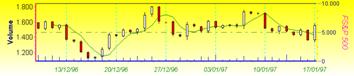
Fig. STYLEREF 1 n SEQ Fig. * ARABIC r 1 2D Candle with moving average and volume |
|
The candle XE 'candle' series XE 'candle series' derives from TOHLCSeries XE 'TOHLCSeries . Its properties include HighValues XE 'HighValues LowValues XE 'LowValues OpenValues XE 'OpenValues and CloseValues XE 'CloseValues and DateValues XE 'DateValues . The candle is ideally suited to tracking financial market information.
Example
If you look at the figure of the zoomed candle you can see how the financial information is tracked. White bars reflect the market rising, high end of the white bar being the day close. The red bars identify a fall in the market. The thinner lines show the days high and lows.
|
Fig. STYLEREF 1 n SEQ Fig. * ARABIC Candle zoomed |
|
The following code shows use of the AddOHLC method. This code fills the series, evenly divided across the screen, with random data. You could substitute the random clauses with sources of you own data or connect your candleseries directly to a dataset via the Chart editor.
Var
tmpopen,tmp:longint;
CandleSeries1.Clear;
tmpOpen:=1000+Random(100);
for t:=1 to (Screen.Width div 8) do
begin
tmp:=round(100*Random-50);
CandleSeries1.AddOHLC( Date+t,tmpOpen,tmpOpen+20,tmpOpen-20,tmpOpen+tmp);
tmpOpen:=tmpOpen+tmp;
end;
end;
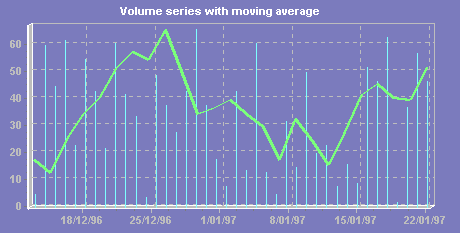
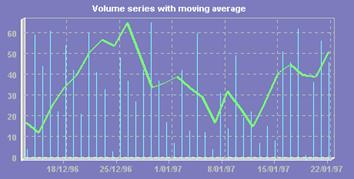
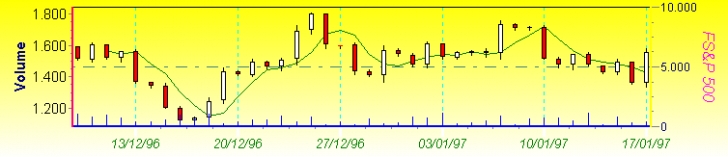
The volume series XE 'volume series' is another series with origins in financial markets. It behaves very much like a bar series except that each bar is represented as a thin line and the bars cannot be stacked.
|
Fig. STYLEREF 1 n SEQ Fig. * ARABIC Volume series with moving average |
|
The height of the T on top of the bars of the Error Series XE 'Error Series' show the size of the error.
Error bar series may be applied to any data that has a real and estimated value, a success and failure level, etc.
|
Fig. STYLEREF 1 n SEQ Fig. * ARABIC 3D Error bar |
|
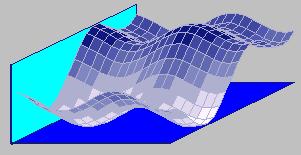
Surface series use co-ordinates in 3 planes. TeeChart surface series support null values as none data points which appear as holes in the surface.
|
Fig. STYLEREF 1 n SEQ Fig. * ARABIC 3D Surface chart |
|
The polar series XE 'polar series' plots XValues as angular rotation from 0s. The second variable, YValues are plotted as distance from the origin.
|
Fig. STYLEREF 1 n SEQ Fig. * ARABIC 2D Polar series |
|
Detailed information on how to create custom series is available with TeeChart Pro. The documentation highlights the steps necessary at code level to add new series for permanent availability in the TeeChart gallery.
TeeChart integrates seamlessly with Qusoft XE 'Qusoft' s QuickReport XE 'QuickReport' . To add a TeeChart to a QuickReport follow these steps:
Drop a QuickReport on a form.
Using the QRChart XE 'QRChart icon on the QuickReport palette

![]()
drop a TQRChart XE 'TQRChart onto the QuickReport worksheet.
You may now double click on the TQRChart to bring up the Chart editor. From this point forward you may work with the chart as with any other TDBChart
|
Fig. STYLEREF 1 n SEQ Fig. * ARABIC r 1 TQRChart on a QReport at design time |
|
Metafile
TeeChart uses Windows Metafile format for superior quality when outputting to a printer and for drawing onscreen. Also the quality of the printout is better if the Chart shape is maintained as nearly as possible to the default Chart rectangle form.
Clipping
TQRCharts do not support series clipping. The may result in slight overlay of the series onto the chart axis if data points are adjacent to the axis.
Functions are independent components that use series. When you add a new function, really what you are doing is adding a new series (as any other) then applying a function definition. Normally that function works upon one or more other series to give a dynamic result. For example if you define a line series A which has various values across one year and then you define a series B which contains the function Max(A) then you will be using series A as the input for the new series. The Max(A) function (datasource of series B) will scan the data from series A to find the maximum value then plot its own data as that value. The series type of the function is configurable, you may use any series type to represent your function data provided that the series type mix on the chart is allowed according to the general rules for combining series types - You may define a Function to use input series from another chart as its Datasource.
Note
When you add a function from the gallery of the Chart Editor, by default you will add a LineSeries. You may change the type of series afterwards to any other available series type using the Change button.
In general, all functions work to the same basic rules. The properties of the underlying series type (Line, Bar, etc.) apply to the function series. Thus a function added as a Bar series will have standard bar properties such as barwidth. There is one important property that distinguishes function series from non-function series, Period. Period applies to repetition of the function. For example, I want the average of all points of Series1 will present one flat line across the chart which is the average. I want the average of all points of Series1 by month will draw an average for each month and will display as 12 different values across a chart of 1 year.
Important
Study the implications of period carefully before applying it to your chart series. When you have only 1 series in your function the function XE 'Functions' will, by default, not apply period and you must add it manually by code if you require period breakdown of the series data. When you have more than 1 series in your function the default applied is period = 1. If you wish to obtain any other period for the function you must add it manually by code. Period is based on number of points, we dont recommend the implementation of functions composed of series with distinct point frequencies.
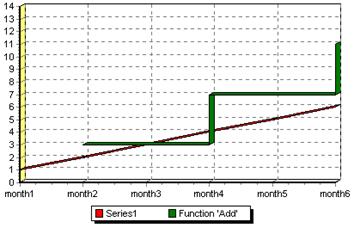
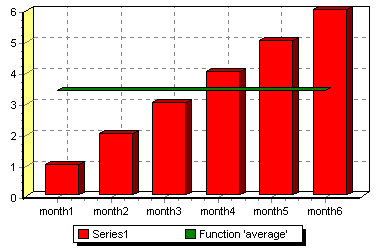
The Add XE 'Functions:Add' XE 'Add function adds data from one or more series. If we create a line series Series1, create a line series Function Add and define series Function Add as Add of Series1 and do nothing more we will obtain a chart with Series1 displayed and Function Add as one flat line which is the sum of all values of Series1. In the figure the total of 1 + 2 + 3 + 4 + 5 + 6 = 21.
|
Fig. STYLEREF 1 n SEQ Fig. * ARABIC r 1 2D Add function with 1 series input |
|
We can modify the series Function Add to represent Add of Series1 by 2 point groupings (1+2), (3+4), (5+6). We use the period XE 'Functions:period' XE 'period property (Chart Editor in the Data source page). Coded it looks like this:
Series2.FunctionType.Period:=2;
Alternatively:
TeeFunction1.Period:=2;
Defining the period as 2, sets the Add function to add every 2 points. The period property adds enormous value to function series.
|
Fig. STYLEREF 1 n SEQ Fig. * ARABIC Add function with period = 2 |
|
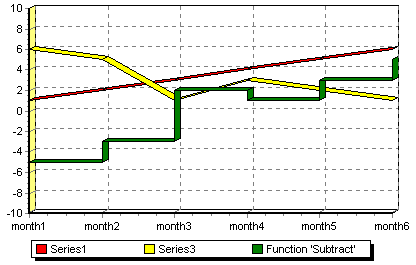
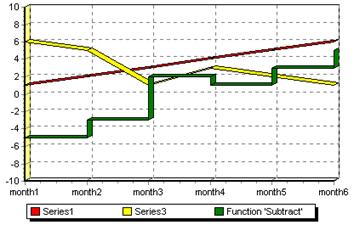
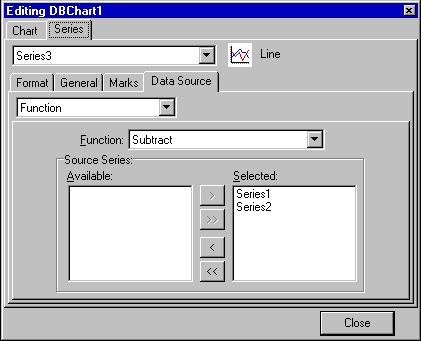
Subtract XE 'Subtract' XE 'Functions:Subtract' requires 2 input series. With more than one series in the function the default period sets to 1 axis point. the 2nd series will be subtracted from the 1st series in the list.
The following chart is defined with ApplyZOrder:=False which forces all series to draw in the same 3-Dimensional plane - The resulting series overlay (a sort of optical illusion) in the chart depends on the series paint order.
|
Fig. STYLEREF 1 n SEQ Fig. * ARABIC Subtract function |
|
The default period for the function multiply is 1. You may add as many series as you wish to the multiply XE 'multiply' XE 'Functions:multiply' function.
|
Fig. STYLEREF 1 n SEQ Fig. * ARABIC Multiply function |
|
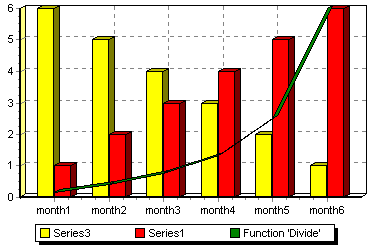
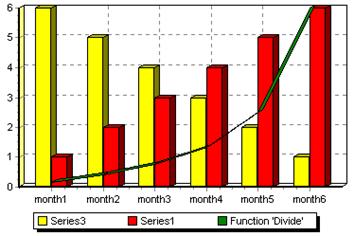
As divide XE 'divide' XE 'Functions:divide' requires at least 2 input series the default period for the divide function is 1. The 2nd series in the list is the denominator.
If you add more than 2 series then the 1st will be divided by the 2nd then that is divided by the third, etc.
|
Fig. STYLEREF 1 n SEQ Fig. * ARABIC Divide function |
|
High XE 'High' XE 'Functions:High' accepts multiple input series and will always display the highest point between those series at each period point. (1 series default period 0, 2 or more series default period 1).
|
Fig. STYLEREF 1 n SEQ Fig. * ARABIC High function |
|
Low XE 'Low' XE 'Functions:Low' accepts multiple input series. It will always display the lowest point between those series at each period point. (1 series default period 0, 2 or more series default period 1).
|
Fig. STYLEREF 1 n SEQ Fig. * ARABIC Low function |
|
|
Fig. STYLEREF 1 n SEQ Fig. * ARABIC Average function |
|
The default period for average XE 'average' XE 'Functions:average' with one series is 0 (all) which will give you the average for that series across the whole chart. If you have more than one series the period will be 1 axis point.
You may change the period to alter the frequency of the average curve.
Extended functions are available only with TeeChart Pro.
The moving average function permits you to track the current average as your data charts. You may define the period over which the moving average steps.
|
Fig. STYLEREF 1 n SEQ Fig. * ARABIC Moving average applied to track data in a candle series |
|
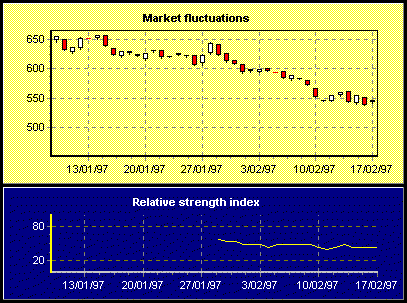
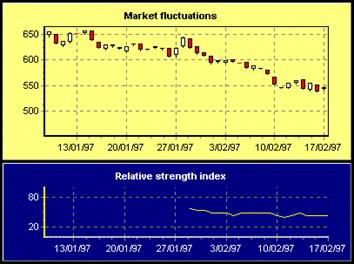
Relative Strength Index (RSI) is often used in financial applications
|
Fig. STYLEREF 1 n SEQ Fig._ * ARABIC 2D RSI curve calculating over the last 20 data points of a candle series |
|
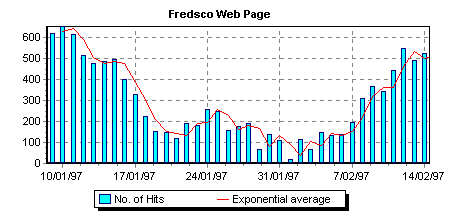
The exponential average is similar to a moving average. It has a weight factor to add importance to more recent data.
The diagram shows an exponential average with weighting 0.2.
|
Fig. STYLEREF 1 n SEQ Fig._ * ARABIC 2D |
|
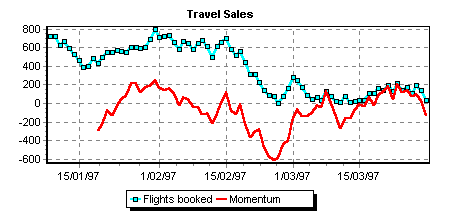
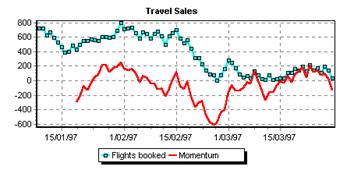
A momentum series is defined usng period. The curve takes the last value of the period and subtracts the first value.
|
Fig. STYLEREF 1 n SEQ Fig._ * ARABIC 2D Momentum series Period 10. |
|
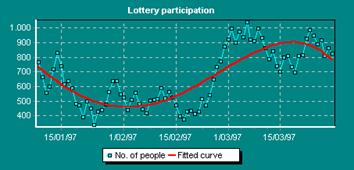
The CurveFitting Function performs a polynomical gaussian calculation on the underlying Series data to draw a smooth curve over the original points:
|
Fig. STYLEREF 1 n 2D Curve fit |
|
Detailed information on how to create custom functions is available with TeeChart Pro. TeeChart Pros Teeloper documentation highlights the steps necessary at code level to add new functions for permanent availability in the TeeChart gallery.
You have seen how to create a chart, add series and populate them. It would be useful to now be able to access the chart data at runtime. This chapter highlights some of the more common ways to program access to chart data.
The TChart event, OnClickSeries XE 'OnClickSeries' , permits access to any active series in your chart. Put the following code into your project to get an idea of the possibilities. To access the event and add the procedure definition to your project, select your chart and open the Object Inspector. Select the events XE 'events' tab to find OnClickSeries. Double-click on OnClickSeries.
procedure TForm1.DBChart1ClickSeries XE 'ClickSeries' t 'See OnClickSeries' (Sender: TCustomChart;
Series: TChartSeries; ValueIndex: Longint; Button: TMouseButton;
Shift: TShiftState; X, Y: Integer);
begin
ShowMessage(' Clicked Series: '+Series.Name+' at point: '+ inttostr(valueindex));
end;
The valueindex XE 'valueindex' t 'See OnClickSeries' refers to the index of the series data point (point, bar, etc.) within the chart. You may use it to access the X and Y value. For example:
begin
ShowMessage(' Clicked Series: '+Series.Name+' at point: '+ Floattostr(Series.XValue[valueindex]) + ',' + Floattostr(Series.YValue[valueindex]));
end;
You may use the OnClick XE 'OnClick' event of the Chart to get the same information.
procedure TForm1.DBChart1Click(Sender: TObject);
var t,tmp:Longint;
x,y:Double;
begin
Series1.GetCursorValues(x,y);
for t:=0 to DBChart1.SeriesCount-1 do
begin
tmp:=DBChart1.Series[t].GetCursorValueIndex XE 'GetCursorValueIndex'
if tmp<>-1 then
ShowMessage(' Clicked Series: '+DBChart1.Series[t].Name+' at point: '+inttostr(tmp));
end;
end;
The series OnClick XE 'OnClick' event catches click events at series level. Thus for multiple series charts you are able to restrict access to the data of a specific series. To access the OnClick event of the series you must select the series in the Object Inspector and go to the events tab.
procedure TForm1.Series1Click(Sender: TChartSeries; ValueIndex: Longint;
Button: TMouseButton; Shift: TShiftState; X, Y: Integer);
begin
ShowMessage(' hello: '+Sender.Name+' at point: '+inttostr(valueindex));
end;
If you require to add textboxes or other shapes XE 'shapes' relative to chart axis the Shape series may be the best choice. If the shape series doesnt match your specific requirement you may draw XE 'draw' your own lines and/or shapes on the chart.
TeeChart offers access to the Chart area by axis or by screen pixel. The TeeChart demos, UDraw.pas XE 'UDraw.pas' and Uhighlo.pas XE 'Uhighlo.pas' , are useful references for custom drawing XE 'custom drawing' on a chart.
This chapter explains how to convert from Point XE 'Point' co-ordinates to pixels XE 'pixels' and vice-versa. Also how to determine the exact co-ordinates for each graphics element in Chart components.
Point Values are expressed in user custom scales. Chart Axis XE 'Axis' are responsible for converting point values into suitable X and Y screen pixel co-ordinates for displaying them.
Both Axis and Series components have several functions to convert from screen co-ordinates (in pixels) to Axis or points values (in user-defined units).
The difference between using Axis or Series conversion functions is that Axis will only interpret co-ordinates for the topmost position in 3D mode, while Series will adjust co-ordinates to their Z order XE 'Z order' position.
Note: Using conversion functions is only valid after a Chart component has been drawn, either to screen or to a private hidden Canvas.
Axis Methods
You can calculate the screen position for a given value using any
Axis:
Var MyPos : Longint ;
MyPos := Chart1.LeftAxis.CalcPosValue XE 'CalcPosValue'
MyPos holds now the pixel co-ordinate for 100.0 on Chart1 Left Axis ( Vertical ), being 100.0 a floating value in Axis scales.
You can use this co-ordinate to custom draw or to calculate mouse clicks. See chapters below.
If you want to convert from pixel co-ordinates to Axis values, you can use the opposite function:
Var MyValue : Double ;
MyValue := Chart1.LeftAxis.CalcPosPoint XE 'CalcPosPoint'
MyValue holds now the Axis value co-ordinate for 100 on Chart1. Left Axis ( Vertical ), being 100 a screen pixel co-ordinate.
Note: Pixel co-ordinates start from 0, being 0,0 the Chart origin point. This is valid for screen, but when drawing to metafiles, drawing to custom canvases or printing, Chart origin point can optionally be different than 0,0.
The Chart1.ChartBounds XE 'ChartBounds' property returns the origin and ending co-ordinates for the Chart bounding rectangle.
Axis have another function to calculate how much screen space represents a given Axis range:
Var Space : Longint ;
Space := Chart1.LeftAxis.CalcSizeValue( 1000 );
Remember Axis can be DateTime and you can
for example convert a
Var Space : Longint ;
Space := Chart1.BottomAxis.CalcSizeValue XE 'CalcSizeValue'
EncodeDate( 1997,12,31) - EncodeDate( 1997,1,1) );
You could use CalcYPos XE 'CalcYPos' and CalcXPos XE 'CalcXPos' . When drawing using the XPos and YPos co-ordinates remember that the co-ordinate 0,0 is Top,Left of the Chart rectangle, ChartRect. ChartRect XE 'ChartRect' is the area enclosed by the 4 axis of the chart.
The following example draws a line from an arbitary point from the Y-axis across the chart. Note the use of canvas properties.
procedure TForm1.Button1Click(Sender: TObject);
var
MyHalfwayPoint, YPosition:longint;
Begin
With Series1.YValues do
MyHalfwayPoint:=round(((MaxValue-MinValue)* 0.5) + MinValue);
YPosition:=DBChart1.LeftAxis.CalcYPosValue
(MyHalfwayPoint);
With DBChart1.Canvas do
begin
Pen.Width:=3;
Pen.Style:=psSolid;
Pen.Color:=clBlack;
with DBChart1 do
begin
MoveTo(ChartRect.Left,YPosition);
LineTo(ChartRect.Left+Width3D,YPosition-Height3D);
LineTo(ChartRect.Right+Width3D,YPosition-Height3D);
end;
end;
end;
Series Methods
Series have similar methods for converting co-ordinates to point values and vice-versa. The main difference is that by using the Series method you dont need to know the exact Axis component for calculations.
This is a big advantage when having Series associated to Right or Top Axis, or multiple Series associated to each Axis.
This code calculates where in the screen the Series1 point with value 1000 is located:
Var MyPos : Longint ;
MyPos := Series1.CalcPosValue XE 'CalcPosValue'
or
MyYPos := Series1.CalcPosValue( Series1.YValue[ 0 ] ) ;
You can calculate both X and Y co-ordinates for a specific point or for a specific point value:
MyXPos := Series1.CalcXPos XE 'CalcXPos' ( EncodeDate( 1997, 12, 31) ) ;
or
MyXPos := Series1.CalcXPos( Series1.XValues.Last );
To convert from screen pixels to point values, use:
Var MyValue : Double ;
MyValue := Series1.YScreenToValue XE 'YScreenToValue' ( Y ) ;
(and XScreenToValue for horizontal co-ordinates).
You can query the point under a given pair of XY screen co-ordinates using the Series.Clicked function. (See Mouse Clicks chapter).
Chart.Canvas XE 'Canvas' is a standard Delphi Canvas.
You may control the appearance of your chart using Canvas properties. See TCanvas XE 'TCanvas help in
The following example divides the area of the backdrop of the Chart rectangle into 5 equal segments and colours them according to the colour array.
procedure TDrawForm.LineSeries1BeforeDrawValues(Sender: TObject);
Const
MyColors:array[1..5] of TColor=
( clNavy,
clGreen,
clYellow,
clRed,
$00000080
);
var t,partial:Longint;
tmpRect:TRect;
With Chart1 do
Begin
tmpRect:=ChartRect;
tmpRect.Right:=tmpRect.Left;
partial:=ChartWidth div 5;
Canvas.Brush.Style:=bsDiagCross;
Canvas.Pen.Style:=psClear;
for t:=1 to 5 do
Begin
tmpRect.Right:=tmpRect.Right+partial+1 ;
Canvas.Brush.Color:=MyColors[t];
With tmpRect do
Canvas.Rectangle( Left+Width3D,Top- Height3D,Right+Width3D,Bottom-Height3D );
tmpRect.Left:=tmpRect.Right;
end;
end;
end;
TChart components have an internal bitmap object, which is used when drawing as a hidden buffer. When drawing is finished, this buffer is copied to the screen video memory to display it.
TChart Canvas property returns the internal bitmap Canvas object.
Note: BufferedDisplay property controls if the internal bitmap is used. Using this bitmap no flicker occurs when redrawing real-time charts. Also, some Charts with many points can take advantage of faster drawing speed on memory bitmaps instead of direct drawing to slower video card memory chips.
Drawing to a bitmap Canvas is exactly the same as drawing to another real Canvas in terms of source code transparency and results.
Note: When drawing to a metafile or printing, the Chart Canvas property refers to metafile or printer Canvas objects. No bitmap is used in these cases.
After a Chart has been drawn onto the internal bitmap, and its copied onto the screen canvas, Chart Canvas property refers to the original real Chart Canvas.
You should call Chart1.Repaint or Series1.Repaint to force a Chart component to draw again.
Best place to custom draw over a Chart component is at
Chart1.OnAfterDraw XE 'OnAfterDraw event, which is fired each time the Chart component is redrawn, just before copying the internal bitmap to screen.
The equivalent of drawing before the Chart is drawn is to use a Series BeforeDrawValues XE 'BeforeDrawValues event, after Chart walls and background have been painted. (See UDRAW.PAS XE 'UDRAW.PAS' example unit).
Advanced: For more control you might want to create your own Chart class and override the several Draw virtual methods.
The biggest rectangle around a Chart is at ChartBounds XE 'ChartBounds property. ChartWidth XE 'ChartWidth ChartHeight XE 'ChartHeight ChartXCenter XE 'ChartXCenter and ChartYCenter XE 'ChartYCenter are pre-calculated co-ordinates based on ChartBounds property.
Axis are drawn inside this space. The ChartRect XE 'ChartRect property returns the bounding rectangle for Axis ( same in 2D and 3D ).
Chart Legend has the RectLegend public property which defines the Legend rectangle bounds.
Chart Title and Foot have TitleRect public properties.
In 3D Charts, each Series is assigned a specific section among the Z ( depth ) axis.
The Chart Width3D and Height3D are the dimensions of the
3D depth, in pixels. SeriesWidth3D and SeriesHeight3D are the dimensions for each individual Series in a Chart.
Lets start drawing XE 'drawing' with a basic example.
This code draws an horizontal line just at the middle of Chart1:
procedure TForm1.Chart1AfterDraw(Sender: TObject);
begin
With Chart1 do
begin
Canvas.Pen.Color:=clYellow;
Canvas.MoveTo( ChartBounds.Left,
ChartYCenter );
Canvas.LineTo( ChartBounds.Right, ChartYCenter );
end;
end;
Drawing inside Axis space:
procedure TForm1.Chart1AfterDraw(Sender: TObject);
begin
With Chart1 do
begin
Canvas.Pen.Color:=clYellow;
Canvas.MoveTo( ChartRect.Left, ChartYCenter );
Canvas.LineTo( ChartRect.Right, ChartYCenter );
end;
end;
Drawing a line at each point in Series1 :
procedure TForm1.Series1AfterDrawValues(Sender: TObject);
var t ,x,y : Longint ;
begin
for t := 0 to Series1.Count - 1 do
begin
x:=Series1.CalcXPos( t );
y:=Series1.CalcYPos( t );
Chart1.Canvas.MoveTo( x-8, y-8 );
Chart1.Canvas.LineTo( x+8, y+8 );
end;
end;
Note: Drawing Text
Always set Chart1.Canvas.Font.Height to a negative value
instead of using Font.Size if want same font sizes on screen
and on printer or metafiles.
See UHIGHLO.PAS and UDRAW.PAS units for example of custom drawing text.
Chart components have four axis: LeftAxis XE 'LeftAxis RightAxis XE 'RightAxis TopAxis XE 'TopAxis and BottomAxis XE 'BottomAxis . Each axis is an instance of TChartAxis XE 'TChartAxis' component class.
Axis are responsible of calculating pixel co-ordinates for Series points and to allow any valid range so scroll and zoom can be always performed. As new Series are inserted, or new points are added to the Series, Axis recalculate, by default, their Minimum and Maximum values.
You can turn off automatic recalculation of Axis XE 'Axis' scales by setting the Automatic property to false:
Chart1.LeftAxis.Automatic := False ;
Also, both the Axis Minimum and Axis Maximum values can optionally be independently automatic or not.
Chart1.LeftAxis.AutomaticMaximum := False ;
Chart1.LeftAxis.AutomaticMinimum := True ;
You can change Axis scales using the Minimum and Maximum properties:
With Chart1.LeftAxis do
begin
Automatic := False ;
Minimum:= 0 ;
Maximum:= 10000 ;
end;
or using the Axis SetMinMax method:
Chart1.LeftAxis.SetMinMax( 0, 10000 );
DateTime Axis
Note:
An Axis contains DateTime XE 'DateTime' scales when the associated Series components have XValues.DateTime or YValues.DateTime properties True. There is no DateTime property for Axis.
Changing scales in DateTime Axis is the same as for non-datetime values:
With Chart1.LeftAxis do
begin
Automatic := False ;
Minimum:= EncodeDate( 1990, 3,16 ) ;
Maximum:= EncodeDate( 1996, 5, 24 );
end;
Logarithmic Axis
An Axis can be to Logarithmic XE 'Logarithmic' only if Axis Minimum and Maximum are greater than or equal to zero. This is the only difference between setting linear and logarithmic scales.
Note:
Axis Labels are not displayed in logarithmic increments. You can generate custom Axis Labels (see chapter below).
Inverted Axis
An Axis can be Inverted so Axis Minimum and Maximum are swapped. We suggest you use Inverted XE 'Inverted' :=True as little as possible as it can give misleading results due to its (normally) rarity of use.
Axis Styles & Increment
Axis can be displayed in several ways, with tick lines or without,
with grids or without, with Labels or without, and you can customise all formatting properties such as colours, fonts and pen styles. The Axis Increment property controls the number of grid lines and labels and the distance between them.
By default its zero, meaning Axis will automatically calculate the Labels increment. Setting the Axis Increment property is independent of setting Axis scales. You can have automatic Axis Maximum and Minimum and a fixed Increment.
The Increment property grows automatically until all Axis Labels can be displayed. If you dont want this automatic feature, set the Axis LabelsSeparation XE 'LabelsSeparation' to zero:
Chart1.LeftAxis.LabelsSeparation := 0 ;
Warning:
When LabelsSeparation is zero, no checking is performed against
labels size, so you must take care labels will not overlap each other.
The following code sets the vertical Axis Increment to 30:
Series1.Clear;
Series1.AddArray( [ 20, 50, 120 ] );
Chart1.LeftAxis.Increment:= 30;
By default, the first Axis label starts at nearest Increment. Setting RoundFirstLabel to False makes labels to start at Axis Maximum:
Chart1.LeftAxis.RoundFirstLabel := False ;
DateTime Increment
Use the predefined DateTimeStep array of constants to determine the Axis Increment on DateTime axis:
Chart1.BottomAxis.Increment := DateTimeStep[ dtOneMonth ] ;
And set the ExactDateTime property to True if you want Axis Labels to be at exact datetime boundaries, for example at 1st day of month.
Chart1.BottomAxis.ExactDateTime := True;
Note:
Logarithmic axis use the Increment property as linear.
Grid lines
Axis Grid lines XE 'Grid lines' are displayed at each Increment position, or at each Axis Label position. The Axis TickOnLabelsOnly property controls this feature:
Chart1.BottomAxis.TickOnLabelsOnly := False ;
Axis Labels
There are several Axis labelling styles. The Axis LabelStyle XE 'LabelStyle property control axis labelling modes:
Chart1.BottomAxis.LabelStyle := talValue ;
Possible values are:
|
talValue |
Labels display Axis scales |
|
talMark |
Labels display Series Point Marks |
|
talText |
Labels display Series XLabels |
|
talNone |
No labels displayed |
|
talAuto |
Style is automatically calculated |
When LabelStyle is talText, TeeChart will set it automatically to talValue if Series have no XLabels.
For talMark and talText styles, axis labels are displayed exactly at Series point positions, thus not using the axis Increment property.
You can customise labels text by using the OnGetAxisLabel event:
procedure TForm1.Chart1GetAxisLabel(Sender: TChartAxis;
Series: TChartSeries; ValueIndex: Integer; var LabelText: String);
begin
if Sender=Chart1.LeftAxis then
if ValueIndex < 2 then LabelText := ;
end;
Advanced: The UAXISLAB.PAS example unit shows how to customise both Axis Labels text and position, using the OnGetNextAxisLabel XE 'OnGetNextAxisLabel event.
CustomDraw XE 'CustomDraw' adds more axis to your chart - As many as you wish. CustomDraw adds an axis as a copy of an existing axis at a new location.
The MULAXIS.PAS example unit draws two custom XE 'custom' t 'See Axis' XE 'Axis:custom' Axis inside a Chart. Available Axis methods for custom drawing are: CustomDraw and CustomDrawMinMax
The following example populates a line series with random data. And creates 2 additional axis. There are 3 configurable locations PosLabels XE 'PosLabels' t 'See CustomDraw' PosTitle XE 'PosTitle' t 'See CustomDraw' and PosAxis XE 'PosAxis' t 'See CustomDraw' to place, respectively, the labels, title and the axis. The last parameter, GridVisible XE 'GridVisible' t 'See CustomDraw' , which is boolean, defines whether to extend the axis grid to the new axis.
procedure TForm1.FormCreate(Sender: TObject);
var
t:integer;
begin
Series1.XValues.DateTime := False;
Chart1.BottomAxis.Increment:=0;
For t:= -10 to 10 do
Series1.addXY(t,Random(100),'', clTeeColor);
end;
procedure TForm1.Series1AfterDrawValues(Sender: TObject);
var posaxis,percent:longint;
begin
percent:=50;
With DBChart1 do
begin
PosAxis XE 'PosAxis' :=ChartRect.Left+Trunc(ChartWidth*Percent/100.0);
LeftAxis.CustomDraw(posaxis-10,posaxis-40,posaxis,True);
PosAxis:=ChartRect.Top+Trunc(ChartHeight*Percent/100.0);
BottomAxis.CustomDraw(posaxis+10,posaxis+40,posaxis,True);
end;
end;
This chapter documents how to manipulate Series and how to
manipulate Series points and other Series internal data.
Note: Advanced. Series and values code is mainly located at TEENGINE.PAS XE 'TEENGINE.PAS' unit.
Series can be created at runtime just as
like any other
First you need a Series variable:
Var MySeries : TBarSeries ;
MySeries := TBarSeries.Create( Self );
MySeries.ParentChart := Chart1 ;
Shortcut:
Chart1.AddSeries XE 'AddSeries' ( TBarSeries.Create( Self ) );
Var MyClass : TChartSeriesClass;
MyClass := TBarSeries ;
Chart1.AddSeries( MyClass.Create( Self ) );
Chart components store all Series in SeriesList property, a Delphi TList object.
You have read-only access to this list in three ways:
A) Using the SeriesList property:
MySeries := Chart1.SeriesList [ 0 ]
B) Using the Series array property:
MySeries := Chart1.Series [ 0 ]
C) Or using the Chart1 default property:
MySeries := Chart1 [ 0 ]
Either way does the same.
The Chart1.SeriesCount property returns the number of Series in SeriesList.
You can use SeriesCount to traverse all Chart Series:
for t := 0 to Chart1.SeriesCount - 1 do
With Chart1.Series [ t ] do
begin
SeriesColor := clBlue ;
end;
Series can be hidden in three ways:
A) Setting the Series Active property:
Series1.Active XE 'Series:Active' XE 'Active' := False ;
B) Removing the Series from their parent Chart:
Series1.ParentChart := nil;
C) Destroying the Series completely:
Series1.Free ;
In 3D mode (when Chart1.View3D is True ), all Series are assigned a Z order XE 'Z order' position. That is, the order where Series will be drawn, starting with the far most Series on the Chart 3D space.
You can control the order Series will be drawn, using these methods:
Chart1.ExchangeSeries( 0, 1 );
or
Chart1.SeriesUp( Series1 );
Chart1.SeriesDown( Series1 );
The Series.ZOrder integer property returns the corresponding Z position for the Series.
Some Series in certain modes share the same ZOrder, like Stacked BarSeries. You can check if more than one Series has the same Z order using these functions:
if Series1.FirstInZOrder then ..
if Series1.MoreSameZOrder then ..
Every Series type has, at least, 2 values for each point. These values are designed as X and Y point co-ordinates.
Note: Values are defined as Double floating point variables.
Extended Series types have more than 2 values, like BubbleSeries has X, Y and Radius values for each point.
So, each Series type has its appropriate method to add points, although the most common Series types like Line, Bar, Point and Area share the generic AddY method to add points.
The following code empties a TPieSeries and adds some sample values to it:
Series1.Clear ;
Series1.Add( 1234,
Series1.Add( 2001,
For extended Series types, please refer to each specific Series reference to know which method should be used to add points.
The Series AddArray method can be used in some situations:
Series3.Clear;
Series3.AddArray XE 'AddArray'
AddArray does not Clear the Series before adding points.
You can express points as constants or variables:
Series3.AddArray([ Table1Sales.AsFloat, 123, MyTotal ] );
In some circumstances you might have no values for specific points. You should then add these points as zero or add them as null XE 'null' values.
Null values will not be displayed, while zero values will be displayed as usual.
The following code adds several points and a null point:
With Series1 do
begin
Clear ;
AddY( 10, John, clGreen );
AddY( 20, Anne, clYellow );
AddY( 15, Thomas, clRed );
AddNull( Peter );
AddY( 25, Tony, clBlue );
AddY( 20, Mike, clLime );
end;
Each Series type will handle null values in different ways.
Bar, HorizBar, Line, Area and Point do not display null points.
PieSeries use null values as zero.
Points can be optionally sorted either by their X values or Y values. The Series.XValues and Series.YValues Order property controls the points Order:
Series1.XValues.Order := loAscending ;
Possible values are: loNone XE 'loNone loAscending XE 'loAscending or loDescending XE 'loDescending
By default, XValues Order is set to loAscending, and YValues Order to loNone, which means new added points are ordered by their X co-ordinate. For non XY charts, the X co-ordinate is always the point position, starting from zero.
The point Order is used by Series components to draw their points.
Note: Order must be set before points are added to the Series.
You can change the Order property at run-time, followed by a call to Sort method:
Example:
Drop a TChart onto a Form, add a Line Series.
Drop a TButton and assign this code to Button1Click:
Series1.AddArray([ 5, 2, 3, 9]);
Now drop another TButton and add this code to Button2Click:
With Series1 do
begin
YValues.Order:=loAscending;
YValues.Sort;
Repaint;
end;
Now execute and press Button1 to fill Series1, and press Button2 to see Series1 points drawn on Series1 YValues Ascending order, but having the original X co-ordinates.
Note: If you arent using X co-ordinates, one more line of code is required.
Drop a new TButton (Button3) and add this code to Button3Click:
Series1.XValues.FillSequence;
Series1.Repaint;
Now points will be re-numbered, starting from zero among Series1 XValues axis. This will re-order points so now they will be drawn as if they were originally added to the Series in their new order.
This two-step point sorting allows Line Series to draw with vertical orientation.
Adding X co-ordinates to points makes Series components calculate user specific horizontal point positions.
Note: Bar charts can be difficult to interpret with X co-ordinates.
Pie Series do not allow X co-ordinates.
To add X co-ordinates, simply use the AddXY XE 'AddXY method:
Drop a TChart, add a Point Series:
With Series1 do
begin
Clear ;
AddXY( 10, 10,
AddXY( 1, 10,
end;
Note: If you use a Bubble Series, use the TBubbleSeries AddBubble method.
Remember to set XValues.Order to loNone if dont want points to be sorted on their X co-ordinate.
16bits
Maximum 16380 Series per Chart, and 16380 points per Series.
32bits
Maximum 134217727 points per Series and same for Series per Chart.
Simply call the Series.Delete XE 'Series:Delete' method, passing the point index as the argument. Point index starts at zero.
Series1.Delete XE 'Delete' ( 0 );
Series1.Delete( Series1.Count - 1 ) ;
An exception List out of bounds will be raised when attempting to Delete a non-existing point, so always check there are enough points in the Series prior to delete them:
if Series1.Count > MyIndex then Series1.Delete( MyIndex );
Calling Delete forces re-calculation of Functions and repainting of the Chart.
Once points have been added, you can retrieve their co-ordinates or change them.
The XValues and YValues array properties can be used:
Var MyValue : Double ;
MyValue := Series1.YValues[ 0 ] ;
You can traverse these arrays to perform calculations:
Var MyTotal : Double ;
t : Integer ;
MyTotal := 0 ;
for t:= 0 to Series1.Count - 1 do
MyTotal := MyTotal + Series1.YValues[ t ] ;
ShowMessage( FloatToStr( MyTotal ) );
Extended Series types have additional array properties, such as
BubbleSeries RadiusValues. You can access these properties in
the same way as with XValues or YValues arrays:
if BubbleSeries1.RadiusValues XE 'RadiusValues' [ Index ] > 100 then ..
Modifying point values can be performed using the above properties:
Series1.YValues[ 0 ] := Series1.YValues[ 0 ] + 1 ;
Series1.RefreshSeries ;
The XValues and YValues Locate function searches a specific
value in the List and, if found, returns the value Index, starting
from zero.
Var MyIndex : Integer ;
MyIndex := Series1.YValues.Locate( 123 );
if MyIndex = -1 then
ShowMessage( 123 not found in Series1 !! )
else
ShowMessage( 123 is the +IntToStr( MyIndex+1 )+ th point in Series1 !! );
XValues and YValues properties maintain the following statistical figures:
Total The sum of all values in the list.
TotalABS The sum of all values as absolute (positive).
MaxValue The maximum value in the list.
MinValue The minimum value in the list.
You can call manually to RecalcMinMax XE 'RecalcMinMax method to recalculate MinValue XE 'MinValue' and MaxValue XE 'MaxValue' Total and TotalABS are maintained automatically.
These values are used to speed up several Axis scaling calculations and are used as helpers for percent calculations.
TChartValueList object has several other methods and properties to manipulate point values. Please refer to online help documentation.
Whenever points are added, deleted or modified, the Series generates internal notification events. These events are used to recalculate Series that depend on other Series points.
Advanced: You can use RecalcOptions XE 'RecalcOptions property to control when recalculations are performed.
All Series maintain an internal List of colour XE 'colour' s. One for each point in the Series.
You can access this list with ValueColor XE 'ValueColor array property, to retrieve or change point colours:
Var MyColor : TColor ;
MyColor := Series1.ValueColor[ 0 ] ;
Series1.ValueColor[ 1 ] := clBlue ;
TeeChart defines a generic colour constant named: clTeeColor.
Points with clTeeColor colour will be drawn using the SeriesColor colour.
Each point has an associated text, called XLabel XE 'XLabel , and
declared as a
Point Labels are used in Axis Labels, Chart Legend and Point Marks.
Labels are stored at Series XLabel array property.
You can access and modify XLabel point texts:
Series1.XLabel [ 0 ] := Sales ;
Every chart type corresponds to a different Delphi Component.
Changing a Series type involves changing the Series component class.
That means a new Series of the new class must be created, old Series properties should be assigned to the new instance, and finally the old Series must be destroyed.
All this happens automatically when you manually change a Series type at design-time using the Chart Editor Dialog and the Gallery.
You can change a Series type at run-time calling:
ChangeSeries XE 'ChangeSeries' TypeGallery(Self, MySeries );
Warning:
You should change your private Series components.
You can change also Series components owned by the Form,
but only if not using them after.
Var MySeries : TChartSeries ;
MySeries := Series1 ;
ChangeSeriesTypeGallery(Self, MySeries );
This chapter explains how Charts are printed and which properties and methods are used to control the printing process.
Note
Advanced. Printing methods are located in the CHART.PAS unit.
When printing XE 'printing' , you can specify which margins XE 'margins' t 'See printing' on the paper page should be left blank.
The public PrintMargins:TRect property stores the desired paper margins expressed as percents of total page dimensions.
PrintMargins:=Rect(15,15,15,15);
The TChart.ChartPrintRect:TRect function returns, after applying the printing margins, the space where the Chart component will be drawn expressed as logical canvas units (pixels or dots).
With PrintMargins you can define any area of any size inside the page.
Note
When changing paper orientation, margins are recalculated.
Charts are printed in metafile XE 'metafile' (WMF XE 'WMF' t 'See metafile' in 16bit, EMF XE 'EMF' t 'See metafile' in 32bit) format.
Metafiles are scaleable vector formats, so a wysiwyg XE 'wysiwyg' t 'See printing' effect can be achieved if sending to the printer how a Chart looks on screen. However, you might want to exploit the printers bigger resolution capabilities versus screen displays.
The TChart.PrintResolution integer property controls how a chart is scaled when sending it to the printer XE 'printer' t 'See printing' . By default PrintResolution is zero. Setting it to a negative value in the percentage range from zero to -100 makes the Chart proportionally bigger so theres more space for Axis Labels. Smaller fonts are used as they will be clearer on paper than on screen.
Setting it to a positive value makes font sizes bigger.
Several methods exist to print a Chart component:
Print;
PrintRect(Const R:TRect);
PrintOrientation(AOrientation:TPrinterOrientation);
PrintPortrait;
PrintLandscape;
All the above methods will do the same, print a Chart on a
new page and eject (form feed) the page:
Chart1.Print
Will print a Chart1 in the current printers paper orientation.
With PrintRect you can specify a custom Chart size and
location. The default location and size is determined by ChartPrintRect function, which applies PrintMargins margins.
Chart print methods.
More advanced printing control can be obtained using the following methods:
Procedure PrintPartial(Const PrinterRect:TRect);
Procedure PrintPartialCanvas( PrintCanvas:TCanvas;
Const PrinterRect:TRect);
Both will print a Chart component, BUT WILL NOT create
a new printer page or eject it. You can print both your own text and graphics and Chart components on the same paper page.
An example of PrintPartial XE 'PrintPartial' t 'See printing' method is located at BASIC.PAS unit under TeeDemo project.
Four Chart components are printed on a single page, optionally with more resolution.
Metafiles XE 'Metafiles' are very good as they are small and fast and scaleable.
Some limitations occur when using metafiles, as described in Microsoft Knowledge Base ( www.mskb.com ).
TeeChart inherits those limitations:
Clipping
Clipping XE 'Clipping' is stored in physical co-ordinates in metafiles. This means moving or scaling a clipped metafile will not scale or move the clipping region, giving undesirable results.
TeeChart does not draw partial points, so no clipping. Drawing on zoomed charts will probably show partial points outside the Chart axis.
Rounding circles
As metafiles can be scaled, circles will be converted to ellipses when scaling.
Rotating fonts
Rotated fonts XE 'fonts' can not be exactly aligned on non-proportionally scaled metafiles.
Dotted Pen styles and Pen Width
Non solid pen XE 'pen' s (dots, dashes), can be drawn as solid with scaled metafiles.
Scroll XE 'Scroll' ing and Zoom XE 'Zoom' ing a Chart is simply setting its Axis scales to the desired values. After zooming or scrolling a Chart, all Series will repaint their points in their new positions.
Note: Pie Series cant be scrolled or zoomed. You can control Pie dimensions using Chart margins or Pie custom radius properties.
Charts can be zoomed programmatically or by user interaction with mouse dragging. The Chart AllowZoom XE 'AllowZoom property controls if users can apply zoom:
Chart1.AllowZoom := True ;
Users can zoom drawing a rectangle around the Chart area they want to see in detail.
Note:
Dragging should be done from top / left to bottom down. Dragging in the opposite direction resets axis scales ( no zoom ).
You can decide which mouse button and / or keys must be pressed to draw the zoomed area rectangle. The following code uses global variables:
TeeZoomMouseButton := mbLeft ;
TeeZoomKeyShift := [ ssShift ] ;
As soon as users release the mouse button, TeeChart repaints to show the zoomed area.
You can control if TeeChart will calculate zoom positions immediately or it will be calculating zoom in short steps until reaching the desired zoom window.
This makes an animated zoom effect, which helps to identify better the zoomed area. This code activates animated zoom:
Chart1.AnimatedZoom:= True ;
Set the AnimatedZoomSteps XE 'AnimatedZoomSteps property to the desired number of intermediate zooms:
Chart1.AnimatedZoomSteps:= 5 ;
Advanced:
You can control how linear the animated zoom steps are, using the global variable AnimatedZoomFactor XE 'AnimatedZoomFactor , from 1 to n:
AnimatedZoomFactor:=2.0;
You can zoom in or zoom out a Chart using any of these methods:
ZoomRect XE 'ZoomRect adjusts axis scales to show the TRect parameter area. The rectangle is expressed in screen pixel co-ordinates. Rectangle areas inside Chart1.ChartRect rectangle will zoom in, while area outside ChartRect will zoom out.
Chart1.ZoomRect( Rect( 100, 100, 200, 200 ) );
ZoomPercent XE 'ZoomPercent sets Chart zoom to a percentual value. This example sets Zoom to 110 % percent to zoom in :
Chart1.ZoomPercent( 110 );
To reset zoom:
Chart1.ZoomPercent( 100 );
The above methods work independently, you can use both
at the same time.
The UndoZoom method resets axis scales to their automatic Minimum and Maximum values:
Chart1.UndoZoom;
This will display all Series points, undoing any previous zoom in or zoom out operation, either by code or using the mouse.
Note:
If you want axis scales to be at specific values after undoing zoom, you can use the Chart OnUndoZoom event, documented below.
The Zoomed boolean property returns if all four Chart Axis are automatic or not. If not Chart1.Zoomed then Chart1.ZoomPercent( 150 );
The OnZoom XE 'OnZoom event is triggered whenever zoom is applied to a Chart, either manually or programmatically:
procedure TForm1.Chart1Zoom(Sender: TObject);
begin
Button1.Visible:=True ;
end;
The OnUndoZoom event is called when undoing zoom, by code or by mouse.
Scrolling XE 'Scrolling' is very similar to zoom. Axis scales are incremented or decremented and the whole chart component is repainted to show Series points at their new positions.
The Chart AllowPanning XE 'AllowPanning property controls if users can scroll Chart contents by dragging the mouse. Its possible values are:
pmNone No scroll is allowed.
pmHorizontal,
pmVertical Allow scroll only on these directions.
pmBoth Allow complete scroll over all
directions.
Example:
Chart1.AllowPanning := pmNone ;
Like Zoom, the following global variables control mouse and keyboard requirements to start scrolling:
TeeScrollMouseButton := mbRight;
TeeScrollKeyShift : [ ssCtrl ];
You can programmatically scroll a chart, using the Axis Scroll method:
Procedure Scroll(Const Offset:Double;
CheckLimits:Boolean);
Example:
Chart1.BottomAxis.Scroll( 1000, True );
The above code increments BottomAxis scales by 1000. This is the same as doing:
With Chart1.BottomAxis do SetMinMax( Minimum+1000, Maximum+1000 );
and setting BottomAxis XE 'BottomAxis' Automatic property to False.
The Chart will repaint and the horizontal bottom axis will be scrolled to the left a quantity of 1000 in axis scales.
The CheckLimits XE 'CheckLimits boolean parameter instructs the axis to scroll ONLY if there are more Series points in the scrolling direction.
The Chart OnScroll event is fired every time users scroll manually the Chart.
procedure TForm1.Chart1Scroll(Sender: TObject);
begin
Label1.Caption := This chart has scrolled ! ;
end;
The OnAllowScroll XE 'OnAllowScroll event can be used to programmatically accept or refuse a planned scroll:
procedure TForm1.Chart1AllowScroll(Sender: TChartAxis; var AMin,
AMax: Double; var AllowScroll: Boolean);
begin
if Sender = Chart1.BottomAxis then
if AMax > 1000 then AllowScroll := False ;
end;
The above code refuses user scrolling if attempting to set
bottom axis maximum to a value greater than 1000. The same checking can be performed over the DateTime axis:
if Sender = Chart1.BottomAxis then
if AMax > EncodeDate( 1997, 12, 31 ) then AllowScroll := False ;
The UKEYBOA.PAS example unit shows how to use the Form
OnKeyDown XE 'OnKeyDown event and scroll when pressing the arrow keys.
First, the Form KeyPreview XE 'KeyPreview' property should be set to True.
At the KeyDown event, and depending on the pressed arrow key,
the four Chart axis are scrolled using the Axis Scroll method.
The example also uses ZoomPercent and UndoZoom methods.
Two big rules apply to speed performance XE 'performance' in real-time charting:
1. Plot as few points as possible
2. Use the fast XE 'fast' est possible hardware.
Together, these two rules really make a big speed difference when drawing charts many times continuously.
Some other suggestions are:
Use 2D. Three dimensional charts are slower to paint than 2D.
Make Charts small. Bigger charts need more pixels to be filled.
Remove Chart Legend and Titles when possible.
Use default fonts and font sizes.
Use FastLineSeries for fastest way to plot many points.
Use solid pens and brushes styles.
Avoid using circular shapes or circular bar styles.
Dont use background bitmaps or gradient fill effects.
Set Chart BevelInner and BevelOuter properties to bvNone
When possible, set Chart1.AxisVisible to False to remove axis.
Set your video mode resolution and colour depth to the optimum values, according to your video card.
A combination of 800x600 x 256 colours can be faster than 1024x768 x 32k colours, on average video cards.
Use Windows 95 or Windows NT with accelerated drivers for your video card.
This public property controls how Charts are internally drawn. When True, the default, Charts are drawn into an internal hidden bitmap. When drawing is finished, this internal bitmap is transferred to the screen in one single operation. The result is non-flickering animation.
In some circumstances, setting BufferedDisplay to False can accelerate chart redrawing. It depends on CPU and video card speed, and on the number of points plotted.
The bad news is that drawing directly to screen produces flickering, but can be helpful for really heavy redrawing applications.
The UFAST.PAS XE 'UFAST.PAS' example unit can be used as a benchmark for testing drawing speed times. Remember to use exactly the same data values in your tests with your real charts. Use always the same number of points and the same point values when comparing speed results. Run the tests many times to obtain a fair statistical result and restart completely between tests.
TeeChart 3 runtime version has 7 available functions:
Add
Subtract
Multiply
Divide
Average
High
Low
See the earlier section, Functions , for a detailed description of each of what each function does.
Functions may be added using the Chart editor at design time. Similarly to adding a series you may use the TeeChart Gallery to choose the function. In the Gallery all functions are initially displayed as LineSeries functions - you may change series type after initially adding the function.
When you have added the function go to the DataSource tab of the Series page. Here you may choose which input series (or series) to add to the function. The first series in the selected listbox, reading from top to bottom, is the series on which the operation is performed in the case of function which doesnt treat each member of the list homogeneously.
Eg. Subtract XE 'Subtract'
|
Fig. STYLEREF 1 n SEQ Fig. * ARABIC r 1 Subtract function defined in the Chart editor |
|
In the Chart editor screen you see Series3 being defined with inputs Series1 and Series2. The Series order in the list defines which series is doing the subtraction.
Here: Series3:= Series1 - Series2
Alternatively you may delete the series you have added as carrier for the function (delete series from the first page of the Chart editor) or you may redefine the series as having a different datasource in the DataSource tab of the series page.
The option to change the FunctionType is in the DataSource tab of the series page for the function series. The drop down combobox contains a list of all function types - You may choose any from the list. Copy will directly copy the input Series (duplicating the series).
Function is a component. When you add a new function you are adding a series, defining a new function and setting it as FunctionType XE 'FunctionType for the series.
Series1.SetFunction(TAddTeeFunction.Create(Self));
See the online help for a description of how to add each of the different types of function. Each function uses the same series method, SetFunction XE 'SetFunction
To delete a function from a series either delete the series or use the SetFunction method to de-allocate the connection between the series and the Function.
Series1.SetFunction(nil);
You may find the Period XE 'Period property extremely useful when working with functions. It is used to define the frequency for which the function re-calculates.
Example
We have 6 data points (eg. bars of a Bar Series) with values:
3, 8, 6, 2, 9 and 12
We define a function series with Period 0 (default when only one series is input to the Function) the average drawn is:
6.667
With Period set to 2 we get 3 values of average as output from the function:
5.5, 4 and 10.5
These values will plot centrally in their period range, ie. The 1st value between bars 1 and 2 of the input series, 2nd value between bars 3 and 4, etc..
You may define Period by selecting the function in the Object Inspector or you may modify Period at runtime using FunctionType
Eg. Where Series 2 is the function series:
Series2.FunctionType.Period:=2
How can we best navigate in the Chart Editor? - We hope you find the Chart Editor reasonably intuitive. For all configuration relating to the chart and not specific to a particular series got to the Chart page of the Chart Editor. For any parameters that apply specifically to a Series go to the Series page where you may select the series from a drop-down combo box. Selecting a series activates the series definition tab pages to the parameters of that series.
Each Page of the Chart Editor has several tabs that contain the configuration parameters of the page. Each tab groups like parameters, for example parameters that apply to axis format are grouped together on the axis tab of the Chart page.
Series, Functions and Charts are distinct components. You can find all listed in the Object Inspector. Each series is listed with its own list of properties. Some not so commonly used chart and series properties are not available in the Chart Editor, the list is simply too long to get all into the Editor interface. You may use the Object Inspector to access any properties not visible in the Chart Editor. Use Online help too, as a guide.
Index
INDEX c '2'
% Separation. See Separation
ACanvas. See Canvas
Active, 69
Add, 50
AddArray, 70
AddPoint, 25
AddSeries, 68
AddXY, 71
AllowPanning, 79
AllowZoom, 31; 77
AnimatedZoomFactor, 78
AnimatedZoomSteps, 78
Area series, 39
arrow, 41
Automatic
average, 54
axis, 28; 30; 58; 64
custom, 66
labels, 30
bar, 36
barstyle, 36
BDE, 28
BeforeDrawValues, 62
BMP
BottomAxis
Bubble, 41
BufferedDisplay, 81
CalcPosPoint, 59
CalcPosValue, 59; 60
CalcSizeValue, 59
CalcXPos, 59; 60
CalcXPosValue, 31
CalcYPos, 59
CalcYPosValue, 31
candle, 46
candle series, 46
Canvas, 28; 61
ClickSeries. See OnClickSeries
ClientDataset, 32
Clipping, 76
CloseValues, 46
colour, 74
Creating. See series
custom. See Axis
custom drawing, 58
CustomDraw, 66
ChangeSeries, 74
ChartBounds, 59; 62
ChartHeight, 62
ChartRect, 59; 62
ChartWidth, 62
ChartXCenter, 62
ChartYCenter, 62
CheckLimits, 80
Data Source. See Datasource
Database, 28. See Datasource
Dataset, 32. See datasource
DataSource, 21; 32
DateTime, 64
DateValues, 46
Delete, 72
Desired increment
divide, 53
draw, 58
drawing, 63
Editpro
EMF. See metafile
Error Series, 47
events, 57
Extended series, 46
Candle, 46
Error bar, 47
Polar, 48
Volume, 47
fast, 80
Fast line, 35
fonts, 77
function
Adding, 82
coding, 83
Changing, 82
Deleting, 82
Functions, 50
Add, 50
average, 54
divide, 53
High, 53
Low, 54
multiply, 52
period, 51
Subtract, 52
FunctionType, 83
GetCursorValueIndex, 57
Grid lines, 66
GridVisible. See CustomDraw
High, 53
HighValues, 46
horizontal bar, 39
increment
Inverted, 65
KeyPreview, 80
Labels, 23. See axis
LabelsSeparation, 65
LabelStyle, 66
LeftAxis
Legend, 28
Line, 35
loAscending, 70
loDescending, 70
Logarithmic, 64
loNone, 70
Low, 54
LowValues, 46
margins. See printing
MaxValue, 73
Metafile
Metafiles, 76
minor
MinValue, 73
Multi Bar
multiply, 52
null, 70
Null Values, 70
OnAfterDraw, 62
OnAllowScroll, 80
OnClick, 57; 58
OnClickSeries, 57
OnGetNextAxisLabel, 66
OnKeyDown, 80
OnZoom, 79
OpenValues, 46
Paging, 37
ParentChart, 28; 37
pen, 77
performance, 80
period, 51; 83
Pie, 21; 22
Pie series, 40
pixels, 58
Point, 58
Point series, 40
polar series, 48
PosAxis, 67. See CustomDraw
PosLabels. See CustomDraw
PosTitle. See CustomDraw
printer. See printing
printing, 75
PrintPartial. See printing
properties, 35
QRChart, 49
QuickReport, 49
QuickReports, 30
Qusoft, 49
RadiusValues, 73
random, 37
RecalcMinMax, 73
RecalcOptions, 73
RightAxis
royalties, 7
Scroll, 77
ScrollForm
Scrolling, 79
separation, 30
Series
Active, 69
Creating, 67
Delete, 72
Serieslist, 37
SetFunction, 83
shapes, 58
Speed, 80
SQL. See TQuery
Stacked
stairs, 35
subcomponent, 30
subcomponents, 28
Subtract, 52; 82
Table, 21
TCanvas, 61. See Canvas
TClientDataset, 15; 32
TCustomChart, 15
TChart, 15; 32
TChartAxis, 64
TChartSeries, 35
Area, 39
Arrow, 41
Bar, 36
Bubble, 41
Fast Line, 35
Gantt, 42
Horizontal bar, 39
Line, 35
Pie, 40
Point, 40
Shape, 43
TDatasource, 21
TDBChart, 15; 21; 32
TDBGrid, 21
TeeChart Pro
TeeDefaultCapacity, 35
TEEDEMO
TEENGINE.PAS, 67
ticks
Titles, 36
TOHLCSeries, 46
TopAxis
TQRChart, 49
TQRDBChart, 15
TQuery, 32
TTable, 21; 32
UDRAW.PAS, 28; 58; 62
UFAST.PAS, 81
Uhighlo.pas
ValueColor, 74
valueindex. See OnClickSeries
volume series, 47
WMF. See metafile
wysiwyg. See printing
X Values
XLabel, 74
Y value
YScreenToValue, 60
YValues, 25
Z order, 58; 69
zoom, 30; 77
ZoomPercent, 78
ZoomRect, 31; 78


Thank You and Good TeeCharting !!!
David Berneda
TeeChart for Borland Delphi Compilers.

![]()
Gran Via, 533
08011 Barcelona
email: teechart@redestb.es
email: 101600.1067@compuserve.com
www: https://ourworld.compuserve.com/homepages/dberneda
TeeChart Pro is the commercially available version of TeeChart. It contains many more features, multiple Delphi version support and 100% of its own source code. For more information see About TeeChart by right-clicking on your TChart in Delphi at design time or check with the TeeChart Pro section in the introduction of this manual.
|
Politica de confidentialitate | Termeni si conditii de utilizare |

Vizualizari: 5718
Importanta: ![]()
Termeni si conditii de utilizare | Contact
© SCRIGROUP 2024 . All rights reserved