| CATEGORII DOCUMENTE |
| Asp | Autocad | C | Dot net | Excel | Fox pro | Html | Java |
| Linux | Mathcad | Photoshop | Php | Sql | Visual studio | Windows | Xml |
DOCUMENTE SIMILARE |
|||||
|
|||||
Output: The Report and Label Designers
I wish I had a nickel for every time I've repeated the adage that people generally don't put data into an application simply to have it there-they eventually want it back out at some point. And that's the topic of this chapter: getting data back out of a database. More specifically, using Visual FoxPro's Report and Label Designers.
The Report Designer and Label Designer are Visual FoxPro's tools for creating output and sending it to the screen, printer, or a file. As with the Menu Designer, you can automate part of the creation process by using the Quick Report feature. Furthermore, Visual FoxPro contains an additional pair of tools, the Report Wizard and the Label Wizard, that can design and produce a wide range of reports and labels. In fact, upon investigating the Wizards, you might feel you could skip the rest of this chapter; depending upon your specific needs, you might well be able to. Nonetheless, I'll discuss the Report Designer and Label Designer in the same depth as the other Visual FoxPro tools, so if you need to create more complex output, you'll have the wherewithal to do so.
The Report Designer and Label Designer work the same way in most instances, so I'll focus on the Report Designer for the bulk of this chapter, and then mention differences or additional capabilities germane to the Label Designer where appropriate.
Quick start to building reports
In most of the other chapters in this section, I've taken a step-by-step approach, showing you how to quickly and easily build a simple widget of one sort or another, and then getting into the nuts and bolts of the tool once you've seen what the final product should look like. This "quick start" will be slightly different, because there are two different philosophies regarding the creation of a report. I'll discuss each position and why I think one is superior, and then I'll explain how to proceed along those lines.
Report terminology
Before I get into building reports, I should discuss their key terms and how they are structured.
The simplest report is a tabular listing that looks like a Browse window-multiple rows with one or more columns that don't even fill a page. The data can come from one table or multiple tables; for the time being, I'll assume there's no difference. Each time a "row" from the Browse window prints, it's called a detail row. Unlike a Browse window, however, you can print data from a row on more than one line-which is handy if you've got so much data that you can't fit it on a single line.
If the report spills onto multiple pages, you're probably going to want to display some information on every page. If this information is at the top of the page, it's called a header; if it's at the bottom, it's called a footer. This information might be "dumb" data, such as column headings, the date of the report, or the page number. But it might also be intelligent, such as a running total or other calculated values.
Once your report spans enough pages, you might find that you want a cover for your report, just like the fancy report you did for your 11th-grade civics class. You might also want a page at the end that summarizes the information in the report. These pages are called title and summary pages, and they can be printed as completely separate pages for your report. In some cases, however, you might find that while you need some information printed only once at the beginning or end of your report, you don't need it on a completely separate page.
Having a long report with pages and pages of data isn't always as useful as it could be by itself-often you'll want to break down the report into logical groupings. For example, in a report of club members, you might want to go beyond simply alphabetizing the members, and provide a break each time the first letter of the last name changes. Or perhaps you want to categorize members according to some criteria: "Full-Time" members in one group, "Associate Members" in a second, "Junior Members" in a third, and "Out-Of-State Members" in yet a fourth group. Within each of these groups, you would still alphabetize them by name, of course.
Each of these groups is called, funny enough, a group, and can simply print one after another, or each group can start on its own page. Furthermore, you can print some sort of information at the beginning of the group or at the end. For example, you might want to print the name of the group along with some descriptive information at the beginning of the group, and then print the total number of members of the group along with some other calculated information, such as total donations for the year, at the end of the group listing. These sections would be called group headers and group footers, and they'd act similarly to page headers and footers, except, of course, they print only with respect to a group.
There can be one or more levels of groups-imagine if the aforementioned club directory was grouped first by state of residence, and then by Member Type within each state.
To-may-to or tuh-mah-to?
In the client-server world, there's an age-old discussion regarding whether to put validation rules on the server or in the user interface. The argument for server-based validation revolves around the idea that it's a centralized, foolproof place for rules that will prevent garbage from getting into the database. The opposite position is based on the theory that by the time bad data gets to the server to be validated, it's too late to send useful messages back to the user. I won't argue this conundrum here, but I offer it to serve as a reference point for another argument: how to structure and process reports.
A typical report writer, Visual FoxPro's included, contains much more functionality than that which is simply needed for printing information from a table. Indeed, not only can one format data, set attributes for fields regarding whether and when to print, but one also can do calculations and logical manipulations of data according to the location on the report and its relation to other data. You can even write code that will fire off at certain times during the processing of a report!
The argument, then, revolves around whether or not to use all of this functionality. The justification for doing so is that it provides a great deal of power and flexibility, often fairly easily. The downside, the naysayers argue, is that testing and debugging, as well as future maintenance and modification, become significantly harder. And while it's not much fun debugging a problem anywhere in an application, trying to figure out why the group subtotal on page 4 is always off by a nickel is as unrewarding as any debugging task a programmer can face.
Dumbing down the Report Writer
I can hear you asking, "So if you're not going to perform all sorts of fancy tricks with the Report Writer, what's the alternative?" Here's the right way, in my not-so-humble opinion, to build reports for use in Visual FoxPro.
First, build a denormalized cursor that represents the entire data set you want to print- grouped and sorted as it should print out. Then use the Report Writer to simply print that report, much like you use a Mask property to display a value in a certain way. No calculations, no tricks, no fancy methods firing here and there.
It isn't always exactly this easy; if you're trying to print images, or you need to format values in specific ways, you'll probably have to get into the Report Writer to some extent. But use those requirements as the exception, not the rule.
Why am I so adamant about this? Because, as with everything computer-related, requirements always become more demanding. When was the last time you had a user or a customer ask to "get rid of a bunch of functionality"? When did they try to make your life simpler? That's right, requirements always get more demanding. Even the simplest report ends up having this gizmo and that widget added on, and suddenly what was fairly straightforward ends up looking like a contraption from a mad scientist's laboratory.
The problem with this is that there isn't any easy way to document any of the work done in the Report Writer itself. Suppose you create a complex expression that prints one value in one situation, a second value another time, and yet a third value if two other conditions are met. If you were displaying this value on a form, you'd be able to write comments somewhere in the form that describe what you did, how you did it, and why. But there's no place in a report to do that.
As a result, if you do all the processing of the report's data in code, you can document the same decisions and explanations, and then simply print the results. When the report comes out wrong, you can take a snapshot of the cursor and debug your code-which you know how to do. You don't have to delve into some arcane magic in the Report Writer that you put together months ago.
Furthermore, when it comes time to output that same data to another format-perhaps a different report writer that has additional functionality, or to a different output target, such as a spreadsheet or another database file format-you'll have virtually all of the data in place. If you had done a lot of the calculations and logical decisions in the report form itself, you'd end up rewriting all that again so you could send the results elsewhere.
How about an example?
This might be one of those places where an example would help visualize what I'm talking about. Suppose you're using the Report Writer to print an invoice. You could set up a series of relations between the Customer, Invoice Header, Invoice Detail, Product, and Vendor tables, and then roll through this set of joins. Problems arise when there isn't a match in one of the joins-for example, if one of the Products identified in the Invoice Detail is missing from the Product table. Or when the calculated subtotals for the Product Lines on the invoice don't match the grand total. Or there might be a set of complex rules about when certain attributes of specific products get printed. Perhaps a certain item gets taxed in one jurisdiction, but not in another. Certain Product Lines require footnotes or installation remarks. Distributors require unit and extended prices, while walk-in customers just get extended. And so on . you've all run into those rules that seem designed just to make your life as a programmer tougher.
Instead of coding the logic for each of these rules into the report form-where they have to be maintained, and duplicated when another similar invoice form is designed-put the logic in the code that generates the cursor that feeds the report.
First, create a SQL SELECT statement that creates a row for each item detail in the invoice (or set of invoices). In this row, you'll also have the data that goes into the Invoice Header, including Invoice Number, Invoice Date, and Customer Purchase Order Number, but also Invoice Header data from other tables, such as Customer Name, Billing Address, and so on. Because the Invoice Detail record most likely had a foreign key to the Product table (which in turn had a foreign key that pointed to the Vendor table), you'll need to grab the appropriate data, such as Vendor Name (or at least Abbreviation), Product Number (and Description), and perhaps a Gross Unit Price for the item as well.
You can do calculations in this SELECT, extending purchased quantities into extended totals based on Gross and/or Net Prices. At this point, you might calculate several extended prices, based on different conditions such as whether or not the customer pays tax, freight, installation costs, or a variety of other factors.
For example, suppose that, when ordering, the customer gets 10% off a specific item if they present a certain coupon or recite a jingle from the local soft-rock radio station, and they get 15% off if they do both (okay, that's kind of a silly promotion, but then, think about it.). Whether or not they do so is recorded in a logical field in the Invoice Detail table. When calculating the Invoice, you could have a Unit Price field on the invoice report that contained the expression:
nAmtUnit * iif(lSangJingle and lHadCoupon, ;0.85, ; )iif(lSangJingle or lHadCoupon, 0.90, 1.00) ;
But, well, blech. What if business conditions changed, or (more likely) management changed its mind and suddenly you had to change this rule? Or what if your invoices weren't cross-footing properly? Trying to debug this expression while running the report would be a real pain.
Better, then, to include the following columns in your SQL SELECT statement:
nAmtUnit lSangJinglelHadCouponnMultiplierPercentagenAmtDiscount
where:
nMultiplierPercentage = ;iif(lSangJingle and lHadCoupon, ;0.85, ; )iif(lSangJingle or lHadCoupon, 0.90, 1.00);
and then:
nAmtDiscount = nAmtUnit * nMultiplierPercentage
The nMultiplierPercentage value, instead of being stored deep inside the Report Writer, is in the code, where it's easy to find and debug.
If you ran into problems using the first method, you'd have to test for (1) bad data in the tables, (2) a bad relation joining some of the tables, (3) a bad formula in the report, or (4) some other hidden factor. Because all of the relevant data is in the result set gathered by the SQL SELECT statement, you'd have a much easier time debugging. And because you're gathering only a small set of data, you don't have to worry about performance-the result set is typically only going to be a handful of records, or a few hundred at most.
You can make multiple passes against this result set if you like. For example, what if you needed subtotals? Those are pretty easy to do in the Report Writer, as you'll see shortly. But often subtotals are needed not only after the end of the group, but during printing-and sometimes before the group is printed.
For example, the stated format of the invoice requires including the Product Line subtotal at the beginning of the group of items for that Product Line. This is impossible to do under normal circumstances, but if you've included a SUM() expression in your SELECT, the subtotal is available there for you as you begin running the report.
For more complex requirements, you can simply SCAN through the records in the result set and calculate additional data on the fly or stuff empty columns that you put in the SELECT for just that purpose. Because you've got a paucity of records in the result set, Visual FoxPro will handle this type of processing in the blink of an eye. Then again, you simply have to print out pre-calculated data and, as I mentioned earlier, it's much easier to make changes and debug.
An additional advantage to this mechanism is that you can include non-data-source information in your report quickly and easily. For example, suppose the user entered some data, such as a user-specified report heading, into a form that launched the report. You can capture this data from the form, stuff it into the cursor, and then print that information as needed just as if it were another data field. Normally, you'd have to mess around with report variables or some other nonsense, worrying about initializing it, making the value change when needed, scoping the variable properly so it's visible to the report, as well as the standard headaches involving debugging and future maintenance. You don't need all that.
Up close with the Report Designer
Using the Report Designer involves a number of tools: the Report Designer window itself, several toolbars, the Data Environment window, and the Properties window. In addition, the menu changes according to which window is active and which function is being executed. I'll examine them one by one.
The Report Designer window
You can open the Report Designer in one of several ways:
. . Open the File menu and click New, Report, and then New File.
. . Enter the command CREATE REPORT in the Command window.
. . Select the Reports object in the Project Manager window and then click the New button.
In any case, the Report Designer window appears as shown in Figure 11.1.
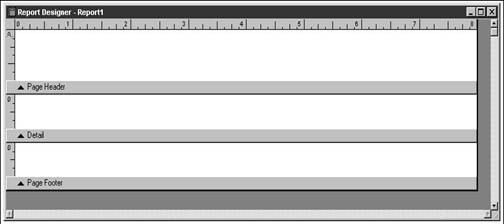
The empty Report Designer window features three bands by default, each identified by a gray bar underneath the band itself. The most critical concept to understand about reporting is how these bands work. In succinct terms, a report form is run against a table, and the report form, in its entirety, is evaluated as each record in the table is processed. You place objects in each band, and then those contents are printed at specific times and for specific reasons according to the type of band and attributes set for the object.
Mastering the rules of "which band is printed when" will enable you to use the Report Designer to produce, in concert with the appropriate underlying table, any type of report you require. In addition to the three bands you see in an empty report, there are four more: the Group Header and Footer, and the Title and Summary bands. In short, here are the rules for each band:
�.. The contents of the Detail band are printed once for each record in the underlying table.
�.This means you can place several rows of fields in the Detail band, and they will all be printed for each row in the table that is driving the report. In fact, you could make the Detail band the size of a full sheet of paper, and thus end up printing one page for each record. This would be handy if you wanted to print invoices, for example, or membership renewal forms. You would simply have one record for each invoice or member, and then print a "report"-instead of laboriously hand-coding a full-page document like in the old days.
. . The contents of the Page Header band are printed once each time a new page is started.
�.. The contents of the Page Footer band are printed once each time a page is completed.
�.Most often, these bands are used to carry information from one page to the next, such as page numbers, dates, and report headings. But you can also use them to print column headings or column footers. With a little bit of ingenuity, you could even print fields that change according to the data on the page, such as the first and last name on a page in a directory.
. . The contents of the Group Header band are printed each time the expression upon which the group is based changes.
�.. The contents of the Group Footer band are printed each time the group of records that belongs to a group has finished printing.
�.Read the wording of these two sections very carefully. When you use groups in a report, it's not enough to simply create a group expression and its associated band. You'll also need to sort the report's data set so it's in order according to the group expressions. For example, if you were grouping a sales report by Sales Region, and then by Sales Rep within Sales Region, you would want to make sure the results were sorted on Sales Region, and then by Sales Rep within Sales Region.
. . The contents of the Title band print at the very beginning of the report.
. . The contents of the Summary band print at the very end of the report.
Once you've created a report (I'm assuming you've created a report or two with the Wizard in your spare time), it's likely that you're going to want to change the contents of the various bands. The contents are called controls, although this term includes any object that can be placed on a report, including text labels and boxes. The following sections describe how to perform the most common tasks.
Select a control
Click on the control so the eight black sizing boxes at the corners and in the middle of each side appear.
Select a group of controls
Click on a control and then, while holding down the Shift key, select additional controls; or position the mouse pointer outside all controls, and then click and drag the mouse pointer so that it at least partially overlaps the controls desired. The dotted line that appears is called a marquee (because it flashes like the lights that surround a movie sign). You can then deselect individual controls by holding down the Shift key and clicking on the control in question. Once you've selected a group of controls (by using either method), most actions that can be performed on a single control (such as moving, duplicating, resizing, and changing font) can also be performed on the group.
Move a control within a report
Select and drag the control to its desired location. This works across bands as well as within a band. You can also use the cursor keys to nudge a control a pixel or two when dragging doesn't provide discrete enough resolution.
Move a control from one report to another
Select the control and use Edit, Cut to remove it from the original report. Select the second report and use Edit, Paste to place the control on it.
Duplicate a control
Select the control and use Edit, Copy and Edit, Paste (or the Ctrl+C and Ctrl+V key combinations) to make a copy. Then move the new copy of the control to its desired location.
Resize a control
Select the control and use the sizing handles to resize it as desired. You can also use Shift and a cursor key to resize by small amounts when dragging doesn't provide discrete enough resolution.
Delete a control
Select the control and press the Delete key. Note that Delete does not place the control on the clipboard like Cut and Copy do. However, you can recover a control erroneously deleted (or a group of controls deleted in one step) by selecting the Edit, Undo menu option.
Change the font or other attributes of a control
Select the control and use the appropriate menu option in the Format menu. The attributes available depend on which type of control is selected. For example, you can't change the Font of a line.
Resize a band
Place the mouse in the gray bar underneath the band, and drag it in the direction to be sized. If you can't make a band smaller by dragging, a control in the band is in the way. The control might not be visible if the width of the report form is wider than the current window, if the control is a single line with no thickness (hard to see), or if the control is the same color as the report background (impossible to see). To hunt these down, expand the band and then try to lasso hidden controls starting around the edges of the band to "scoop up" open areas to find the bothersome controls.
The Report Controls toolbar
So far I've shown you how to change the external attributes of one or more controls, but I've not said anything about modifying the internal properties of a control-the contents of a field or the text in a label. As with the Form Designer, Visual FoxPro has provided a toolbar to facilitate these tasks. Select the Report Controls toolbar from the View menu to display it.
There are six types of controls that can be placed on a report form. These are (in order of appearance on the toolbar) labels (simple strings of text), fields and expressions, lines, boxes, circles and ovals, and pictures. You select the appropriate icon from the toolbar to create it. With the exception of text, you can modify a control just by double-clicking on it.
The following sections describe how to perform the most common tasks using the Report Controls toolbar.
Change the text of a label
Select the text icon (the letter A) and then click on the label. The cursor will change to an "insertion point" much like in a word processor. You can then type text (in insert or overwrite mode), backspace, and delete.
Change the internal properties of a control
Select the control and either double-click or right-click and select the Properties menu option from the context menu. In either case, the resulting dialog will allow you to edit the internal properties specific to that control.
Create a control
Select the appropriate icon for the type of control to be created and then draw the control on the report form (select a point and drag the mouse until the control is laid out as desired). If you're creating a Field control, the Properties dialog will appear so you can specify the expression and other information. You'll have to bring up the Properties dialog for other controls yourself.
Notice that the icon you select when creating a control "pops out" once you've created the control. If you are going to create more than one of the same type of control, this is a nuisance. You can keep the icon "pushed in" by selecting the last icon in the toolbar-the button lock- or by double-clicking on the icon. Release the button lock by clicking on it again or by selecting the arrow icon. Selecting the arrow icon also will release any other icon that was pushed by mistake.
The Layout Controls toolbar
As you work with controls inside a report, you'll find yourself repeating some tasks over and over. Visual FoxPro has shortcuts to a number of these common tasks, including aligning and resizing controls. These are located on the Layout toolbar, which is accessible from the View menu. (This is the same toolbar used with the Form Designer.)
The first four icons allow you to align a group of controls with the top, bottom, left, or right edges; the next two align controls according to their horizontal or vertical centers. The next three icons allow you to make all of the controls the same height, width, or height and width. The next two icons center a control either horizontally or vertically (used together, they will center the control both horizontally and vertically). The last two allow you to change the relative position of overlapping controls (pulling one from behind to the front or vice versa).
The Color Palette toolbar
You can change the foreground and background colors of controls by using the Color Palette toolbar, which is also available from the View menu.
To change the foreground or background colors of a control, select the control, select the foreground or background icon in the Color Palette toolbar, and then select the color. You can select additional fixed colors, as well as create and assign custom colors with the Other Colors command button in the Color Palette toolbar.
The Report menu
The Report menu pad is available only when the Report Designer or Label Designer window is the active window.
The Title/Summary menu option is used to create Title and/or Summary bands for a report. The Title band is printed once at the beginning of the report; the Summary band is printed once at the end of the report. Select the appropriate check box to create the band, and then place controls in the band. You can force the Title and/or Summary bands to print on separate pages by selecting the appropriate New Page check box. Unchecking either the Title or Summary band check box will delete the band from the report-even if there are controls in the band- without first giving you a warning message.
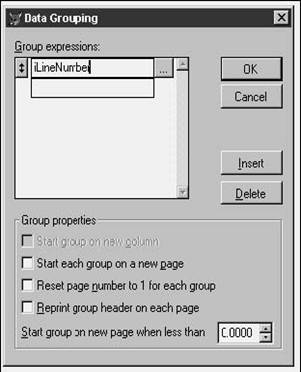
The Data Grouping menu option is used to create group bands for a report. You can create up to 20 levels of groups. The Grouping Expression mover control allows you to create and reorder multiple group expressions. You can either type an expression or use the ellipsis command button to open the Expression Builder. Groups are numbered in the report form in the order they were created, but you can change the order by dragging the expressions to the desired locations with the mover buttons on the left side of the mover control.
The Group properties box within the Data Grouping dialog, as shown in Figure 11.2, allows you to control how each group appears on the report.
If you are creating a multicolumn report, you can force the start of a new column when the group changes by selecting the "Start group on new column" check box. For all reports, you can force a group to start on a new page by selecting "Start each group on a new page" check box. You can also start page numbering with 1 each time a new group is encountered by selecting "Reset page number to 1 for each group" check box. Note that the "Start each group on a new page" check box is automatically checked and cannot be unchecked if you select the "Reset page number" check box. You can also have the Group Header band reprinted on each page (regardless of whether "Start each group on a new page" is checked) by selecting the "Reprint group header on each page" check box.
Finally, the "Start group on new page when less than" prompt enables you to control when to begin a group on a new page. If the Group Header is printed at the bottom of a page, most or all of the group's records may print on the following page (this works like widow control in a word processor). To force the Group Header to that page as well, adjust the setting of the spinner to an appropriate value. You can experiment with values made up of the height of the Group Header plus a multiplier of the height of the Detail band. For instance, if the Group Header is 2 inches high and a Detail band is 0.5 inches high, setting the spinner value to 2.9 will force the Group Header to start on the next page if fewer than two Detail records will fit on the remainder of the page.
The Variables menu option allows you to create memory variables that are evaluated while the report is running. These variables are available only during the execution of the report and are generally not visible to the rest of the application. A report can reference regular memory variables defined as public or private outside of the report as well, of course, just as it can reference field expressions. Report variables are handy for situations such as calculating rolling averages, counting through multiple groups, or calculating "percent of total" expressions that are evaluated for each record.
The Default Font menu option allows you to set the default font for the report form. This font is used when a Quick Report is created, as well as when additional controls are placed on the form. Note that the default font does not modify existing controls. (You would use the Format, Font menu option to change the font of existing controls.)
Clicking the Private Data Session menu option will set the report to have a data session that does not change if you open or use tables in other designers. When you add tables or views to your report's data environment, you are changing the data sources that supply the report. It is possible to make changes to the global data session with other designers (such as the Form Designer), and these changes can impact the data session of the report you are creating. Setting the data session for the report to Private will prevent this from happening. Of course, doing this prevents you from being able to create a cursor before running the report.
The Quick Report menu option allows you to automatically place fields and related controls on an empty form using one or more open tables as data sources.
The Run Report menu option allows you to print the report. It uses the standard Print dialog.
The View menu
A number of menu options are added to the View menu when the Report Designer window is active. Depending on whether or not a report is being previewed, the Design or Preview menu option is checked. To switch to the other view, select the other menu option.
The existing report toolbars are removed and the Preview toolbar is automatically displayed during Preview. The original toolbars are restored when returning to Design view.
The Preview toolbar allows you to move from page to page, move to a specific page, change the zoom factor, print the report, and return to Design view.
You can create a data environment that is set up with the report. If you have a data environment attached to a report, it handles the tables-opening and closing them, setting orders and relations, and so on-just like with the Form Designer. You don't need to manually open tables, set orders and relations, and so on. Simply opening the report will also open up the data environment.
Three toolbar options are automatically added to the View menu when the Report Designer window is active: Report Controls, Layout, and Color Palette. When a toolbar is visible, its menu option is checked. The toolbars you select will automatically be opened the next time you open the Report Designer.
You can make grid lines visible on the Report Designer window by using the View, Grid Lines menu option. You can use the Format, Snap to Grid and Format, Set Grid Scale menu options to control how the grid lines are used. Snap to Grid forces objects to align to the grid lines on the Report Designer, while Set Grid Scale allows you to control the spacing of grid lines and what measurement is used.
The Show Position menu option displays in the status bar the dimensions and location of the currently selected control in the Report Designer window (or the combined dimensions and locations if multiple controls are selected), or the location of the cursor if no controls are selected. The measurements used are determined by the choice selected in the Format, Set Grid Scale dialog.
Once you've created a report, you'll notice that its size has automatically been set to 8.5 x
11. How do you get a landscape report instead? The trick is to avoid the View and Report menus-open the File, Page Setup menu option, click the Print Setup button, and choose the Landscape option button.
Up close with the Label Designer
Working with labels, and with the Label Designer in particular, is very similar to working with reports and the Report Designer as far as manipulating expressions, creating bands, previewing and printing, and so on. Here I'll cover a few additional capabilities peculiar to this process.
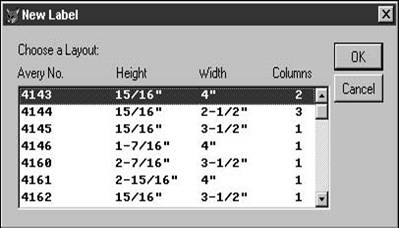
First, when you create a label, you might want to use a label template that defines the size and style of label: how wide, how tall, how many across on a page, and what that page looks like. Visual FoxPro comes with a set of default label sizes (based on labels available from Avery, a leading label vendor), but, unfortunately, they are not installed automatically. If you attempt to CREATE LABEL and they're not installed on your computer, you'll get a message stating that there are no default labels installed. Of course, as with all other Microsoft error messages, there's no mention about what to do about this situation.
To install the default label templates, you can simply run the Label Wizard by opening the Tools menu and clicking Wizards, then Labels. After you pick a data source in step 1, you'll be prompted for a template in step 2. If Visual FoxPro doesn't find any existing templates, it will ask you whether or not you want them to be installed. Answer yes, and then cancel out of the wizard. You'll now have the templates installed, and when you issue the CREATE LABEL command, you'll be prompted with a dialog that allows you to select a template, as shown in Figure 11.3.
There are enough tricks with creating labels that you may want to consider using the Label Wizard to create all of your labels, and then just tweak the results with the Label Designer as needed.
The Label Designer window
Creating a label is different in several ways. First, when creating a label (either through the File, New, Label menu option or by typing the CREATE LABEL XXX command), you'll be asked to choose a label size. (These label sizes are stored in the FOXUSER resource file.) Next, if you use Quick Report you'll notice that the Titles check box is not checked, because you usually won't want the titles of the fields to appear on a label. Third, the form layout is selected by default, because, again, that's probably what you are going to want.
Note that you can create any kind of band for a label. You might want to have a cover page for the labels and use the Title band for this, or print a Summary page of the number of labels printed and their types. You could also, depending on the type of label used, print a header at the top of each page (on the edge of the label form) for control or audit purposes.
In the Label Designer window itself, you'll notice a new kind of band-the Column Header and Footer. Because labels are by default a columnar type of report (even if you have only one column on a page), you can place controls on the top and bottom of each column, instead of having to duplicate the same controls for each of the two, three, or four columns on the page.
Tips and tricks
You can create a multi-column report by selecting the File, Page Layout menu option and changing the number of columns with the Column Number spinner. When you do so, the Report Designer changes to display only one column, and the Column Header and Footer bands appear as they do with the Label Designer.
You can control the data sources for a report in one of two ways. You can use a data environment stored with the report as I did with one example above, or you can specify a particular data source when you run the report. The second situation is handy when you are using the same report across multiple sets of data.
If you are going to be using multiple sets of data to populate the report, be sure to uncheck the Alias check box in the Quick Report dialog if these data sets contain tables with dissimilar names. This would happen if you have multiple tables with the same structures but different names. For example, if you have tables from multiple sales regions and they are all named according to their region, but they all have the same structure, you'll want to leave the field names unaliased.
Lines, rectangles, circles, and pictures are static controls. In other words, they don't change as the report processes records in the data source. However, they can be controlled by logical expressions, such as "print this box only if the amount is greater than zero."
When creating a Title Page or Summary Page, use the Layout Controls to center the data that goes on the page. Note that centering works only within the size of the band defined in the Report Designer. For example, if the height of the Title band is 5 inches and you create a separate title page and then center a title vertically, the title will display at 2.5 inches, not at 5.5 inches.
You don't have to use the Data Grouping feature to prevent a field from repeating. Suppose you're printing the PERSON table and have it ordered by Title, but don't want "President" and "Vice President" to print over and over. On the other hand, you don't want to group the report on Title, either. So open the Report Expression dialog, open the Print When dialog, and then set the Print Repeated Values option button to No.
Is that all there is?
After you've worked a bit with the Report and Label Designers, you'll undoubtedly feel shortchanged when comparing their functionality with the richness found elsewhere in Visual FoxPro. For example, the Report Writer has a number of deficiencies that haven't been corrected in over half a decade. And you might also be wondering why these designers aren't object-oriented like other parts of VFP.
Unfortunately, I can only sing the same sad song that I did with the Menu Designer. Even worse, the rationale that I used with the Menu Designer doesn't quite cut it with reports. You can get by with a five- or six-year-old Menu Designer without much problem, but the limitations of the Report and Label Designers are significant shortcomings when it comes to building applications.
The bad news is that it's not going to get any better. Microsoft has been fairly blunt in explaining that these tools are simply not going to be enhanced. Instead, you are expected to either "make do" with what you have, or use other tools in their place. For example, Microsoft points you to third-party report tools, such as Crystal Reports, when you ask about specific shortcomings. And as you'll soon see, Microsoft intends to place Visual FoxPro in the middle tier of the three-tier architecture they've been pushing over the past few years. As a middle tier, Visual FoxPro has no use for an interface, and thus no need for a menu, nor any need for output, and thus the Report Writer is at a dead end.
|
Politica de confidentialitate | Termeni si conditii de utilizare |

Vizualizari: 1176
Importanta: ![]()
Termeni si conditii de utilizare | Contact
© SCRIGROUP 2026 . All rights reserved