| CATEGORII DOCUMENTE |
| Bulgara | Ceha slovaca | Croata | Engleza | Estona | Finlandeza | Franceza |
| Germana | Italiana | Letona | Lituaniana | Maghiara | Olandeza | Poloneza |
| Sarba | Slovena | Spaniola | Suedeza | Turca | Ucraineana |
Schedule Development and the Network Diagram
With the statement of work and the work estimates completed, Perry is now ready to do some scheduling. In so doing, he will juggle six factors: scope, time, duration, tasks, logic, and resources. The scope is described in the SOW. Time is the hour estimate to complete each taskin other words, the estimates. Duration is the hour figure converted to flow time for completing each task and, consequently, the entire project. Tasks are the entries in the WBS. Logic is the sequence of tasks. And resources are the labor and nonlabor investments assigned to each task. But all of this will become clearer as we explain more about scheduling.
What Scheduling Is
Scheduling entails making a logical sequence of tasks and then calculating start and stop dates for each task. The results are displayed as a diagram.
A schedule is only useful if people are willing to commit themselves to maintaining it. Therefore, Perry sits down with his core team and determines the logical sequence of tasks. He has everyone look at the big picture, tying together all the tasks. They use this perspective to draw a network diagram, like the one in Exhibit 8-1. The network diagram displays the logical relationships between the tasks.
Network diagramming may initially seem complex, especially if youve not had previous experience drawing flowcharts. The advantages, however, are great. By constructing the diagram, you focus on the project goal and discover the appropriate approach. Difficult issues become apparent, so the effort and expense of dealing with them later is avoided. In addition, the diagram enables easier tracking of performance because it is based on the work-package level items in the WBS. Finally, making forecasts and what-if scenarios is easier.
|
Warning Signs of Bad Scheduling Practices Bad scheduling practices can tarnish the credibility of a schedule. Watch for these two common indicators of bad scheduling: Warning Sign Number 1: Sometimes people are unsure of the future, so rather than calculate an end date for a task, they write TBD, or to be determined. It not only represents unclear and incomplete thinking but also opens the opportunity for guesswork and poor oversight of tasks. Warning Sign Number 2: Occasionally people will develop schedules that contain too much negative float (being too tight) or too much positive float (being too loose). Either way, it indicates a problem with the schedule, especially one of realism. Too much negative float indicates that the schedule cannot be realistically accomplished; too much positive float indicates that estimates for the tasks are too low. |
Task Dependencies and Date Scheduling
A network diagram will show one or more of the following relationships, or dependencies, between tasks.
Finish-to-Start
An earlier activity, or the predecessor, is completed and the next one, the successor, is begun, as illustrated in Exhibit 8-2. Sometimes the succeeding task is not begun immediately; there is, in other words, a lapse of time between the end of the predecessor and the start of the successor. That interval is called lag. A task can have one or more predecessors or successors.
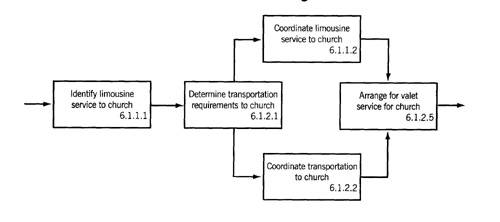
Exhibit
8-1. Network diagram.
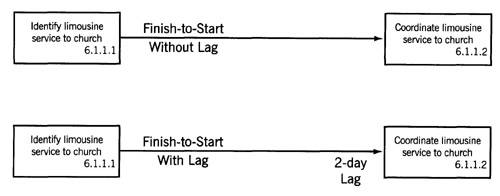
Exhibit
8-2. Finish-to-start relationship.
Start-to-Start
Two activities are begun around the same time, as displayed in Exhibit 8-3. Sometimes one task is begun just a little later than the other; the gap between the start of one task and the beginning of the other is also called lag.
Finish-to-Finish
Two activities are finished around the same time, as shown in Exhibit 8-4. Sometimes one task will finish earlier than the other, yet each must finish before its successor is begun. The time between the finish of one and the other is also called lag.
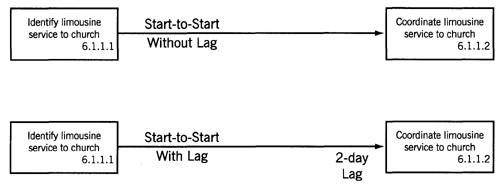
Exhibit
8-3. Start-to-start relationship.
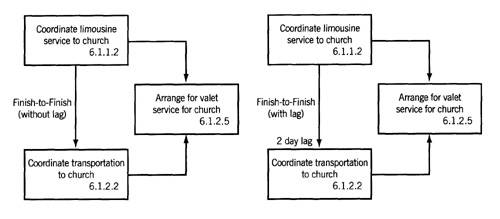
Exhibit
8-4. Finish-to-finish relationship.
Having identified all the dependencies between the tasks, Perry can apply the time estimates to each task. But the raw time estimates must be converted to some meaningful value. For starting purposes only, Perry converts the hour estimates into workdays. He divides the hours by 8 to derive the number of days needed to complete the task. He then uses this duration, or flow time, to calculate the start and stop date for each task.
Actually, Perry calculates two sets of start and stop dates: early and late start dates, and early and late finish dates. The early start and early finish dates are the first pair to calculate. The early start date is the earliest time a task can be begun. The early finish date is the earliest time a task can be completed. These dates are determined by comparing the duration of a task with the dates for the preceding and succeeding tasks.
|
Why Some People Dont Do Scheduling Occasionally you run into people who do not like schedules. Sometimes that person is even the project manager. There are all sorts of reasons for this reluctance. People might feel the time or effort expended to build the schedule exceeds the value gained. Or they might not want to commit themselves. If
you are working with someone who is reluctant to schedule, you have several
options. You can document a persons reluctance in a memo and send it to higher-level
management. You can hold a group meeting and cover the schedule in general,
letting peer pressure prompt the person to cooperate. A related tactic is to
apply the |
Some dates may not be logically derived from a network diagram. For example, certain tasks may have to start no earlier than a specific date or may not finish earlier or later than a specific time. In some cases, tasks may have to begin or finish on a specified date; these are known as constraint dates. Likewise, the start or finish date of a task may depend on the start or completion of a task in another project. The output of one project, for example, may feed another. Under these circumstances, the task has an external dependency that must be considered when calculating start and finish dates.
Perrys Scheduling Method
Heres how Perry calculates the early start and early finish dates for his tasks. First, he assigns activity numbers to the tasks in the WBS and converts the time estimates into flow times, as shown below:
|
Activity Number |
Task Description |
Hours |
Duration (Hours/8) |
|
|
|||
|
Identify limousine service to church | |||
|
|
|||
|
Coordinate limousine service to church | |||
|
|
|||
|
Determine transportation requirements to church | |||
|
|
|||
|
Coordinate transportation to church | |||
|
|
|||
|
Arrange for valet service for church | |||
|
|
|||
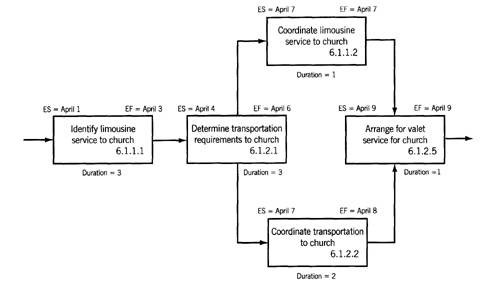
Next, Perry logically ties all the tasks together in a network diagram. (A network diagram was shown in Exhibit 8-1.) After determining the durations and sequences, Perry calculates the early start and early finish dates for each task and then the entire project. He performs the forward pass, by moving from the first task in the network diagram up through the last.
Now, as shown in Exhibit 8-5, Perry knows that task 6.1.1.1 will begin on 8:00 A.M., April 1. He also knows that the previous task was completed the day before. He knows, too, that the duration is three days, meaning the task will be done on April 1, 2, and 3, finishing at 5:00 P.M. on the April 3. Task 6.1.2.1 is the successor and it will begin on April 4 at 8:00 A.M. It, too, has a duration of three days and is completed at 5:00 P.M. on April 6.
Two successor tasks follow 6.1.2.1. They both will begin on the day after 6.1.2.1 is completed, April 7. Task 6.1.2.2 has a duration of two days, so it is completed at 5:00 P.M. on April 8. Task 6.1.1.2 has a duration of one day, so its completion date is April 7.
Exhibit
8-5. Forward pass (where ES is early start, EF is early
finish).
Task 6.1.2.5 cannot be begun until its two predecessor tasks are finished. The one that is finished the furthest out6.1.2.2must end before 6.1.2.5 can begin. Hence, 6.1.2.5 will begin on April 9 and, with a duration of one day, will be completed on April 9.
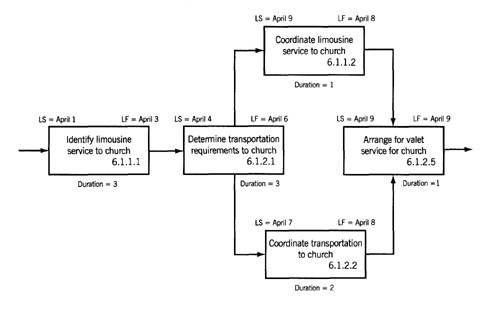
Perry now calculates the late start and late finish dates for each task. Using the same durations and dependencies in the network diagram, he moves from right to left, beginning with the very last task and calculating the late start and late finish dates. This movement from right to left is the backward pass, as shown in Exhibit 8-6.
Assuming that the finish date to task 6.1.2.5 has been set as April 9, Perry can begin the backward pass. He knows that 6.1.2.5 has a duration of one day and, consequently, begins on that same day, providing a late start date of April 9. He realizes that task 6.1.2.5 has two predecessors, 6.1.1.2 and 6.1.2.2. Since they each finish the day before, their late finish dates are April 8. Task 6.1.2.2 has a duration of two days and, consequently, has a late start date of April 7. Since task 6.1.1.2 is a concurrent activity, and has a shorter duration, it can begin as far back as April 7, the same late start date as 6.1.2.2. Since 6.1.2.1 is the predecessor to both 6.1.1.2 and 6.1.2.2, it must have a late finish date of April 6. Since task 6.1.2.1s duration is three days, its late start date is April 4. And since task 6.1.1.1 is the predecessor of 6.1.2.1, it must finish the day before, on April 3; with a duration of three days, it must have a late start on April 1.
|
Is Work Group Participation the In many environments, project managers develop schedules without input or feedback from the people who will be doing the work. There are several reasons for this. One is the time required to obtain this input. Getting people involved adds time, and the more people, the more time to develop the schedule. Also, the project manager has overall responsibility for the project. The project manager has the big picture perspective and can ensure that all the pieces fit together. The counterargument is that the work group should have a say in building the schedule. Although participation adds to the flow time, it does offer some powerful advantages. By obtaining input, the project manager solicits ownership in and commitment to the schedule, especially for the work each person is responsible to do. Work group participation also helps to raise issues and question assumptions early to preclude future misunderstandings and problems. |
Exhibit
8-6. Backward pass (where LS is late start, LF is late
finish).
![]()
Note: this is only a partial description of the network diagram for the wedding. Its a snapshot presented here to illustrate the basics of network diagramming and calculating dates.
![]()
The Float
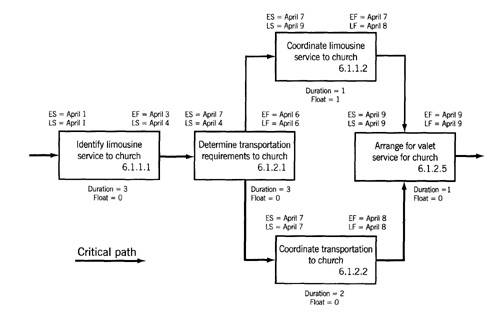
Perry now has four dates for each task: early start, early finish, late start, and late finish. These dates are necessary to calculate the float for a task. Float is the time an activity can slide without affecting the project completion date. For instance, if a task does not have to be begun right away, there may be time to slide. Or if it does not have to be finished as early as possible, there is time to let the date slide a bit.
Perry uses a simple calculation to determine float: the difference between the early start date and the late finish date, minus the duration, as shown in Exhibit 8-7.
Tasks given a zero float means that they cannot slide; if they do, then the project end date will slide, too. The one or more paths through the network diagram that have tasks with zero floats are called the critical path, as shown in Exhibit 8-7.
There are, in reality, two types of float. The float just described is known as total float and affects the project end date. The other type is the free float, which occurs on noncritical paths. This is the time that an activity can slide without impacting the start date of its successor.
Exhibit
8-7. Critical path showing float.
Other Types of Network Diagrams
Perry has used one type of network diagram, but several other types exist. Perrys choice is the precedence diagramming method. It is used most often in nonconstruction applications, such as in the information systems, pharmaceutical, and engineering industries.
For construction applications, the arrow diagramming method is used. It, too, relies on relationships, but they take a different form. The arrow diagram uses nodes to represent events and arrows to describe the task between those nodes. Also, this technique uses dummy activities that consume no resources, unlike the precedence diagramming method.
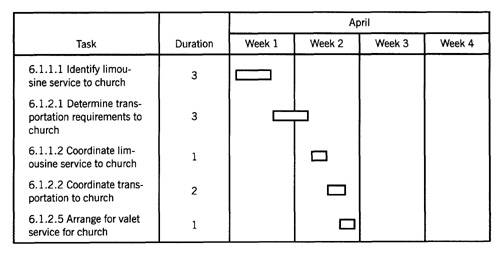
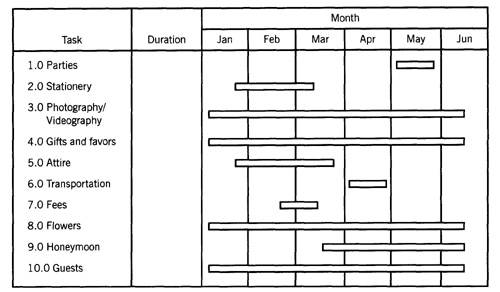
Another diagramming technique is the bar, or Gantt, chart. The fundamental difference between a bar chart and a network diagram is that the former does not show dependencies. The bar chart displays a list of tasks and, for each one, a bar shows the flow time or duration. As Exhibit 8-8 shows, a standard bar chart does not present all four dates for a task.
The bar chart often is useful, for several reasons. It is easy to read, showing only one set of start and finish dates. The bar itself provides a visual means to check the status of a task. It is also excellent for rolling up, or summarizing the progress of a related group of tasks. Thus, its simplicity, visual orientation, and summarization capabilities make it an excellent tool for reporting to senior management. It gives senior management the big picture rather than the details. A bar chart using roll-ups is shown in Exhibit 8-9.
Exhibit
8-8. Basic bar chart.
Exhibit
8-9. Roll-up bar chart.
The milestone chart is a type of bar chart. It has the outlay of a bar chart but also has an icon or symbol to mark the occurrence of an event. The icon has a duration of zero. This event might be receiving approval or the completion of a task. Exhibit 8-10 is an example of a milestone chart. Like the basic bar chart, it is best used when reporting to senior management.
|
Exhibit 8-10. Milestone
chart.
Task Duration Month Jan Feb Mar Apr May Jun 1.0 Parties |
Perry uses the network diagram to plan the details of the project and manage it from day to day. He uses the bar chart for reporting to senior management.
The Schedule as a Road Map
Using the work breakdown structure and the time estimates that he developed earlier, Perry builds a realistic schedule. The schedule provides a road map for him and all team members to follow.
However, he realizes that a schedule can help him to accomplish only so much. He also needs to organize his project so that he can efficiently and effectively execute his plan.
Questions for Getting Started
Did you develop a network diagram or a bar chart? Or both?
If you developed a network diagram, did you:
Assign task numbers to each item in the WBS? Is the numbering scheme meaningful?
Identify the people who will help you put the logic together?
Tie all the tasks together to form a complete, logical diagram?
Convert the hours for each task to flow time or duration?
Calculate the early and late start and finish dates for each task?
Consider the constraints, such as imposed dates, when calculating dates?
Consider relationship types and lag?
Calculate float to identify the critical path(s)?
Obtain all core team members concurrence?
|
Politica de confidentialitate | Termeni si conditii de utilizare |

Vizualizari: 2560
Importanta: ![]()
Termeni si conditii de utilizare | Contact
© SCRIGROUP 2025 . All rights reserved