| CATEGORII DOCUMENTE |
| Bulgara | Ceha slovaca | Croata | Engleza | Estona | Finlandeza | Franceza |
| Germana | Italiana | Letona | Lituaniana | Maghiara | Olandeza | Poloneza |
| Sarba | Slovena | Spaniola | Suedeza | Turca | Ucraineana |
Getting Started with MapObjects 2.2 in PowerBuilder 7.0
In this introductory document you'll use MapObjects 2.2 and PowerBuilder 7.0 to build an application that uses maps. This guide will show you how to
Display a map with multiple layers
Control panning and zooming
Add toolbar buttons
Display map layers based on scale
Perform spatial and logical queries
Draw simple graphics on the map
Display features with thematic renderers
Dynamically display real-time data with an event tracking layer
Create an application named 'Map'
1. Launch PowerBuilder 7.0.
2. If previously opened applications are not available, PowerBuilder will display a dialog from which you will need to choose the Application icon and click OK.
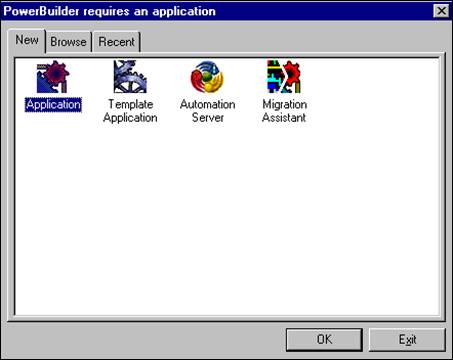
If this dialog box does not appear, select File > New from your menu.
3. You will be prompted for details on what you want to call the new application and library. Type tutorial for your Application Name. For the Library, navigate to the location where you would like to store the *.pbl. Our tutorial is saved into the MapObjects2SamplesPb7 directory.
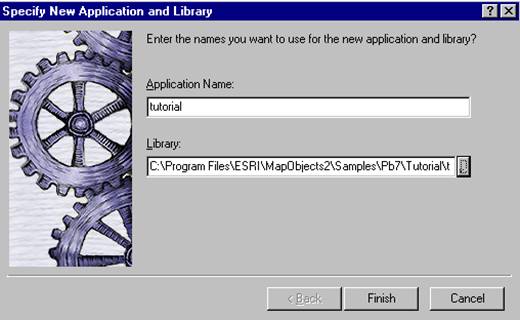
Click the Finish button and you are at the PowerBuilder application window
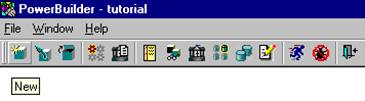
We need to create a window on which to display our map.
Select File > New from the menu bar, or choose the New tool on the Powerbar.
![]()
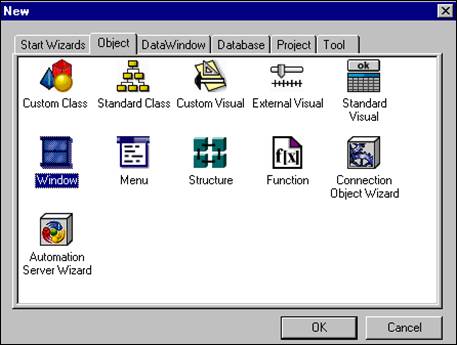
Select the Object tab in the New dialog that appears box and choose the Window icon. Once selected, click OK.
This will be the window on which you will place your map to display your data layers.
Your new window is untitled and unsaved.
Save the window as w_map and, in the Properties view, set the Title to MapObjects Tutorial.
You will now modify the Open event script for the application in order to ensure the window with your map control is initialized when the application is first run.
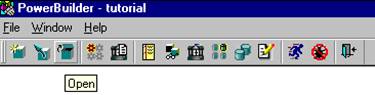
Select File > Open from the menu bar, or choose the Open tool on the Powerbar.
![]()
Select Applications in the ObjectType box and choose the Tutorial. Once selected, click OK.
Ensure the Open event is displayed in the Script view. Type open (w_map) in the script.
To compile this short script, right-click anywhere in the Script view area and select Compile from the popup menu that appears.
Close this window to return to the Layout view. Run the application as a test to ensure your window is sized and placed to your liking.
![]()
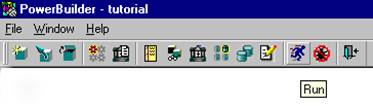
When you run your application at this stage, you should see an empty application window with a title of MapObjects Tutorial.
From the menu bar, select Insert > Control and scroll to the OLE option listed.
In the Insert Object dialog, click on the Insert Control tab.
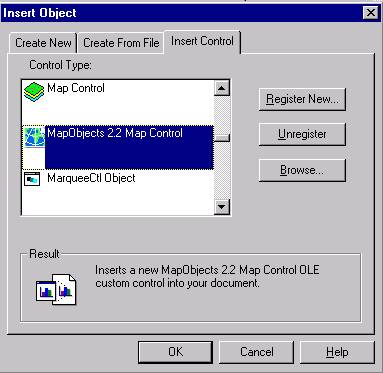
Scroll down to MapObjects 2.2 Map Control entry. Once selected, click OK.
Your cursor will turn into a crosshair icon
Click on the w_map window surface. The Map Control will appear as an empty white box.
The Map control at first is quite small. Stretch it by grabbing the bottom right-hand corner, dragging it to a larger size. Leave some space (about half an inch) at the top.
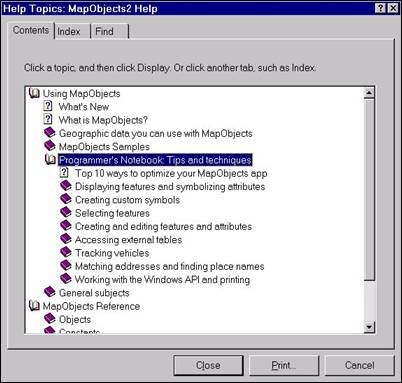
The Map control is one of the 46 objects that make up MapObjects 2.2. To find out about the various objects, open the MapObjects2 Online Reference and select Objects in the table of contents under the MapObjects Reference heading. You can access the help from your Task Bar: Start > Programs > ESRI > MapObjects2. Additionally, the help file is named MapObjects2.hlp, and is located under C:Program FilesESRIMapObjects2, if you accept the default path during installation of MapObjects. The help system provides help for every object, property, method, event, and constant in the MapObjects software.
Adding Data to the Map
Although MapObjects is a developer-based product, you can add data to the map interactively, by setting the properties in the MapObjects Map Control Properties window
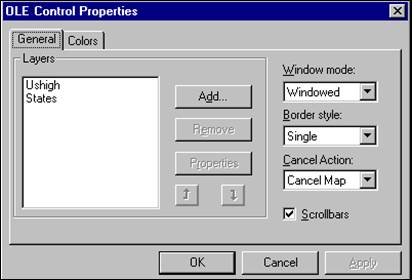
Set properties for the layers
With the Ole Control Properties window still open, highlight the States layer
in the Layers list (left pane), and then click the Properties button.
Click the Color button to select a color for the States layer.
Click OK to close the dialog.
Select a color for the USHigh layer in the same manner.
Click OK to close the Ole Control Properties window for the Map control.
Test your application
![]() 1. Click the Save button in the PainterBar
to save changes to w_map.
1. Click the Save button in the PainterBar
to save changes to w_map.
2. Choose the Run button in the PowerBar.
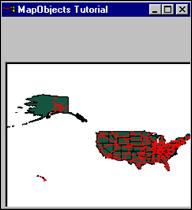
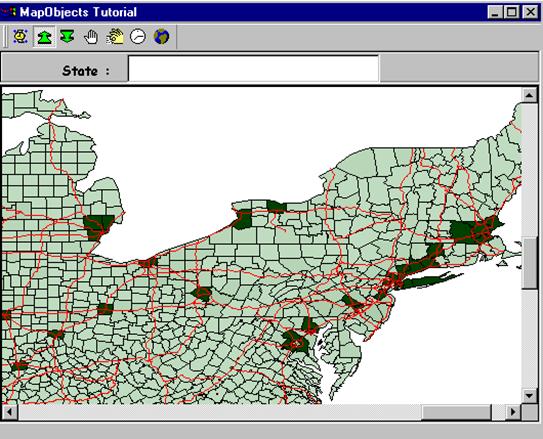
If
you have successfully completed the above steps, when run, your application
should display two vector layers showing the
Pan and Zoom
At this point, your application can display the map at its full extent. In the following part of this tutorial, you will add simple pan and zoom functionality that will be activated in response to mouse clicks on the map. You will write code that executes in response to the MouseDown event on the map.
Handle Map Resizing
In this step, you will add some code to the Resize event for the w_map window to ensure all objects on the window resize accordingly.
Open your Script view for the w_map window and select the Resize event. If the Script view is not displayed, select the gray background of the w_map window in your Layout view, and right-click to display the pop-up menu. Then select Script.
Add the following PowerScript:
ole_map.Width = this.WorkSpaceWidth()
ole_map.Height = this.WorkSpaceHeight() - 130 60
Compile the script.
Similarly, select then Open event script for w_map, and add following four lines of Powerscript:
GetApplication().ToolBarUserControl = FALSE
ole_map.Width = this.WorkSpaceWidth()
ole_map.Height = this.WorkSpaceHeight() - 130 - 60
ole_map.Move(this.WorkSpaceX(), this.WorkSpaceY() + 130)
Compile your script and save the changes to your application.
Click the Run button in the PowerBar
You should see that the map control window is placed on the window at a particular location. Additionally, when you resize the window, the map control resizes accordingly. Dont worry about the gray space between the title bar and the map control; well be filling that area with a toolbar eventually.
Stop running your application and return to design mode.
Adding Pan and Zoom capabilities
1. Click the map control, and right-click to display the popup menu. Select Script.
2. In the Script view, choose the MouseDown event script for ole_map.
3. Add the following Powerscript to the Script view:
If Shift = 0 Then
If Button = 1 Then
ole_map.Object.Extent = ole_map.Object.TrackRectangle
Else
ole_map.Object.Pan
End If
Else
If Button = 1 Then
OleObject l_rect
l_rect = ole_map.Object.Extent
l_rect.ScaleRectangle(1.8)
ole_map.Object.Extent = l_rect
Else
ole_map.Object.Extent = ole_map.Object.FullExtent
End If
End If
TrackRectangle is a method that applies to a Map control, returning a Rectangle object. When the user clicks on the map and drags, the TrackRectangle method rubberbands a rectangle. In this case, when the user releases the mouse, the map zooms to the specified area that is, the rectangle that the user has tracked with the cursor.
Adding a toolbar
Click the File menu option and select New.
Select the Menu icon in the New dialog box that appears, in order to build a new toolbar.
Your new menu will be untitled, initially. Save it as m_main and begin adding. seven (7) items from the following table, using Insert/Menu Item At End. For each one of the entries, go to the Toolbar tab in the Properties view and set the ToolBarItemOrder property as shown in the table (below). Then go to the ToolBarItemName and add a picture of your choice to every button. The following are the values of the ToolBarItemOrder property for the new menu items:
|
Menu Item |
Order Value In Toolbar |
Name |
Add Shape |
m_addshape |
|
Zoom In |
m_zoomin |
|
|
Zoom Out |
m_zoomout |
|
|
Pan |
m_pan |
|
|
Query |
m_query |
|
|
Add Event |
m_addevent |
|
|
Full Extent |
m_fullextent |
We only want to see the toolbar buttons, as icons, so click on the General tab in the Properties View and turn off the Visible checkbox for each item.
Optionally, you can set Shortcut keys or, if youd like to see pop-up tool tips, apply ToolBarItemText for all these buttons.
At this time, since we have not yet written code, these button wont do anything if you run the Application.
When you are in the Window painter workspace, open the w_map window and select Insert ->Control -> OLE from the menu bar. Under the Insert Control tab where you found the MapObjects control, select Threed Panel Control and add it to the MDI form. Position the panel control along the top of the map control. For all three controls that we are adding here -- panel, static text, single line edit -- lets leave the controls height value as default to make things simple; only change the controls width value when you position and resize them.
Change the Panel controls name to ole_panel in the Property view.
Select Insert ->Control -> StaticText, and add a static text control on top of the panel.
Select Insert ->Control -> SingleLineEdit, and add a single line edit control next to the static text on the panel control.
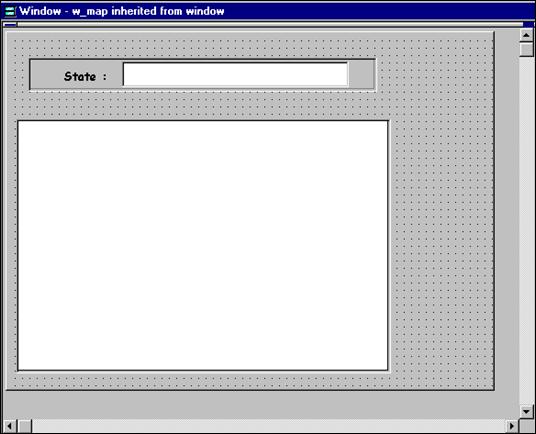
Change then name of the static text control to st_text, change its text from None to State:. Get into the Font sheet and change the controls BackColor to ButtonFace, if its not set already
Change the name of the single line edit control to sle_edit; get into the Font sheet and change the BackColor to Custom (white).
Since we want our panel controls to size proportionately as we resize the window, we need to add a few more lines of code. Go to the Resize event for w_map, and add the following line of PowerScript code at the end:
ole_panel.Width = this.WorkSpaceWidth()
Now add the following three lines to the Open event for w_map:
ole_panel.Height = 130
ole_panel.Width = this.WorkSpaceWidth()
ole_panel.Move(this.WorkSpaceX(), this.WorkSpaceY())
Run the application and test your changes. If the static text control, the single line edit control and the panel control are not aesthetically arranged when you run the application, return to design mode (Window painter workspace) and adjust their respective positions.
Implementing the toolbar and Find tool
Implement the Toolbar
For buttons 2 through 6 on the toolbar that is, those buttons with ToolBarItemOrder values 1 to 5, representing ZoomIn, ZoomOut, Pan, Query, and AddEvent respectively we need to ensure that only one button is active at a time. We must implement this behavior ourselves by keeping track of the active tool.
Delete all existing code in the MouseDown event for the ole_map control in w_map, or simply comment out the lines of code.
Add the following PowerScript to the MouseDown event for ole_map control:
OleObject l_pt
l_pt = ole_map.Object.ToMapPoint(ocx_x, ocx_y)
If m_main.m_ZoomIn.Checked Then
ole_map.Object.Extent = ole_map.Object.TrackRectangle
ElseIf m_main.m_Zoomout.Checked Then
Oleobject l_rect
l_rect = ole_map.Object.Extent
l_rect.ScaleRectangle(1.5)
ole_map.Object.Extent = l_rect
ElseIf m_main.m_pan.Checked Then
ole_map.Object.Pan
ElseIf m_main.m_query.Checked Then
If IsValid(ole_map.Object.Layers.Item(States)) Then
OleObject l_recset
l_recset = ole_map.Object.Layers.Item('States').SearchShape(l_pt, 12,'')
OleObject l_shp
String ls_stname
Do While Not recset.EOF
l_shp = l_recset.Fields.Item('Shape').Value
ls_stname = l_recset.Fields.Item('State_name').Value
ole_map.Object.FlashShape(l_shp, 4)
MessageBox('Find A State', 'This is the State of ' + ls_stname)
l_recset.MoveNext
Else
MessageBox('Query', 'Add States layer first.')
End If
ElseIf m_main.m_addevent.Checked Then
ole_map.Object.TrackingLayer.AddEvent(l_pt, 0)
End If
When the m_query button is clicked, the MapObjects SearchShape ( ) method is used on the MapLayer States, passing the user-clicked point (pt) as the first parameter, and the moPointInPolygon constant as the second parameter, setting the optional third argument to an empty string (). If the feature contains the point where the user clicked, a polygon shape is returned and passed to the FlashShape method, to be flashed 4 times.
We want the Zoom In button to be checked when the application starts, so add the following line of PowerScript code to Open event for w_map:
Make sure button Zoomin is checked when app starts //////
m_main.m_zoomin.Checked = True
To ensure only one button is checked at a time, we have to uncheck all other four buttons whenever a button is clicked (checked).
Open the Menu - m_main, select the menu item ZoomIn. Open the Script view and select the Clicked event for m_zoomin.
Add the following PowerScript code to the Clicked event for m_zoomin:
m_main.m_zoomout.checked = false
m_main.m_pan.checked = false
m_main.m_query.checked = false
m_main.m_addevent.checked = false
this.checked = true
Similarly add code to the Clicked event for m_zoomout, m_pan, m_query and m_addevent, respectively.. Here is an example for m_addevent. Now complete similar code for the Clicked event for m_zoomout, m_pan, and m_query.
m_main.m_zoomin.checked = false
m_main.m_zoomout.checked = false
m_main.m_pan.checked = false
m_main.m_query.checked = false
this.checked = true
To implement the FullExtent button on the toolbar, add the following code to the Clicked event for m_fullextent:
w_map.ole_map.object.extent = w_map.ole_map.object.fullextent
Test your changes
Save the application.
Click the Run button in the PowerBar.
Click-drag your mouse on the map to zoom in. Notice that the ZoomIn button is already checked, as the default.
Select the Pan button in the toolbar, then click-drag your cursor on the map to see the map pan.
Select the ZoomOut button in the toolbar, then click on the map to zoom out.
Click the Query button in the toolbar, then select a
Click the AddEvent button in the toolbar, then click somewhere on the map. You will see a new GeoEvent is created at the specified location on the map. If you would like to use another Symbol to draw the GeoEvent, you can easily do this by setting a Symbol object first.
For example, you can change the last ElseIf statement in MouseDown event for ole_map from:
ElseIf m_main.m_addevent.Checked Then
ole_map.Object.TrackingLayer.AddEvent(l_pt, 0)
to the following code
ElseIf m_main.m_addevent.Checked Then
OleObject l_tLayer
l_tLayer = ole_map.Object.TrackingLayer
l_tLayer.SymbolCount = 1
l_tLayer.Symbol(0).Color = RGB(255, 0, 0) // Red
l_tLayer.Symbol(0).Style = 4
l_tLayer.Symbol(0).Font.Name = 'Wingdings'
l_tLayer.Symbol(0).Size = 18
l_tLayer.Symbol(0).CharacterIndex = 81
l_tLayer.AddEvent(pt, 0)
Now run your application again. You should see the GeoEvents displayed as red airplane symbols. The capability of displaying geographic entities on top of the map is often desirable, especially if those entities have a tendency to move. For example, a vehicle tracking system would want to display vehicles on the map at particular locations and update those locations over time, without redrawing all the layers of the map each time a vehicle changes location. If you would like to see a moving GeoEvent, simply use the Move( ) or MoveTo( ) method on the GeoEvent object. You can add a Timer control onto your map to trigger the movement of the events.
Implement the Find tool
Go to the w_map Window painter Layout view.
Select Declare in the first dropdown listbox of the Script view.and Global Variables in the second dropdown listbox. Add two global variables:
OleObject g_poly
OleObject g_sym
Get into the Open event for w_map and the following PowerScript to initialize the global variable g_sym:
////// Initialize global variable g_sym //////
g_sym = CREATE OleObject
g_sym.ConnectToNewObject('MapObjects2.Symbol')
g_sym.Color = RGB(255, 128, 0) // MoOrange
g_sym.SymbolType = 2 // MoFillSymbol
g_sym.Style = 10 // MoDarkGrayFill
Since we are allocating memory when the new OleObject g_sym is created, we have to release the memory explicitly. We do this by adding the following script to the Close event for w_map. The Close event is triggered whenever you terminate the application.
DESTROY g_sym
Now we will code the
Get into the Script view for the sle_edit object and select the Modified event. Add the following PowerScript:
String ls_exp
OleObject l_recset, l_rect
//Extract the value from the edit box and construct a query.
If IsValid(ole_map.Object.Layers.Item('States')) Then
ls_exp = 'State_name = ~'' + this.Text + '~''
//Pass the query to the SearchExpression method to return a recordset
l_recset = ole_map.Object.Layers.Item('States').SearchExpression(ls_exp)
//Zoom to the extent of the first shape in the recordset
If Not l_recset.EOF Then
g_poly = l_recset.Fields.Item('Shape').Value
l_rect = poly.Extent
l_rect.ScaleRectangle(2)
ole_map.Object.Extent = l_rect
Else
MessageBox('Query', this.text + ' is not found. Check your spelling and
try again.')
End If
Else
MessageBox('Query', 'States layer is not found. Add this layer first.')
End If
Go to the Script view for ole_map and select the AfterLayerDraw event. Add the following PowerScript:
//Draw the resulting state using the symbol set up in the w_map Open event.
If index = 0 then
If IsValid(g_poly) Then
If Not IsNull(g_poly) Then
ole_map.Object.DrawShape(g_poly, g_sym)
End If
End If
End If
Run your
application again, type
The above code first builds a simple SQL query expression using the value of sle_edits Text property. The States layer is then searched using the SearchExpression method with the result being a Recordset object. If the value of the Recordsets EOF property is FALSE, the Recordset is positioned on the first record that satisfies the search expression. In that case, the value of the Shape field is obtained for the first record. The extent of the shape is scaled and then set to be the Extent of the map. The map is then implicitly redrawn when the Extent property is set. This will trigger a redraw of the map and, consequently, will initialize the maps AfterLayerDraw event, where we draw the shape using the Symbol that we defined earlier. Note that the DrawShape method can only be called in the BeforeLayerDraw, AfterLayerDraw, BeforeTrackingLayerDraw or AfterTrackingLayerDraw events on the map control.
In the w_map painter view, select your ole_map and right-click to get the OLE Control Properties dialog.
Add a new layer, Counties.shp, to the map control and change the color for the layer. This shapefile will be found in the same directory where States.shp and Ushigh.shp are located.
Before closing the OLE Control Properties dialog, select the Counties layer that you just added and move the layer to the bottom of the list of layers, using the Down arrow button located beneath the Properties button on the dialog (see snapshot).
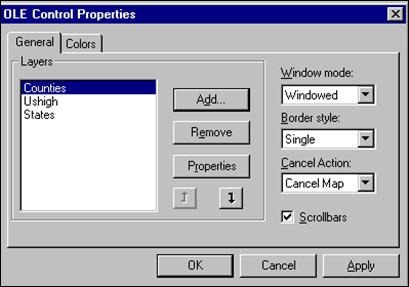
Since weve moved the Counties layer to the bottom of the list of layers, it will display first on the map control at run-time. MapObjects draws the layers in the Layers collection from the bottom up (in this case, Counties -> States -> USHigh). Therefore, the States layer will be displayed on top of, and covering, the Counties layer. In this step, we will be scripting such that the Counties and States layers will toggle their visibility, based on the current map extent
Add the following PowerScript to the BeforeLayerDraw event for ole_map. When you run the application and zoom in on the map, you will change the visibility of the Counties and States layers, depending on the current extent of the map. The value of the Visible property of each layer is based on the current extent of the map. If the width of the current extent is less than or equal to one-fourth of the full extent of the map, then the Counties layer will be visible and the States layers visibility will be turned off.
If IsValid(this.Object.Layers.Item('Counties')) Then
this.Object.Layers.Item('Counties').Visible = &
this.Object.Extent.Width < ((this.Object.FullExtent.Width) / 4)
End If
If IsValid(this.Object.Layers.Item('States')) Then
this.Object.Layers.Item('States').Visible = &
this.Object.Extent.Width >= ((this.Object.FullExtent.Width) / 4)
End If
Run your application and zoom in on the map. As you change extents, the features of Counties layer will appear, as the States layers visibility is set to False.
In this section, you will modify your application so that the Counties layer is drawn using the attribute information associated with the layer. Well render on the values from the field Pop1990 from the Counties attribute table, using the ClassBreaksRenderer object.
Select Declare -> Global Variables from the Script view and add one more global variable:
OleObject g_cbRend
Add the following to the end of the Open event for w_map:
////// Initialize global variable g_cbRend //////
g_cbRend = CREATE OleObject
g_cbRend.ConnectToNewobject('MapObjects2.ClassBreaksRenderer')
Go to the BeforeLayerDraw event for ole_map and add the following PowerScript at the end:
Double ld_breakVal
Int i
OleObject lo_stats
If IsValid(ole_map.Object.Layers.Item('Counties')) Then
g_cbRend.Field = 'Pop1990'
lo_stats =
ole_map.Object.Layers.Item('counties').Records.CalculateStatistics('Pop1990')
ld_breakVal = lo_stats.Mean - (lo_stats.StdDev * 3)
For i = 0 to 5
If (ld_breakVal >= lo_stats.Min and ld_breakVal <= lo_stats.Max) Then
g_cbRend.BreakCount = g_cbRend.BreakCount + 1
g_cbRend.Break(g_cbRend.BreakCount - 1, ld_breakVal)
End If
ld_breakVal = ld_breakVal + lo_stats.StdDev
Next
ole_map.Object.Layers.Item('Counties').Renderer = g_cbRend
g_cbRend.RampColors(12639424, 16384) // MoLimeGreen and MoDarkGreen
End If
Go to the Close event for w_map and add the following line to clean up the memory space we allocated above:
DESTROY g_cbRend
Run your application and zoom in such that the Counties layer becomes visible. Notice that the Counties features are now drawn in shades of green, depending on the attribute values of each county (Pop1990).
Each MapLayer object has a Renderer property. A Renderer object controls the symbology of the MapLayer features based upon a field value from the layers attribute table. The ClassBreaksRenderer can be used to display continuous numeric data, in this case, the Population values by county in 1990.
Working with DataConnection objects
In each of the previous sections you have worked with MapLayer objects that were specified interactively using the ole_map controls property sheet. In this section you will add code to your application, which creates and adds MapLayer objects programmatically using a DataConnection object.
Remove the existing layers
Get into the OLE Control Properties dialog for your map control by right clicking on the mouse while the map control is selected and choosing OLE Properties.
Select the Ushigh layer then click Remove button to delete the layer.
Remove the States and Counties layers in the same manner. Click OK to exit the Control Properties dialog.
Go to the Script view and open the BeforeLayerDraw event for ole_map.
Comment the first part of code (two If statements) that handles the visibility of the Counties and States layers. Our next step will be to programmatically add the Counties layer.
//////////// Comment out the following code //////////////
If IsValid(this.Object.Layers.Item('Counties')) Then
this.Object.Layers.Item('Counties').Visible = &
this.Object.Extent.Width < ((this.Object.FullExtent.Width) / 4)
End If
If IsValid(this.Object.Layers.Item('States')) Then
this.Object.Layers.Item('States').Visible = &
this.Object.Extent.Width >= ((this.Object.FullExtent.Width) / 4)
End If
//////////// The above code is commented now ///////////
Implement AddShape button on the toolbar
// If the filename (fName) that you selected in the file dialog is this: //
// C:Program FilesEsriMapObjectsSamplesDataUsaStates.shp //
// then: //
// dbName = C: Program FilesEsriMapObjectsSamplesDataUsa //
// shpName = States.shp //
// gdName = States //
String s_title, s_filter, s_ext, s_fName, s_gdName, s_dbName, s_shpName
Int i_value, i_pos
s_title = 'Select a Shapefile'
s_filter = 'ESRI Shape Files (*.shp), *.shp'
s_ext = 'shp'
i_value = GetFileOpenName(s_title, s_fName, s_shpName, s_ext, s_filter)
If not i_value = 1 then Return
i_pos = Pos(Reverse(s_fName), '')
s_dbName = Left(s_fName, Len(s_fName) i_pos)
s_gdName = Left(s_shpName, Len(s_shpName) - 4)
OleObject lo_dc, lo_mLayer
lo_dc = CREATE OleObject
lo_dc.ConnectToNewObject('MapObjects2.DataConnection')
lo_mLayer = CREATE OleObject
lo_mLayer.ConnectToNewObject('MapObjects2.MapLayer')
lo_dc.Database = s_dbName
If Len(s_gdName) > 0 Then
lo_mLayer.GeoDataset = lo_dc.FindGeoDataset(s_gdName)
w_map.ole_map.Object.Layers.Add(lo_mLayer)
End If
w_map.ole_map.Object.Extent = w_map.ole_map.Object.FullExtent
DESTROY lo_dc
DESTROY lo_mLayer
when the application is in run-time.
Click the AddShape button to navigate to a data location for your shapefiles. Once selected, Click Open. You can now dynamically add shapefiles to your application. This is an alternative to hard-coding the name and location of shapefiles that may not exist on target machines when your application is finally distributed.
Of course, you can add to the PowerScript in Step 2 such that you can programmatically load coverages, images, CAD data, etc. displaying whatever vector or raster data you require that is also supported by MapObjects 2.2. A list of all supported data formats is provided in the online Help topic.
Congratulations! You have successfully completed the PowerBuilder 7.0 Tutorial using MapObjects 2.2. Let the games begin!
|
Politica de confidentialitate | Termeni si conditii de utilizare |

Vizualizari: 2703
Importanta: ![]()
Termeni si conditii de utilizare | Contact
© SCRIGROUP 2025 . All rights reserved