| CATEGORII DOCUMENTE |
| Bulgara | Ceha slovaca | Croata | Engleza | Estona | Finlandeza | Franceza |
| Germana | Italiana | Letona | Lituaniana | Maghiara | Olandeza | Poloneza |
| Sarba | Slovena | Spaniola | Suedeza | Turca | Ucraineana |

ADtech Ax/4000 pegasus test Equipment
user's manual

Table of Contents
Preface
General information
History
References
About this guide
Audience
A word on other contributors
About the AX/4000 Broadband Test System
Setting up the ATM Generator
Setting up the ATM Analyser
Setting up the ATM interfaces
Running/stopping the test measurements
Run Menu Commands
Stop Menu Commands
Generator Run/Stop Button
Analyzer Run/Stop Button
Monitoring the ATM generator statistics
Description
Parenthesized results
Clear Statistics button
Monitoring the ATM analyzer statistics
Stream Statistics
Substream Statistics
Monitoring the analyzer additional statistics
Monitoring the ATM stream statistics
Aggregate Cell Count
Aggregate Cell Rate
Aggregate Cell Transfer Capacity
Bandwidth Percentage
Corrected Header Error Count
Uncorrected Header Error Count
Monitoring the ATM substream statistics
Defining the ATM interface statistics and control
typical test environment
Pegasus Adtech ax/4000 test equipment object model
Software structure
Adtech Test Equipment package
Atm Test Equipment Manager Package
CORBA TEST EQUIPMENT MANAGER CLASSES
Description
PEGASUS adtech Ax/4000 configuration
Example of Adtech AX/4000 configuration for generation and evaluation of ATM traffic with CBR
How to run Adtech AX/4000 Test Equipment locally
Installation
Locally installed Pegasus Adtech Test Equipment in action
Test traces and test results of successful run
How to run CORBA Adtech AX/4000 Test Equipment
Installation
Run Adtech Server
Starting the Naming Service
Running the Adtech Server
Run Adtech Client
Adtech Client in action
Example of setup with Pegasus Test Suite based on Adtech Test Equipment model
Test traces and test results of successful run
System Configuration File: Adtech and Physical Connections
Configuring for the DRY RUN
Adtech XSD schema and XML configuration file
This document describes how to use Adtech AX/4000 Pegasus Test Equipment object model as a base for development of generic powerful Pegasus test procedures for executing automated test cases with the ATM background traffic generated by the Adtech AX/4000 test equipment.
A a short introduction on the Adtech functional units that play major role in the test automation by Pegasus is given in first chapters. The design of the Adtech Test Equipment object model is described in detail for further development purposes. An overview on the existing generic test procedures released by Iskratel Ltd is provided here as well.
Proceeding chapters deal with the Adtech Test Equipment Framework installation and setup of the Pegasus test collection containing typical existing generic test procedures. In addition the system configuration file section that deals with Adtech data is described.
|
Issue |
Date |
Reason for Changes |
Author |
|
Draft |
Created |
Batic |
|
|
First version |
Updated |
Batic |
Spirents Adtech AX/4000 Online Help
This guide is intended for all Pegasus users that are using Adtech AX/4000 test equipment in their automated test cases performed by Pegasus.
Besides it tries to provide the help for developers who want to extend the Adtech Pegasus features with new test procedures and test managers.
Special thanks to Gregor Brodnjak who helped a big bunch with testing besides contributing to this document with traces and screenshots he found some very tricky bugs at the very late stage of integration testing.
Many special thanks of course to Robert Rogalski, the one and only AX/4000 master: thank you for your patience and the support through complete development phase. Thanks for hints and tricks and always working TCL code samples that opened the path towards the final solution.
Adtech Pegasus story would never happen without the support of our boss Robert Strubegger.
The AX/4000 Broadband Test System provides complete broadband traffic generation, full-rate analysis, bit error rate testing, network impairment emulation, and broadband WAN emulation for testing broadband equipment, switches, and networks for proper operation and Quality of Service (QoS) performance. It uses modular components, allowing custom configuration for various test applications.
The primary hardware components are the chassis (with a control module), an external controller, test modules, and port interfaces. With the exception of the power switch and front panel status indicators, the AX/4000 equipment is operated completely from the controller using the controller software. The controller software runs on IBM PC compatible computers operating in the Microsoft Windows 95, 98, 2000, NT, or ME graphical environment or a Sun Solaris workstation operating on a UNIX platform.
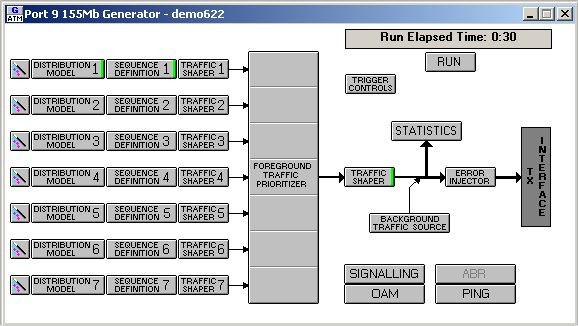
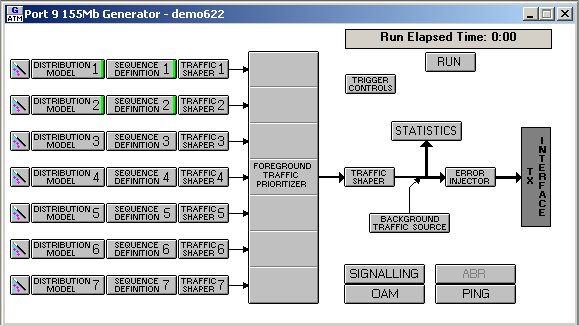
Each ATM Generator is made up of seven functional blocks that determine the traffic that it generates plus several statistics and control blocks for controlling the operation of the generator.
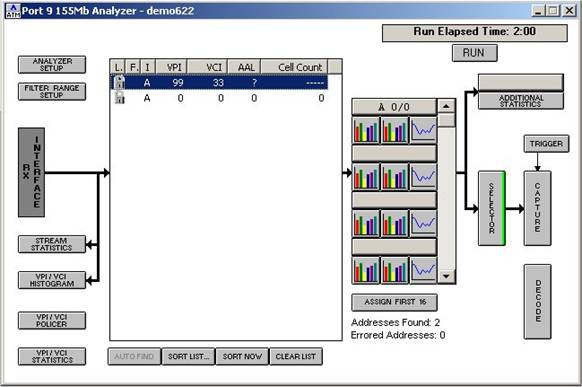
Each ATM Analyzer is capable of performing full analysis of up to 2,040 VPI/VCIs without the setup of any analyzer parameters. Upon entering the Run mode, new VPI/VCIs are detected and added to the VPI/VCI list box. AAL type and the test cell pseudo random bit sequence (PRBS) patterns are determined automatically. Cell count statistics for a given VPI/VCI begin with the first cell that is received with that VPI/VCI. Error statistics begin once the AAL type and the PRBS pattern (if this is a test cell stream) are determined.
The AX/4000 currently supports 17 different ATM physical layer interfaces (not including multilayer interfaces). Additional physical layer interfaces are planned as ATM evolves.
The ATM interfaces below are set up from a Setup dialog box accessed from an Interface Status and Control dialog box. Press the interface button on the System window or select the Interface command from the View menu to access the Interface Status and Control dialog box. From this dialog box, press the Setup button to configure the interface.
Alternatively, rightclick on an interface button on the System window to run/stop tests, to clear statistics, to change operational modes or clock sources, or go to the setup screen to configure that specific interface.
Start test measurements by using the Run menu commands or Run buttons. Stop test measurements by using the Stop menu commands or Stop buttons.
Use the Run menu's System command to start all analyzers and generators in the system. The analyzers are started first and then the generators. Use the Generator command to start only the generator whose dialog box is currently active. Use the Analyzer command to start only the analyzer whose dialog box is currently active. The Select command starts a selection of ports. The Timed command allows for timed run operation instead of continuous run. For continuous run, the generators and analyzers run until the stop command is given. For timed run, the generators and analyzers run until the time remaining (displayed at the bottom of the system screen) reaches zero.
|
Run Menu Command |
Description |
|
System |
Starts all analyzers, generators, and interfaces with a single command. Initializes network impairment emulator statistics. |
|
Generator |
Starts the active generator. |
|
Analyzer |
Starts the active analyzer. |
|
Select |
Starts a selection of ports. |
|
Timed (Set) |
Sets the run time for the Timed Run mode. |
|
Timed (Run) |
Generators/Analyzers run until the time remaining reaches zero. |
Use the Stop menu's System command to stop all analyzers and generators in the system. The generators are stopped first and then the analyzers. Use the Generator command to stop only the generator whose dialog box is currently active. Use the Analyzer command to stop only the analyzer whose dialog box is currently active. The Select command stops a selection of ports.
|
Stop Menu Command |
Description |
|
System |
Stops all analyzers, generators, and interfaces at the same time. |
|
Generator |
Stops the active generator. |
|
Analyzer |
Stops the active analyzer. |
|
Select |
Stops a selection of ports. |
You may start a single generator by pressing the Run button on the Generator dialog box. A window displays the run elapsed time. Pressing the Run button starts the run elapsed time from zero. Stop only this generator by pressing the Stop button on the Generator dialog box.
Also, you may right-click on a generator button on the System window to run or stop tests on a particular generator.
You may start a single analyzer by pressing the Run button on the Analyzer dialog box. A window displays the run elapsed time. Pressing the Run button starts the run elapsed time from zero. Stop only this analyzer by pressing the Stop button on the Analyzer dialog box.
Also, you may right-click on an analyzer button on the System window to run or stop tests on a particular analyzer.
The Generator Statistics dialog box shows the cell counts, cell rate, cell transfer capacity, and percent of bandwidth for the seven foreground traffic sources and the background traffic source. The aggregate traffic is the combined traffic of the seven foreground traffic sources and the background traffic source.
|
Statistic |
Description |
|
Cell Count |
Number of cells transmitted by the traffic source |
|
Cell Rate |
Average cell rate (sustainable cell rate). Number of cells transmitted / run time. |
|
Cell Transfer Capacity |
Average bandwidth equal to cell rate x 53 x 8 |
|
Percent Bandwidth |
Percentage of line bandwidth |
Each foreground traffic source contains a 1,024cell queue. The prioritizer mode, contention, and trafficshaping parameters can limit the cell transmission to a slower rate than requested and cause the queue to fill up. When the queue fills up, the foreground traffic source is stopped until queue space becomes available. Cells are not lost. To indicate that this is occurring, the software provides two indicators: (1) in the Generator Statistics dialog box, it puts parentheses around the cell rate, cell transfer capacity, and percent of bandwidth statistics of the congested traffic source and (2) in the System window the aggregate assigned cell count of the transmitted cells is displayed in blue, indicating at least one of the traffic sources in the generator is experiencing congestion. The congestion indicator can show congestion occurring for as long as the generator is running.
After the AX/4000 system is run and the Generator Statistics dialog box is opened, press Clear Statistics. All values in the dialog box return to 0, except for elapsed time. Clearing generator statistics does not affect the actual cell generation or any analyzer measurements currently active, but it does clear the system counts. If the generator is stopped, the Clear Statistics button will also reset all values to 0, except for elapsed time.
NOTE: The statistics and elapsed time are also cleared once the generator is restarted.
To display the aggregate cell count, uncorrected header error count, and corrected header error count (interface dependent), press the Stream Statistics button to open the Stream Statistics dialog box. A red bar is displayed on the Stream Statistics button to indicate nonzero, uncorrected header error counts.
To display substream cell counts, cell rates, and AAL statistics, double-click with the left mouse button on the desired VPI/VCI in the VPI/VCI list box.
To display additional statistics, press the Additional Statistics button and enter a VPI and VCI of the desired stream.
Additional statistics are provided for AAL 2 substreams. If additional statistics are enabled, the capture RAM is used so the capture function is disabled. When additional statistics are enabled, an Additional Statistics checkbox is displayed on the AAL 2 statistics screen. Checking and unchecking this box will display or hide additional statistics, respectively.
The CPS Packet Payload Length radio controls allow the user to select the maximum packet payload length for AAL 2.
The Stream Statistics dialog box displays an aggregate cell count, an uncorrected header count, and a corrected header count.
The aggregate cell count displays the total number of assigned cells the analyzer received. Normally, the aggregate cell count does not include cells dropped because of uncorrected headers. However, if the Pass Bad Headers option is enabled on the interface setup, the aggregate cell count will also include cells with detected header errors.
NOTE: With HEC Error Correction is enabled, the interface drops successive cells with HEC errors immediately following a HEC error until a cell with a good HEC is received. These dropped cells do not enter the analyzer and are not counted.
Average cell rate of the aggregate cell stream in cells/sec (aggregate cell count / elapsed time).
Average bandwidth of the aggregate cell stream in Mbits/sec (aggregate cell rate x 8 x 53).
The percentage of line bandwidth used in the aggregate cell stream.
Some interfaces support single bit error correction. The interface cannot correct two adjacent cells with HEC errors. The corrected header error count is the number of cells with header errors that have been corrected.
The uncorrected header error count displays the number of cells with uncorrected header errors.
NOTE: When the uncorrected header error count becomes nonzero, the Stream Statistics button on the Analyzer diagram displays a red bar on the right side. The nonzero error count is also displayed in red on the Stream Statistics display.
The AAL type displayed in the VPI/VCI list box determines the statistics displayed for a substream.
NOTE: When at least one of the statistics error counts become nonzero, its VPI/VCI is displayed in red in the VPI/VCI list box.
The interfaces below are monitored and controlled from an Interface Status and Control dialog box. Press the interface button on the System window or select the Interface command from the View menu to view interface statistics measurements or to control interface operation.
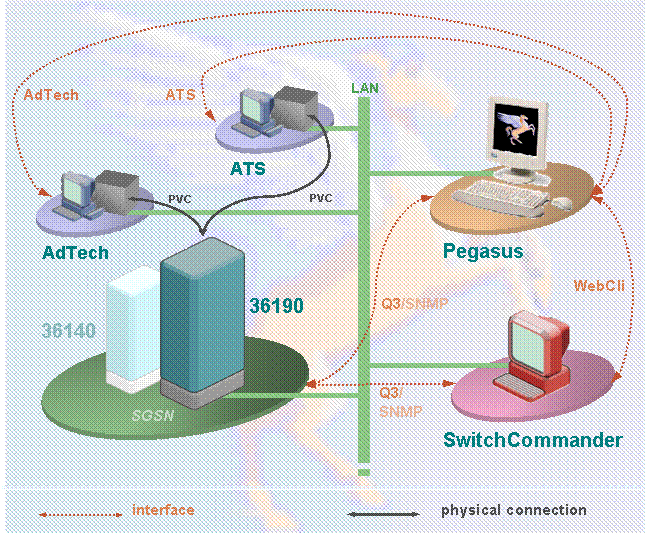
Figure below shows the typical test environment with Adtech AX/4000 Test Equipment:
ClearCase VOB: pegasus07
Test Equipment root package :
pegasus. testEquipment
|
├───adtech ├───atmCellLoadAnalyserEngine ├───atmCellLoadGeneratorEngine └───data ├───lib └───sources |
Test Equipment Manager root package:
pegasus. testEquipmentManager
|
├───network ├───atm │ └───corba │ ├───atmCellLoadAnalyserEngine │ │ └───atmCellLoadAnalyserEngineServantPackage │ ├───atmCellLoadGeneratorEngine │ │ └───atmCellLoadGeneratorEngineServantPackage |
Test Procedure root package:
pegasus. testProcedure. network. node. atmTraffic
|
Test Procedure |
Description |
|
TpAtmTrafficCellLossEvaluation. java |
Evaluate cell loss on particular cell distribution |
|
TpAtmTrafficInit. java |
Lock the interface card on specified slot if not locked already, initialize virtual geneartor/analyser pair (set up particular cell distribution on the genearator and the vpi/vci monitor on the analyser) |
|
TpAtmTrafficPersistanceEvaluation. java |
Evaluate traffic persistance over existing PVCs |
|
TpAtmTrafficRelease. java |
Release Adtech AX/4000 tester |
|
TpAtmTrafficStart. java |
Start unidirectional ATM traffic over existing PVCs defined by provided cell distribution |
|
TpAtmTrafficStop. java |
Stop traffic (generated by specified cell distribution model on the generator) |
|
TpAtmTrafficSwitchoverTimeEvaluation. java |
Meassure the switch over time on the cell loss basis (CBR only) |
Listed test procedures are generic in the means that they work as well with ATS test equipment.
Remark: shown are only most important classes and interfaces for visibility!
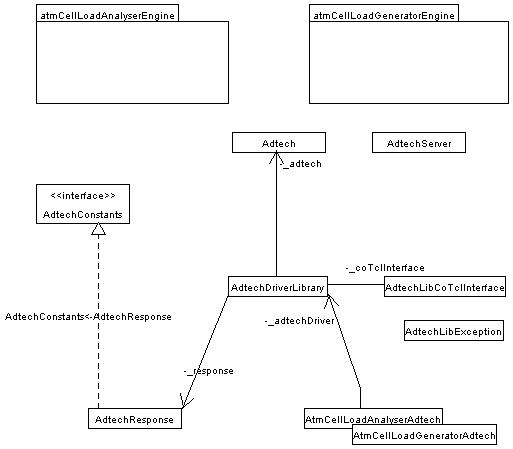
The class diagrams will be updated regulary the figure above is erroneous due to the problem with the reverse ingeeniring in Poseidon for UML (there is a missing reference between the AtmCellLoadgeneratorAdtech and the AdtechDriverLibrary) !
Remark: shown are only most important classes and interfaces for visibility!
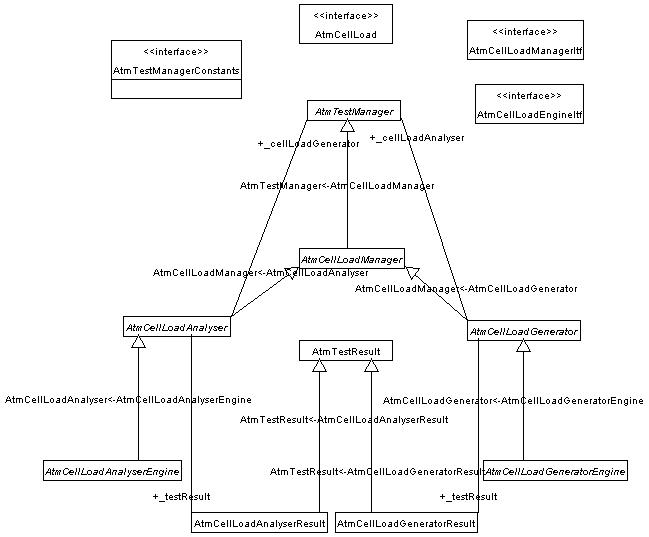
The class diagrams will be updated regulary!
There are two new managers developed for the distributed client-server setup over CORBA:
AtmCellLoadAnalyserEngine
AtmCellLoadGeneratorEngine
The name of these manager is like a key for names of related Java classes and packages.
That's to say for the AtmCellLoadAnalyserEngine
The test procedure uses following tester's test equipment manager class:
pegasus. testEquipmentManager. network. atm. AtmCellLoadAnalyserEngine. java
This class acts like an interface from the test procedure level to the corba client test equipment manager. It holds an reference to the CORBA object (this reference is named _manager or _servant).
The CORBA interface description (. idl file) and CORBA client classes are located in package:
pegasus. testEquipmentManager. network. atm. corba. atmCellLoadAnalyserEngine
Note: In this package only the . idl file is edited. All the other classes are generated automatically by the CORBA plugg-in of Netbeans.
The test equipment specific CORBA implementation and test equipment specific implementation of the AtmCellLoadAnalyserEngine itself is located in package:
pegasus. testEquipment. adtech. atmCellLoadAnalyserEngine
The java main class 'pegasus. testEquipment. adtech. AdtechServer. java' is the server for all the test equipment managers running on a specific test equipment. It starts all the factories and registers them to the COS Naming Server (which is running anywhere in the net).
There is one factory per test equipment manager. These factories are used for creating a new 'Servant' for a certain test equipment manager (i. e AtmCellLoadAnalyserEngine). The following statement in a test procedure causes to create a servant using the proper factory and to register the servant to the COS Naming server:
TestEquipment te = _system. getTestEquipment('Tester1');
AtmCellLoadAnalyserEngine mgr = ((AtmCellLoadEngineItf)_tester). newAtmCellLoadAnalyserEngine();
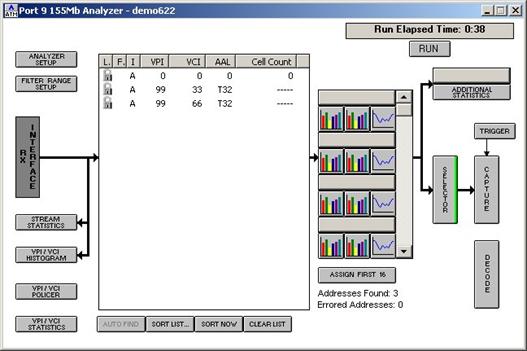
Let assume we want to setup two cell distribution models each having it's own VPI/VCI combination driven by the Adtech STM1 155Mb card for generating the load with 2000 cells/s.
Working with the Adtech GUI application following minimal setup shall be performed:
1. Generator:
To achive this following configuration shall be performed:
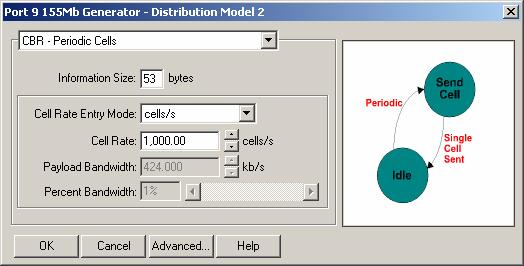
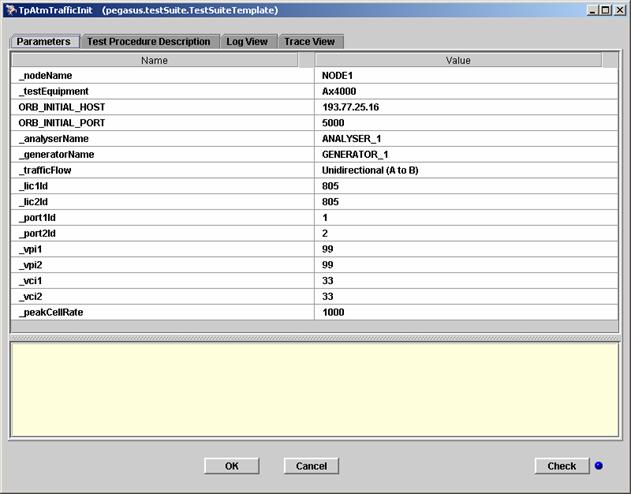
Set up first distribution model with the VPI/VCI = 99/33, CBR, Peak Cell Rate = 1000 cells/s.

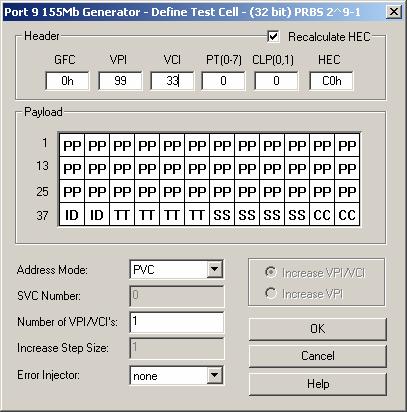
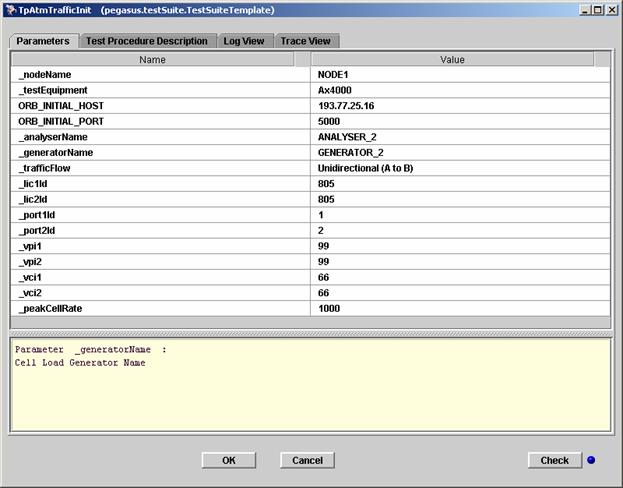
Set up second distribution model with the VPI/VCI = 99/66, CBR, Peak Cell Rate = 1000 cells/s.

2. Analyser
Set up the VPI/VCI streams to be analysed.
To be able to run the ATM Cell Load Generator/Analyser test equipment manager using the Adtech AX/4000 without CORBA, the following installation steps have to be followed:
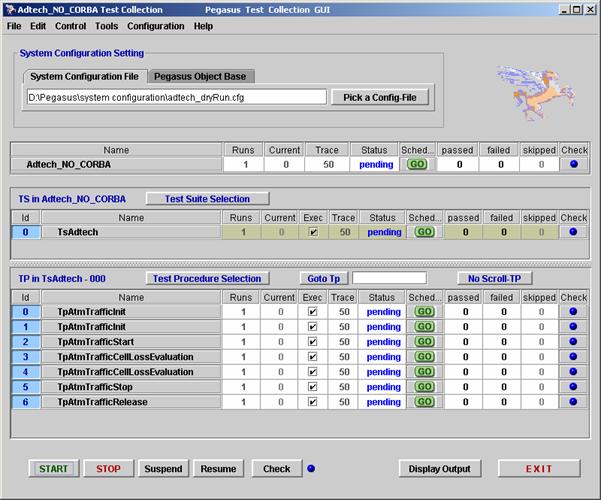
To run Adtech Test Equipment with Pegasus, execute following steps:
Start Pegasus
Open the Test Suite containing the test procedures driving the Adtech test equipment (Adtech_NO_CORBA. xml)
Start the Test Suite (Adtech_NO_CORBA. xml)
IMPORTANT: ATM test procedures are designed on the way that they are capable to work with or without CORBA. At least one of two CORBA related parameters ORB_INITIAL_HOST and ORB_INITIAL_PORT must be set to EMPTY string for proper local configuration!
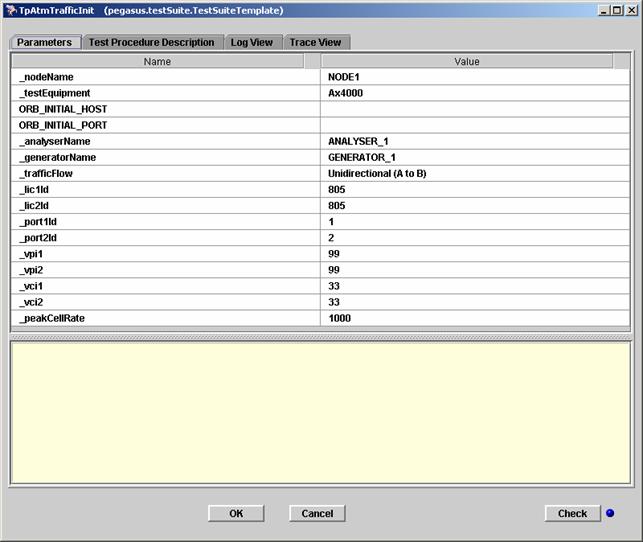
Please refer to following configuration of initialization procedures:
1. Initializion of first cell distribution (GENERATOR_1/ANALYSER_1)
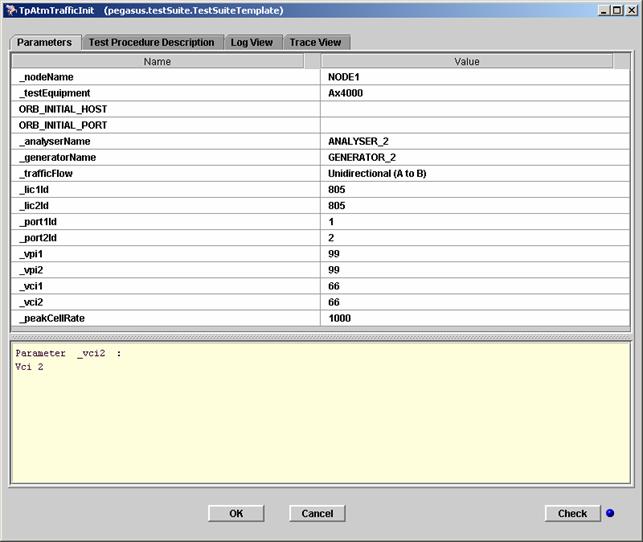
2. Initializion of second cell distribution (GENERATOR_2/ANALYSER_2)
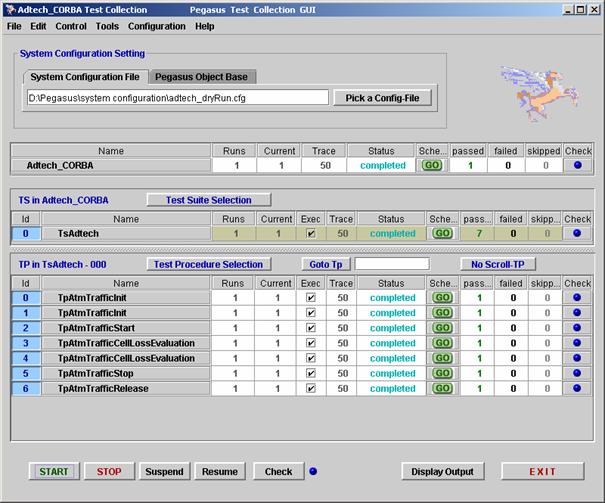
When configuration is set up properly start the test by pressing the START button.
Wooow!!! A beautiful view on the Pegasus GUI when everything works as expected:
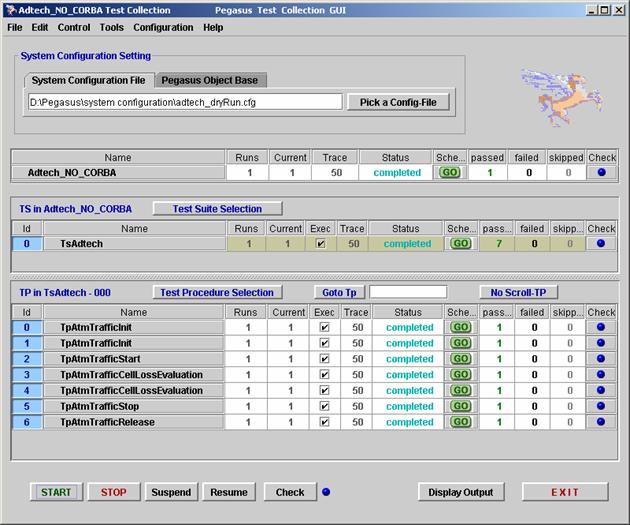
Please refer to the following log and trace files for reference:
Trace file:

CAUTION: Without starting and configuring the Adtech AX/4000 test equipment properly the ATM Cell Load Generator/Analyser Test Equipment managers will never work. This means all Adtech modules (Cards) being used by the Pegasus test equipment managers have to be configured and started.
To be able to run the ATM Cell Load Generator/Analyser test equipment manager using the Adtech AX/4000 over CORBA, the following installation steps have to be followed:
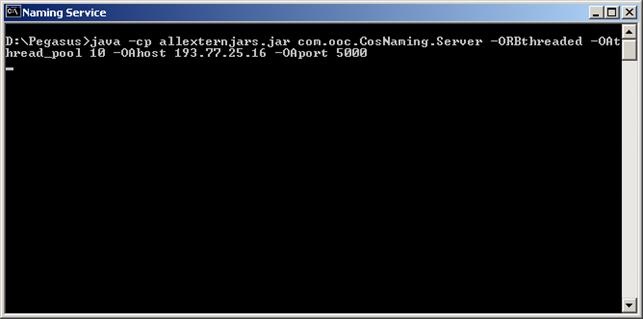
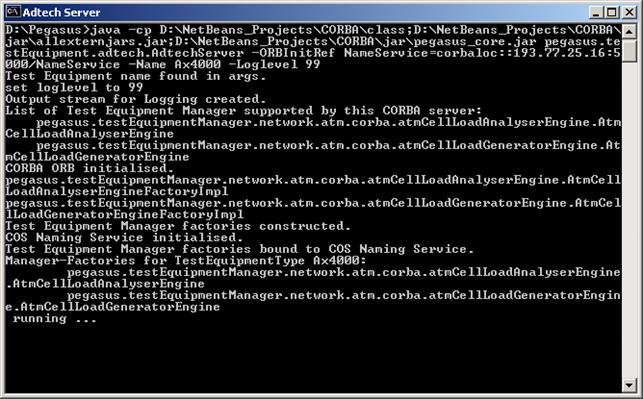
To run the Adtech server, execute the following steps:
Note:
The IP address and port number given by this command line has to refer to host and port the CORBA naming service is running on.
The example above shows the setup for testing on a local host: if you are intending to access the Naming Server started somewhere in the network, a valid external IP address of the machine must be provided.
Further ensure the name of the test equipment referes to an entry in the system configuration file.
Also ensure that the AdtechServer main-class is found in the Java's class path.
To run Adtech client, execute following steps:
Start Pegasus
Open the Test Suite containing the test procedures driving the Adtech test equipment (let's call it adtech. ts)
Start the Test Suite (adtech. ts)
To drive the Adtech AX/4000 Test Equipment with Pegasus following prerequisites must be assured:
Naming Service running
Adtech Server running
Proceed with following steps:
Start Pegasus
Open the Test Suite containing the test procedures driving the Adtech test equipment (let's call it adtech. ts)
Start the Test Suite (Adtech_CORBA. xml)
The cell distribution models are simulated with virtual generators and analysers. Basically exacltly one virtual generator/analyser pair corresponds to one particular distribution model.
Please note that there is only one generator and analyser pair per Adtech interface card existing. So called virtual generator/analyser pairs are simulation of different distributions on the generator side and corresponding monitors of the VPI/VCI combibnations on the analyser side.
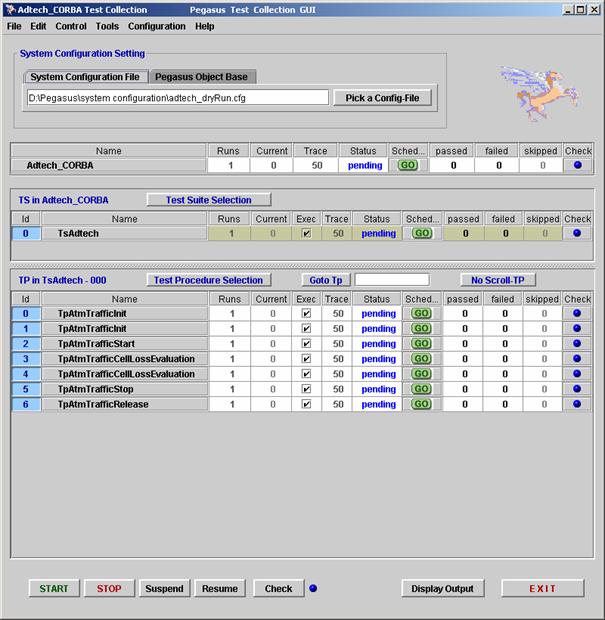
The figure below shows the proper configuration of the Pegasus Test Suite:
The parameters of the initialization test procedures must be set up as shown bellow:
1. Initializion of first cell distribution (GENERATOR_1/ANALYSER_1)
Following aspects must be taken in consideration:
Specified LIC cards (Node 36190) with ports must be specified in the System Configuration file: these are the LICs with ports the physical connections from Adtech AX/4000 test equipment are set up to
Physical connections between the Adtech AX/4000 tester and the Node's LICs must be as well provided in the System Configuration file
Note: The dependancy pointed out above is subject of discussion and possible change in the future!
Remark: Both CORBA parameters (ORB_INITIAL_HOST and ORB_INITIAL_PORT of the CORBA Naming Service) that are temporary incorporated (due to the current version of Adtech Parser that needs some enchancements to support this parameters in the configuration file) will be removed from the initialization test procedure .
1. Initializion of second cell distribution (GENERATOR_2/ANALYSER_2)
Starting, stopping and evaluation of the traffic with special test procedures like TpAtmTrafficCellLossEvaluation. xml is done by referencing particular distribution (virtual generator/analyser pairs).
After proper configuration the test is performed by pressing the START button.
Can life be better? A beautiful view on the Pegasus GUI when everything works as expected:
Please refer to the following log and trace files for reference:
Adtech Server

Adtech Client

An example of current Adtech System Configuration section is shown below:
|
Slot2 Slot3 Slot4 Slot5 Slot6 Slot7 Slot8 } } } Physical Links |
Please keep in mind that the structure is currently subject of changes. The XML format has been introduced and we are working on porting the data to the XML format. As well two new attributes will be introduced for CORBA support.
Great feature called dry run was introduced to the Adtech test equipment object model.
It provides the possibility to run the equipment without being connected to real hardware. The responses are hard coded.
You can simply switch to the dry run by setting the UserID parameter to DryRun
|
{ Adtech { IP Address: 139. 21. 120. 122 UserID: DryRun SW/HW Version: CLIB 4. 32 Adtech System Resources: D:AXClib432bios Slot Configuration { Slot1 Slot2 Slot3 Slot4 Slot5 Slot6 Slot7 Slot8 } } } Physical Links |
The traces embeded in this document are result of the dry run!
Adtech XSD schema is defined as follows:
|
<?xml version = '1. 0' encoding = 'UTF-8'?> <!-- edited with XMLSPY v5 rel. 4 U (https://www. xmlspy. com) by David Bati (Iskratel Ltd) --> <!--W3C Schema generated by XMLSPY v5 rel. 4 U (https://www. xmlspy. com)--> <xs:schema targetNamespace = 'https://intra1. icm. siemens. de/networks/pegasus/ systemConfiguration/testEquipment/adtech/' xmlns = 'https://intra1. icm. siemens. de/networks/pegasus/ systemConfiguration/testEquipment/adtech/' xmlns:com = 'https://intra1. icm. siemens. de/networks/pegasus/ systemConfiguration/common/' xmlns:xs = 'https://www. w3. org/2001/XMLSchema' elementFormDefault = 'qualified' attributeFormDefault = 'unqualified'> <xs:import namespace = 'https://intra1. icm. siemens. de/networks/pegasus/ systemConfiguration/common/' schemaLocation = '. . /. . /. . /xmlSchema/commonElements. xsd'/> <xs:element name = 'adtech'> <xs:complexType> <xs:sequence> <xs:element ref = 'com:ipAddress'/> <xs:element ref = 'com:user'/> <xs:element ref = 'com:version'/> <xs:element ref = 'com:initialisation'/> <xs:element ref = 'com:cosNamingService'/> <xs:element name = 'adtechConfiguration'> <xs:complexType> <xs:sequence> <xs:element ref = 'com:slots'/> </xs:sequence> </xs:complexType> </xs:element> </xs:sequence> </xs:complexType> </xs:element> </xs:schema> |
Example of a XML system configuration file with Adtech Test Equipment:
|
<?xml version = '1. 0' encoding = 'UTF-8'?> <!-- edited with XMLSPY v5 rel. 4 U (https://www. xmlspy. com) by David Batic (Iskratel Ltd. ) --> <!--Sample XML file generated by XMLSPY v5 rel. 4 U (https://www. xmlspy. com)--> <systemConfiguration xmlns:xsi = 'https://www. w3. org/2001/XMLSchema-instance' xmlns:com = 'https://intra1. icm. siemens. de/networks/pegasus/ systemConfiguration/common/' xsi:noNamespace SchemaLocation = '. /pegasus/systemConfiguration/ data/network/node36190/xmlSchema/ node36190TestEnvironment. xsd'> <systemUnderTests> <systemUnderTest> <name>NODE1</name> <type>NODE_PARSER_36190_XML</type> <sutData> <node36190 xmlns = 'https://intra1. icm. siemens. de/networks/pegasus/ systemConfiguration/systemUnderTest/ network/node/node36190/'> <name>SGSN_Network_Element</name> <hostName>g56</hostName> <com:ipAddress>139. 21. 185. 180</com:ipAddress> <com:version>ucr_sc2</com:version> <apsVersion>v3440</apsVersion> <defaultAccess>webcli</defaultAccess> <interfaces> <webcli xmlns = 'https://intra1. icm. siemens. de/networks/pegasus/ systemConfiguration/interfaces/webcli/'> <com:user>pegasus</com:user> <com:password>Pegasus01</com:password> <com:ipAddress>139. 21. 185. 161</com:ipAddress> <networkElement>G56</networkElement> <userGroup>SC Administrators</userGroup> </webcli> <nsimq3 xmlns = 'https://intra1. icm. siemens. de/networks/pegasus/ systemConfiguration/interfaces/nsimq3/'> <com:ipAddress>0. 0. 0. 0</com:ipAddress> <metafile>v4030</metafile> <com:user>username</com:user> <com:password>siemens</com:password> </nsimq3> </interfaces> <mpus> <mpu name = 'MP1'> <rack>BAS_RACK</rack> <shelf>9</shelf> <pitchMpu0>299</pitchMpu0> <pitchMpu1>319</pitchMpu1> <boardType>mpud</boardType> <loadType>TSA00001</loadType> <id>1</id> </mpu> </mpus> <asn> <gmx name = 'GMX1'> <rack>BAS_RACK</rack> <shelf0>7</shelf0> <shelf1>5</shelf1> <pitch>141</pitch> <accgid>2</accgid> <asnsmid>2</asnsmid> <gmxid>0</gmxid> </gmx> <se name = 'SE0'> <rack>BAS_RACK</rack> <shelf>7</shelf> <pitch>241</pitch> <asnid>0</asnid> <accgid>2</accgid> <asnsmid>1</asnsmid> </se> <se name = 'SE1'> <rack>BAS_RACK</rack> <shelf>5</shelf> <pitch>241</pitch> <asnid>1</asnid> <accgid>2</accgid> <asnsmid>1</asnsmid> </se> </asn> <amxs> <amx name = 'AMX1'> <rack>BAS_RACK</rack> <shelf>9</shelf> <pitchAmxSm0>159</pitchAmxSm0> <pitchAmxSm1>221</pitchAmxSm1> <pitchAccg0>179</pitchAccg0> <pitchAccg1>201</pitchAccg1> <accgid>1</accgid> </amx> </amxs> <cards> <card name = 'LIC805'> <rack>EXT_RACK</rack> <shelf>3</shelf> <pitch>163</pitch> <boardType>lic155d</boardType> <signalMode>stm1</signalMode> <id>805</id> <redundancy group = '44' type = 'board1plus1'/> <ports signal = 'stm1os'> <port name = 'PORT1' tcAdaptorId = '33'/> <port name = 'PORT2' tcAdaptorId = '34'/> </ports> </card> </cards> </node36190> </sutData> </systemUnderTest> </systemUnderTests> <testEquipments> <testEquipment> <name>Ax4000</name> <type>TEST_EQUIPMENT_PARSER_ADTECH_XML</type> <teData> <adtech xmlns = 'https://intra1. icm. siemens. de/networks/pegasus /systemConfiguration/testEquipment/adtech/'> <com:ipAddress>139. 21. 185. 237</com:ipAddress> <com:user>DryRun</com:user> <com:version>CLIB V432</com:version> <com:initialisation>d:adtechclib432bios</com:initialisation> <com:cosNamingService> <com:ipAddress>127. 0. 0. 1</com:ipAddress> <com:port>5000</com:port> </com:cosNamingService> <adtechConfiguration> <com:slots> <com:slot name = 'Slot1' type = 'OC3cmmAx4000_No400305'/> <com:slot name = 'Slot2' type = 'E3Ax4000_No400303A'/> <com:slot name = 'Slot3' type = 'OC3cmmAx4000_No400305'/> <com:slot name = 'Slot4' type = 'empty'/> <com:slot name = 'Slot5' type = 'empty'/> <com:slot name = 'Slot6' type = 'empty'/> <com:slot name = 'Slot7' type = 'empty'/> <com:slot name = 'Slot8' type = 'empty'/> </com:slots> </adtechConfiguration> </adtech> </teData> </testEquipment> </testEquipments> <physicalLinks> <physicalLink> <name>Adtech1</name> <type/> <plData xmlns = 'https://intra1. icm. siemens. de/networks/pegasus/ systemConfiguration/physicalLinks/'> <node> <name>NODE1</name> <lic>LIC805</lic> <port>Port1</port> </node> <testEquipment> <name>Ax4000</name> <lic>Slot1</lic> <port>Port1</port> </testEquipment> </plData> </physicalLink> <physicalLink> <name>Adtech2</name> <type/> <plData xmlns = 'https://intra1. icm. siemens. de/networks/pegasus/ systemConfiguration/physicalLinks/'> <node> <name>NODE1</name> <lic>LIC805</lic> <port>Port2</port> </node> <testEquipment> <name>Ax4000</name> <lic>Slot1</lic> <port>Port2</port> </testEquipment> </plData> </physicalLink> </physicalLinks> <properties/> </systemConfiguration> |
|
Politica de confidentialitate | Termeni si conditii de utilizare |

Vizualizari: 2463
Importanta: ![]()
Termeni si conditii de utilizare | Contact
© SCRIGROUP 2026 . All rights reserved