| CATEGORII DOCUMENTE |
| Asp | Autocad | C | Dot net | Excel | Fox pro | Html | Java |
| Linux | Mathcad | Photoshop | Php | Sql | Visual studio | Windows | Xml |
Different chart types can convey very different messages with the data, as you saw earlier in this lesson. If the message isn't quite right, try a different chart type.
The Chart toolbar has an abbreviated list of chart type choices you can choose from. Select the chart, open the Chart Type drop-down list on the Chart toolbar, and select another type, as shown in Figure 5-10.
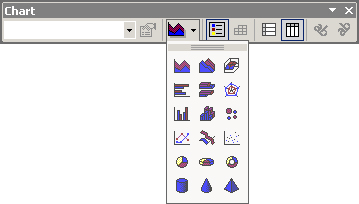
Figure 5-10: Change to one of these common chart
types quickly from the toolbar.
If the type you want doesn't appear there, you can access the full list of types again by selecting the chart and then choosing Chart > Chart Type. That's the same as Step 1 of 4 was when you used the Chart Wizard to create the chart.
WARNING
When you change chart types, be careful to stick with a type that is
appropriate for your data. For example, a pie chart has a single data series
only. It's okay to switch it to a bar or column chart, but that chart will show
only one color of bar (that is, only one series). If you're starting with a
multiseries chart, such as a bar chart with several colors of bars, you can't
change to a pie chart without losing some of that data. The pie chart will
contain only the data from the first series
To revisit the Step 3 of 4 portion of the chart-creation process, choose Chart > Chart Options. Recall that this is where you enter the data labels, specify the legend positioning, and choose what titles will appear.
For example, suppose you have changed from a pie chart to a bar chart, and now you have vertical and horizontal axes in the chart that you didn't have before. You want to label them. To do so, you could choose Chart > Chart Options and enter the labels on the Titles tab.
Some chart elements, such as titles and legends, can be removed from the chart by selecting them and pressing Delete. Others can be removed only from the Chart Options box by clearing their checkbox or text box.
On the Legend tab, you can specify a placement for the legend (Top, Bottom, and so on). However, you can do basically the same thing by manually dragging the legend box around on the chart. You can do the same with titles -- just drag them around as you would any graphic object.
Each text element of the chart (data labels, titles, axes labels, and so on) can be formatted separately. To change the size of text, do the following:
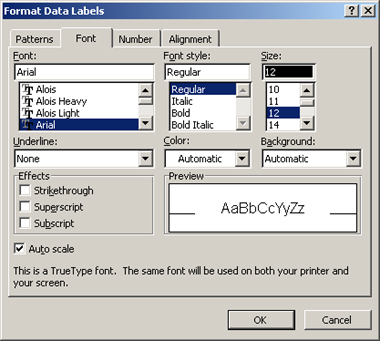
Figure 5-11: Change the font for an element of the
chart.
You can select the legend and drag a selection handle on its outside to resize it, but this resizes only the frame; the text inside stays the same. You must resize its text as previously explained.
If the chart is floating on a worksheet, you can resize it by selecting its frame and dragging its selection handles. This changes its size in relationship to the surrounding data. You can also zoom in and out (on the Standard toolbar or with the View > Zoom command) to change the overall view of the data onscreen.
If the chart is on a separate sheet, you can't change its size, but you can you can change its onscreen size with the Zoom control.
The chart area is the entire chart; it's what's in the chart frame that floats on the worksheet or what sits on its own tab in the worksheet. It includes not only the charted data itself, but also the legend, the chart title (if any), and so on.
In contrast, the plot area is just the plotted data. It's a smaller frame inside the chart area. The plot area can be resized within the chart frame; this can be useful if you want the chart to appear larger or smaller but the overall space taken up by the chart frame to remain the same.
If you're in doubt about its location, hover the mouse pointer over a part of the chart and a ScreenTip pops up to tell you its name. In Figure 5-12, for example, the plot area is selected and a ScreenTip refers to it.
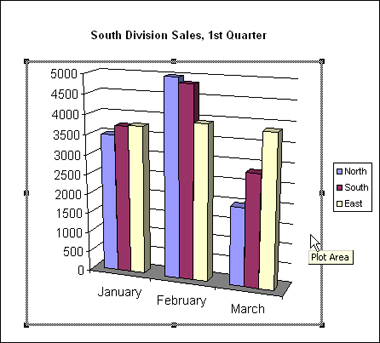
Figure 5-12: The plot area is inside the larger
expanse of the chart area.
|
Politica de confidentialitate | Termeni si conditii de utilizare |

Vizualizari: 1181
Importanta: ![]()
Termeni si conditii de utilizare | Contact
© SCRIGROUP 2025 . All rights reserved