| CATEGORII DOCUMENTE |
| Asp | Autocad | C | Dot net | Excel | Fox pro | Html | Java |
| Linux | Mathcad | Photoshop | Php | Sql | Visual studio | Windows | Xml |
![]()
Microsoft Excel
Product Enhancements Guide
Published: October 1996 For the latest information, please see www.microsoft.com/office/
|
Turn your numbers into answers. |
New and Improved Features in Microsoft Excel 97
Table of Contents
Making Microsoft Excel More Discoverable and Easier to Use
Basic Operations
Formula Creation
Printing and Formatting
Charting
PivotTables
Take Advantage of Increased Connectivity
Workgroup
Web Navigation and Searching
Online Publishing
Online Data Retrieval
Create Better Solutions
Appendix A
New Events Available in Microsoft Excel 97
Appendix B
PivotTable Programmable Objects, Methods, and Properties
Microsoft Excel has a tradition of providing the most complete set of analysis tools in a spreadsheet. However, many of these tools seem daunting to users. Microsoft Excel 97 lowers the barrier between the user and the core functionality of the spreadsheet by simplifying existing features and adding new tools that help the user work faster and smarter. Basic operations are simpler, writing formulas is less intimidating, printing and formatting are less time consuming, and chart creation and editing is much easier.
Microsoft Excel users have consistently told us that they want to take advantage of the time saving tools within the application without learning too many steps or processes. Microsoft Excel 97 has become an even better member of the Microsoft Office family by making basic, everyday tasks simpler and more consistent. Microsoft Excel takes advantage of the many tools that are shared across Microsoft Office applications so that common tasks such as getting assistance, navigation, and going back or repeating tasks are very similar and easy to use from one application to the other.
Discoverability is essential to Microsoft Excel users, and the new Office Assistant provides a central place for users to access help and get suggestions about using Microsoft Excel. The Assistant is an unobtrusive animated character that is an evolution of Microsoft Office 95's Answer Wizard. It is similar to the Answer Wizard in that it allows users to ask questions using their everyday language rather than industry "lingo." For example, in Microsoft Excel, a user can ask the Office Assistant how to apply formatting to spreadsheet data by asking, "how do I make my data look nice?" It provides advice on formatting and other related topics that the user may not have discovered. The Assistant observes the user's operations and provides hints and tips on how to complete the tasks better. The Office Assistant is integrated throughout Microsoft Office applications to help users learn and discover more efficient use of an application. For instance, the Office Assistant is integrated with the Chart Wizard so that it can provide tips and suggestions that will allow the user to create the chart they want the first time. Once selected, the Assistant describes each step in detail so that it's easy to understand and learn while working.
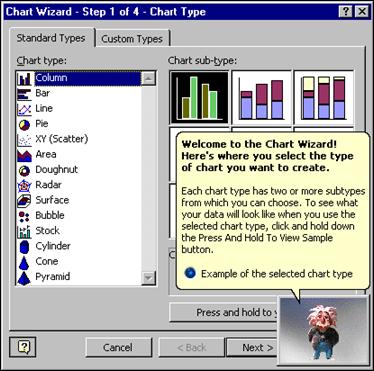
After the Office Assistant is selected, it gives a detailed explanation of how to use the Chart Wizard and offers examples for additional information.
The technology behind the Assistant's intelligent help capability and natural language assistance was developed in conjunction with the Decision Theory and Natural Language research teams at Microsoft. The Office Assistant analyzes the user's question using the Bayesian inference technique and matches it with the available online help information. Using the Office Assistant in Microsoft Office 97 makes computing tasks easier and quicker by providing useful assistance while the user works.
Navigating within a worksheet is one of the most common action employed by users. Vertical and horizontal scrolling by line or page accounted for the top 3 average operations per session according to Instrumented Version (IV) studies. Besides scrolling, users also tend to move between cells to enter, edit, or view data.
Although navigation is more common than printing or even saving, navigation functionality within spreadsheets has not evolved much since the introduction of Microsoft Excel. In particular, using scrollbars is a tedious operation, requiring a shift in focus from the data to the scrollbar.
In Office 97, Microsoft introduces the IntelliMouse . This new pointing device provides a wheel/button in the center of the mouse that allows for movement within a spreadsheet without requiring use of the scroll bar. By rolling the wheel in the center of the mouse, users can navigate in several ways:
AutoScroll up and down within their spreadsheet.
"Zoom out" for a bird's‑eye view of their worksheet.
Worksheet reduced to 40% of its normal size by using the IntelliMouse.
Pan through the sheet to traverse horizontally or vertically by holding down the wheel and moving the mouse.
![]()
Microsoft Excel 5.0 IV testing showed that 67% of users used the Undo command. In Microsoft Excel 97, this functionality has been extended, giving users a "safety net" when experimenting with formulas, formatting, charting, or other tasks. In Microsoft Excel 97, users can Undo and Redo multiple actions in a spreadsheet. Microsoft Excel 97 is the only spreadsheet that gives users the freedom to try anything safely.
The ability to accept range references from a dialog box is very useful and convenient for users. However, current dialog boxes hide the area a user might want to select. In order to reference spreadsheet data, users needed to drag the dialog box out of the way in order to select their data. In Microsoft Excel 97, edit boxes allow users to click a button to expand or collapse the dialog boxes. Clicking collapses the dialog box to a single line, making it easy to select data range information. After selecting the data range, a user can easily expand the dialog box to continue with the operation. This makes it convenient to select reference data without leaving the dialog box.
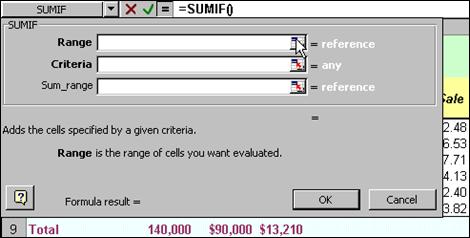
By clicking on the button with the arrow .
. the dialog box is collapsed, so data can be worked with easily. Later, the dialog box can be expanded by re‑clicking the same button.
Over 70% of users have some type of formulas in their spreadsheet. However, usability tests have told us that it's still difficult to build and track formulas. In addition, if a mistake is made while building a formula, the user is often perplexed by a cryptic error message that attempts to explain the error. Microsoft Excel 97 takes a quantum leap in working with formulas by making them simple to create, edit, correct, and track.
Microsoft research indicates that users often make the same types of typographical or syntax errors over again when creating formulas. For example, users often transpose cell references (such as entering 1A rather than A1) or add a double operator (such as A4++A5 instead of A4+A5) when building formulas. When users make mistakes, they are presented with a cryptic error message that does not help identify where the error was made or how to correct it. Microsoft Excel 97 introduces Formula AutoCorrect to automatically identify and suggest corrections for 15 of the most common formula errors. This makes it simple for even novice users to create formulas without knowing the "correct" spreadsheet syntax.
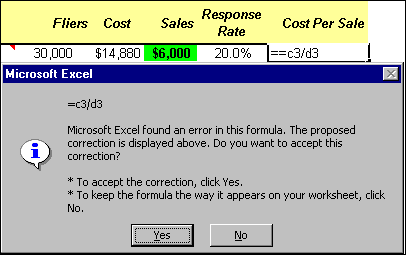
The following list shows the 15 most common formula errors spreadsheet users make, and how Microsoft Excel handles each correction.
|
Type of Mistake |
Microsoft Excel Corrections |
|
Unmatched closing/opening parentheses |
=SUMA3:D9) recommends |
|
Unmatched quotes |
=IF(A1>10,"yes", "no) recommends |
|
Reversed cell references |
=4A recommends |
|
Extra operators in the beginning of a formula |
== or =* or =/ recommends |
|
Extra trailing operators without operand |
=A4+B4+ recommends |
|
Double operators |
++ or // recommends |
|
Implied multiplication |
=A1+3(B3/100) recommends |
|
Replace letter X with * to indicate multiplication |
=7 X 8 recommends |
|
Extra decimal point |
=123.45.67 recommends |
|
Remove commas as separators |
=1,000 recommends |
|
Operator order |
User can type in => rather than >= |
|
Misplaced colon in range |
=SUM(B:2:C10) recommends |
|
Using semicolon instead of colon in range |
=SUM(D3;D10) recommends |
|
Extra space in cell address |
=SUM(A 1:B10) recommends |
|
Extra space between numbers |
=1 2 recommends |
Note that to maintain the integrity of a user's formula, Microsoft Excel confirms each correction before making it.
Usability tests show that users find it easier not only to create, but also read and understand another user's formulas if they are built using "real" langauge rather than alphanumeric cell references (e.g., a cell called January Sales is more intuitive than a cell called B2). In Microsoft Excel, users always had the option to use words in formulas instead of alphanumeric references, but they had to know how to apply "named ranges." Our IV data tells us that only 11% of even our most experienced users actually know how to name ranges and use them in formulas. In Microsoft Excel 97, this capability becomes more discoverable and automatic, as users can now build formulas using row and column labels and headings already on the worksheet without having to first create these named ranges.

Method 1: Explicit intersection that determines

Method 2: Implicit intersection that determines
In addition, Formula AutoCorrect works with Natural Language formulas so that any error made in formulas using row or column headings are identified and corrections recommended.
At present, it is a challenge for users to easily trace and adjust formulas. Microsoft Excel 97 now makes it easier by emloying color to simplify formula building and editing. When users double‑click on a cell containing a formula, colored frames appear around the range of cells that corresponds to different parts of the formula. Each range of cells within the formula is also color‑coded so that it is easy to distinguish which cells contribute to which parts of the formula.
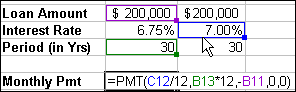
Identify and modify the selection using the Range Finder. By dragging the Interest Rate to the left .
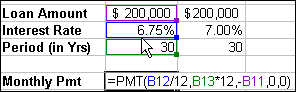
. the correct Interest Rate is referenced.
A user can also modify the dimensions of a range by grabbing and moving the frame or the frame handle at the bottom right of the color‑coded area. This updated range is automatically reflected in the formula, making it quick and easy to modify ranges. Range Finder helps a user understand formulas and quickly make changes to existing formulas.
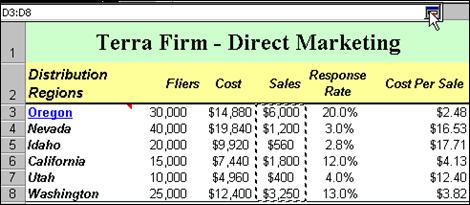
Range Finder can be used with charted data as well. Once a chart has been created, single‑click on a chart series and the corresponding data in the original worksheet is color‑coded with a frame. Any modifications made using the Range Finder are dynamically updated on the chart, making it easy to identify and change chart data very quickly.
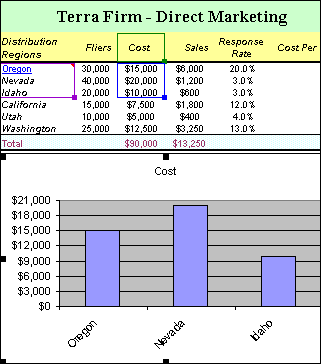
By dragging the Range Finder frame handle .
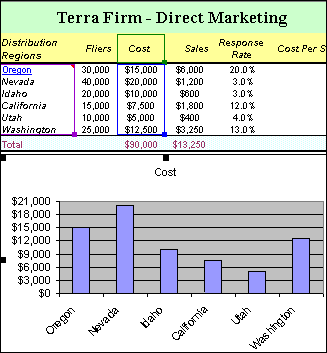
. the chart is updated automatically.
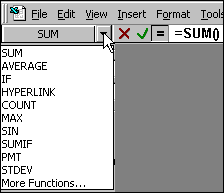
There are many tools within Microsoft Excel to help users build and edit formulas. However, many are not discoverable, and they are housed in different areas of the product. We find that most users are unaware of these tools; less than 25% try to access tools such as the formula bar. To address this problem, the Formula Palette combines the Function Wizard (to help users build formulas using Microsoft Excel's built‑in or user defined functions) and the Formula bar (to help users edit their formulas) into one useful and discoverable tool that rests right on the Formula bar. The Formula Palette provides easy access to a drop‑down menu with most popular and recently used functions (SUM, AVERAGE, IF, HYPERLINK, COUNT, MAX, SIN, SUMIF, PMT, STDEV). Using the Formula Palette, it's easier than ever to use functions and create formulas.
The way data is reported can have as much of an effect on the outcome of a project as the quality of the analysis. Microsoft Excel 97 takes much of the pain out of printing and formatting information by providing tools that give users precise control over their output and a greater range of options for displaying data.
Usage studies tell us that 95% of Microsoft Excel users print their documents, and IV studies tell us that "print" is the fifth most commonly used command following File Open, Copy, Save, and Paste.
Unlike a word processor, a spreadsheet is a large workspace containing a spatial layout of tables with supporting data with no distinct page breaks either horizontally or vertically. When printing, it is essential that the spreadsheet user have the capability to specify what information should be printed on which page.
Microsoft Excel 97 allows users to control what appears on each page using Page Break Preview Mode. This fully editable view displays the spreadsheet with page breaks and page numbers superimposed on it, showing users exactly what information will print on each page. Users can simply drag and drop vertical and horizontal page breaks or print area borders, or move items such as charts or tables onto or off of a particular page. Microsoft Excel automatically scales items to fit that page and resulting pages based on the user's command.
![]()

Users want to be able to easily spot trends or areas of concern in their data at a glance. In the past many users created complex macros to highlight cells that met a certain criteria by changing the cell color or background. For example, numbers that were less than 10% of forecast might be displayed in red as a warning sign to the reader. In Microsoft Excel 97, the new conditional formatting feature gives users this functionality through a simple dialog. Users can assign rules to ranges that change the formatting based on the value in a cell. For example, users might choose to use a "stoplight" chart (red for "danger," yellow for "caution," and green for "good condition") to highlight areas of interest so they don't have to read through all the data to find outliers.
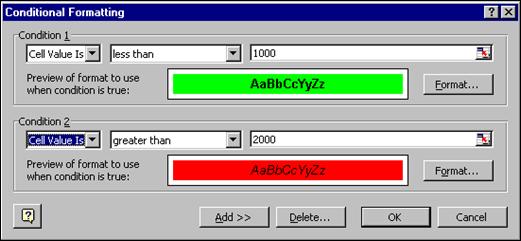
One can apply rules to a range of cells to identify .
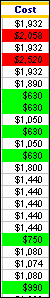
. areas of interest in red and green.
Using Conditional Formatting, users can apply their own formats to worksheets based on dynamic, data‑driven conditions. Conditional Formatting makes it easy for users to create rules by choosing options from the drop down menu.
Users have frequently requested formatting options that "go beyond the grid" of the traditional spreadsheet. Now Microsoft Excel provides Custom Cells that allow users to modify text and data in ways that go beyond conventional spreadsheet rules. For example, users can make the following changes to the way their data is displayed:
Rotate Text
In Microsoft Excel 97, users can freely rotate text within cells to any angle, saving horizontal space taken up by long column headings that are longer than the associated data. Rotated text gives a dramatic, professional effect to reports such as financial statements, sales forecasts, budget information, and inventory reports.
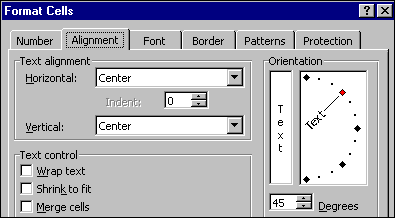
Microsoft Excel also automatically rotates any existing borders or fills to complement the angled text. In addition, users can now apply rotated text to save space when labeling charts.
Indent Text
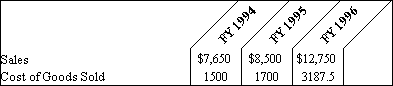
It is common to show hierarchy or "sub categories" in a worksheets such as a budget or an inventory list. Until now, our usability tests and customer visits showed users trying to create this effect by using narrow columns for each level in a list, hitting the space bar multiple times, or inserting spaces using CTRL‑ALT TAB. Not only were these methods time‑consuming, but they often left users with misaligned text when printing. In response, Microsoft Excel 97 now allows text to be aligned within cells easily with the click of a toolbar button. Anyone using Microsoft Excel 97 can indent text up to 16 steps in a cell.
Instead of using thin columns, one can indent up to 16 levels.
Merge Cells
Site visits have also shown that one of the common uses of Microsoft Excel is to create forms that replace paper equivalents or that act as database front‑ends. As users create more forms and text rich documents, the grid layout of the spreadsheet becomes more of a constraint.
Microsoft Excel 97 users can now merge two or more adjacent cells together to form a single cell that holds a single value. The merged cell acts like any other cell: it holds only one value, it can be moved, sized, or formatted, and it can be referenced in formulas. Merging cells makes it much easier to create attractive forms or tables in Microsoft Excel.
Merge Cells makes it easy to combines several columns into one without resizing the columns.
AutoSize Text
Spreadsheet usage studies show that data entry is the second most common operation performed on a worksheet, and frequently users enter fairly lengthy entries into a cell. Often, users do not wish to have especially wide columns, and would rather have their text "fit" within their specified column width. This is especially true in Far Eastern languages where many forms and tables have cell entries that are manually reduced in font sizes. In Microsoft Excel 97, AutoSize Text will allow users to enter text while Microsoft Excel automatically resizes fonts to fit the determined column width. This assures the user's text is always visible without using valuable spreadsheet real estate.
Microsoft Excel usage studies show that approximately 85% of users apply charts to their data. With this focus, the Microsoft Excel team decided to make it even easier to create and modify charts by offering a simpler user interface, better control of charting and formatting options, more chart types, and richer formatting options to help users better illustrate their numbers.
According to a Microsoft Excel 5.0 Usage Study, 70% of users invoke the Chart Wizard when creating a chart. Until now, there were charting options and formatting tools that could not be accessed from the wizard. Microsoft Excel 97 has consolidated all of the user's chart building and modifying options into one streamlined wizard, allowing users to create the chart they want the first time. In addition, the Office Assistant is well integrated with the Chart Wizard, to provide step‑by‑step advice and assistance.
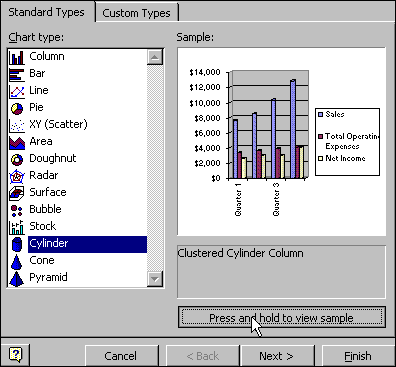
Step 1: Shows different chart types with preview option.
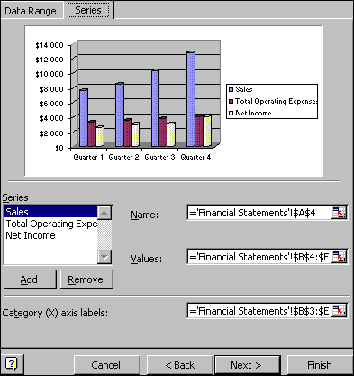
Step 2: Defines data series and cell references.
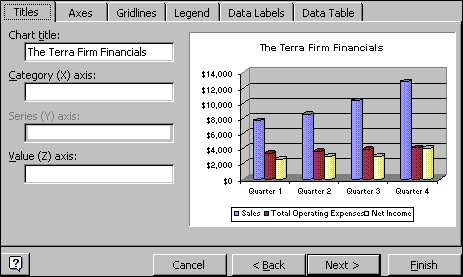
Step 3: Displays various charting options (e.g., title, legend, and so on).
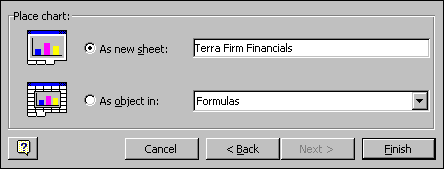
Step 4: Specifies chart location.
In the past, once the user finished with the wizard, revisiting certain chart options and settings was very difficult. These commands were scattered across different menus, often with a different user interface than what was initially displayed in the wizard. Microsoft Excel 97 provides a unified Chart Menu that takes the user back to the same exact dialogs they used in the wizard. Users no longer have to learn separate ways of working when creating and modifying charts.
In Microsoft Excel 97, the Charting toolbar has been enhanced to contain all the controls for modifying a chart in a single location - again streamlining the charting process. A new drop‑down selection menu on the Charting toolbar allows users to select format and chart types, display a legend, insert a table, change table orientation, or rotate text labels. An intelligent format button brings up the correct formatting dialog for whatever chart element is selected at the time.
![]()
In previous versions of Microsoft Excel, Tool Tips provided users with a brief, highlighted description of a particular icon or action. Microsoft Excel 97 has extended this same technology to charting. As a user's mouse hovers over a section of a chart, Chart Tips provide visual feedback for the user to provide him with the name and value of the charting element. This makes it easier for users both to learn the chart lexicon and to easily select the point or element they need when formatting.
Currently, we find users have a difficult time selecting portions of their chart for modifications; they must double‑click to activate the chart, then click multiple times to select the portion of the chart they want to modify. Single Click Selection now allows users to click once to activate the chart and select any item or object. This method is more intuitive and less confusing than double‑clicking, making it easier than ever for users to work with data on their chart.
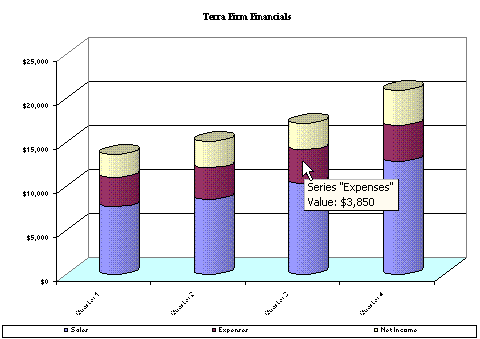
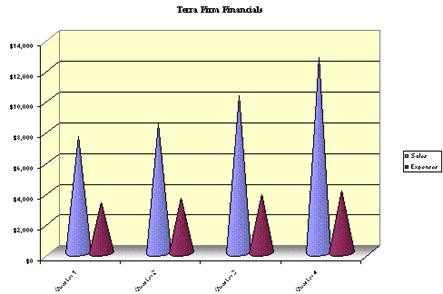
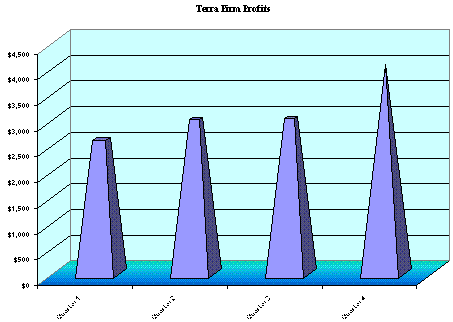
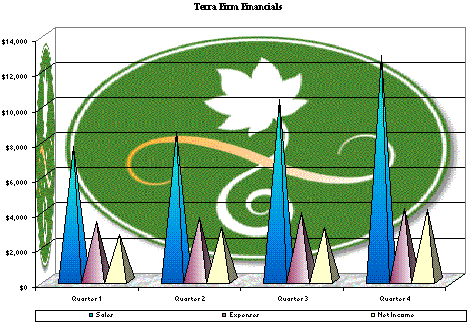
New 3‑D Shapes - Pyramid, Conical, and Cylindrical
Currently, Microsoft Excel charting offers a variety of chart types. However, users have asked for even more options that give flexibility and variety for report their data.
Microsoft Excel 97 offers additional chart types for effective presentations, including three‑dimensional cylindrical, pyramid, and cone shapes. Users can control whether all pyramid and cone columns taper to a point or taper to the highest value in the chart. This provides a clear graphical comparison of values in a chart, and makes them aesthetically appealing.
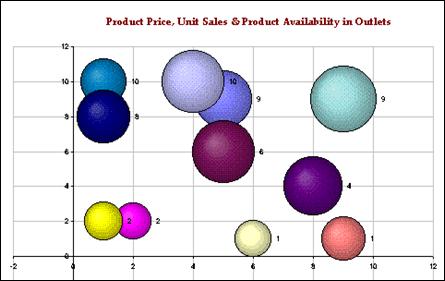
Bubble Charts
Bubble charts are commonly used to display market research and financial data, and have been added as a result of the high number of requests on our Microsoft Excel Wish line. A Bubble Chart is similar to an xy scatter chart, but allows users to add an additional dimension of data to their chart represented by the size of each data marker in the chart. One column or row of data defines the x categories, the second one defines the y values, and final column or row defines the bubble sizes, or a circle or sphere drawn at each x,y coordinate.
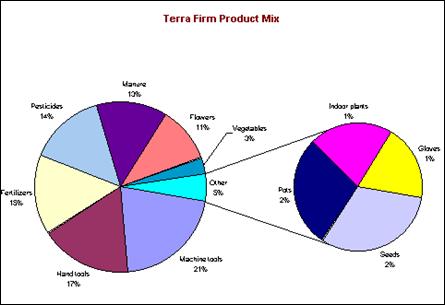
Pie of Pie or Bar of Pie Charts
The ability to create more flexible pie charts was within the top 10 customer requests for charting. Pie charts are great at showing the relationship among proportions of a whole and emphasizing significant elements in a data series. However, it is often difficult for users to display several data points that are considerably smaller than the rest of the pieces. These small value slices are often overshadowed by the larger ones and become indistinguishable. In response, Microsoft Excel now allows users group the small slices together in the main pie, and create a new pie (or stacked column) that contains only the small slices. Microsoft Excel 97 contains Pie of Pie or Bar of Pie which make pie charts more flexible by allowing users to "explode" a slice from one pie chart into second, smaller pie (or bar) chart automatically. They can customize the slices that make up the second pie (or bar) by dragging and dropping the slices from the first pie to the second. All the data labels associated with the pie (or bar) slices are resized when they are moved. In addition, the leader lines for the data labels will move and will keep the label and slice connected.
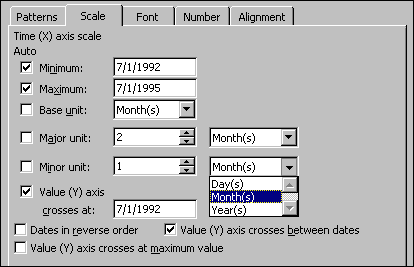
User research showed that many charts include time indexed data. Whether it was company revenue, stock prices, or inventory, time was the most common dimension for measuring changes in data. Microsoft Excel 97 now provides a special axis format for charts based on a time scale. Microsoft Excel interprets time‑based data as linear, ordered set, and plots points appropriately on an axis that is spatially correct. Time‑scale axes allows for easy, automatic grouping of data (e.g., data by month, instead of by day) by modifying the format axis scale.
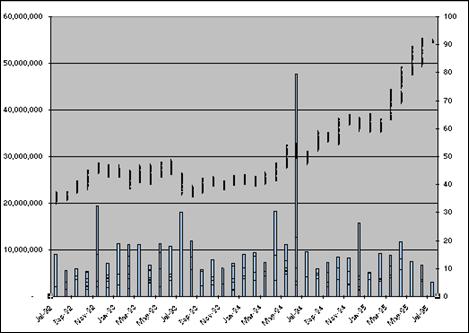
By changing the scale, Stock Volume chart is plotted by months.
Time scale is available on two‑ and three‑dimensional Area, Bar, Column, and Line charts, and three‑dimensional Surface charts.
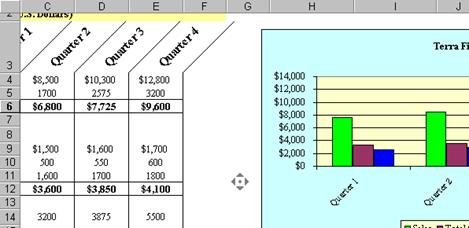
Users often want to streamline their reports by displaying both a chart's graphic representation, and its corresponding source values in a single location. Microsoft Excel 97 now allows users to add a simple grid, or "Data Table," containing the values corresponding to the chart right below the chart's plot area.
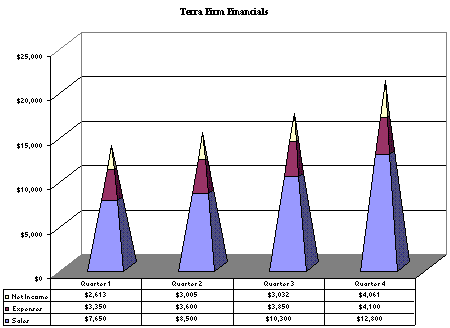
Users can add Chart Data Tables to any two‑or three‑dimensional Area, Bar, Column, or Line charts. Chart Data Tables make it easy for anyone to look at the source data and the graphic representation of that data in one place.
Microsoft Excel 97 now makes it possible to create high‑end graphical output by integrating with the Microsoft OfficeArt drawing layer. This integration with OfficeArt allows Microsoft Excel to take advantage of new drawing objects that provide powerful graphics. Users can now easily insert a picture on a chart object, add textured fills to the chart object, or display a different shades of color to a chart series that allows users to create visually appealing charts.
Using Picture, Texture, and Gradient fill options in Microsoft Office Art, one can easily create a compelling chart.
Users can also format the fill of chart walls, floors, and the faces of two‑ and three‑dimensional charts with pictures, textures, or semi‑transparent fills. Integration with OfficeArt offers Microsoft Excel users additional capabilities to create high‑end graphics.
Microsoft introduced PivotTables in Microsoft Excel 5.0 as an interactive report that displays summarized data. By simply dragging and dropping column headings, users were able to easily view different dimensions in their data. In Microsoft Excel 97, enhancements to PivotTables make a strong analysis tool even more powerful and include extensions to functionality that should make PivotTables relevant to a wider audience.
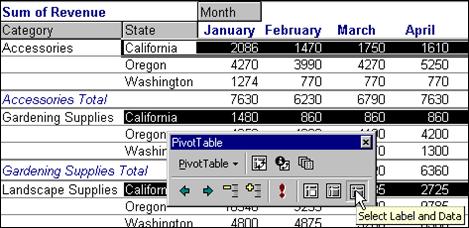
During customer site visits, Microsoft observed that users were looking for a way to select PivotTable data based on underlying structure in their data. This ability would allow them to more easily track and highlight similar information, and to spot key data points in a large volume of data. In Microsoft Excel 97, users can choose PivotTable areas or data based on the data's structure (i.e., an item or field) in three stages: Data Labels, Labels, and Data.
Only the data
associated with
Now users can easily select different parts of the data associated with each item or field before performing another action, such as formatting or analysis.
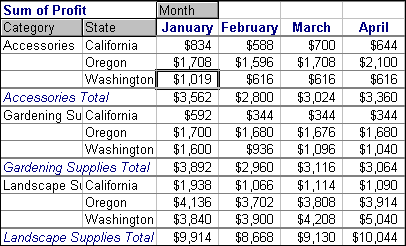
Users often applied formatting options to their PivotTable and wanted them to remain intact when pivoting or refreshing data. This ability would make it easier for users to identify data series as they drag and drop column headings to rearrange their reports. In response, Microsoft Excel 97 includes Persistent Formatting in PivotTables. Now, formatting remains in tact through pivots and refreshes. Creating custom PivotTable formats has never been easier.
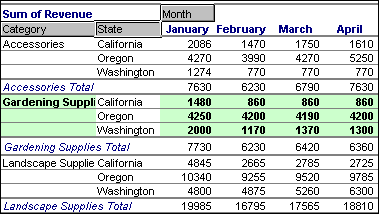
Custom formatting (Bold, Green background) was applied to Garden Supplies.
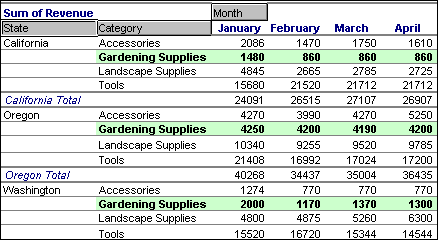
As State is pivoted to the left of Category, the custom formatting of Garden Supplies is retained.
PivotTables were originally designed as a tool for reporting and analyzing data. However user research showed that many PivotTable users wanted to use the tool for modeling and forecasting as well and were creating formulas and calculations that referenced PivotTable data. However as soon as the user "pivoted" the data, the formula reference was lost.
Microsoft Excel 97 overcomes this limitation by allowing users to build formulas using data in a PivotTable and store them as calculated fields and items. For example, a user can now create a new field called Profit Margin defined as (Revenue‑Cost)/Revenue, where Revenue and Cost are existing fields. Besides fields, calculated items can be used to derive new items for your PivotTable (e.g., West = .5*East). This allows users to more easily perform simple modeling or ad‑hoc analysis with data from the PivotTable. Once created, these new fields and items become part of a PivotTable and can be manipulated along with the rest of the table.
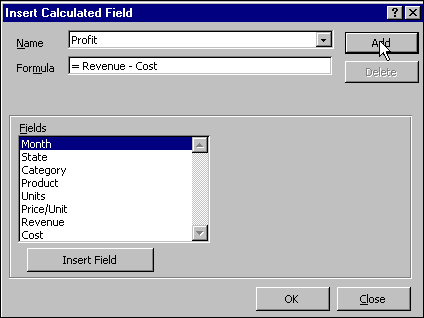
Create a new field called Profit from existing field names (Revenue and Cost).
The newly created field, Profit, can be used in the PivotTable.
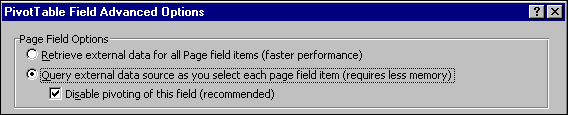
Microsoft Excel has always provided the ability to access data from external data and perform analysis with PivotTables. Advanced users have experienced memory constraints when importing large sets of external data into a PivotTable. Server‑based page fields in PivotTables provide better support for analyzing large amounts of data in a client/server environment by allowing users to retrieve one or more page fields dynamically from an external server. When a user chooses a new value for a page field, a new query is automatically generated to retrieve the data for that value. Because data for only one value is queried at a time, the amount of data retrieved is greatly reduced. This approach now makes it possible to bring in relevant pages that are important to the user without utilizing too much memory.
In the past, dates were displayed alphabetically rather than numerically. Microsoft Excel 97 solves sorting and formatting issues by displaying dates as numbers rather than text. As a result, when dates are sorted in ascending or descending order, they are listed in appropriate numerical order rather than textual order. Also, dates can be formatted properly in various Microsoft Excel formats (e.g., 3/4/95 or February‑96).
Microsoft Excel 5.0 displayed all page fields in a single column. In Microsoft Excel 97, page fields can be arranged across columns, in multiple rows to take up less vertical space. This gives users the option of customizing the page fields on the spreadsheet and using the real estate on the spreadsheet more efficiently.
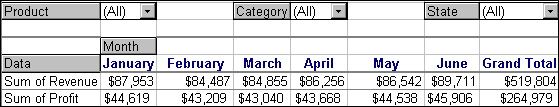
Page fields are arranged horizontally using the Options dialog box.
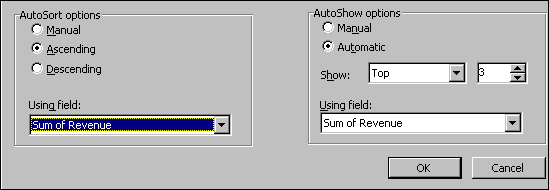
Customer site visits revealed that the last step of the PivotTable Wizard - formatting and reporting options - was confusing and used only by advanced users. In addition, those who did take advantage of these options wanted more selections. As a result, the last step of the PivotTable Wizard in Microsoft Excel 97 has been reworked to provide an Options button. This redesign "hides" the complex information from the novice user by relegating it to a separate dialog, while providing more specific control of the PivotTable's output to the advanced user. Now those advanced users can customize the Format, Display, Data Source, and External Data options of a PivotTable, all from a single sheet.
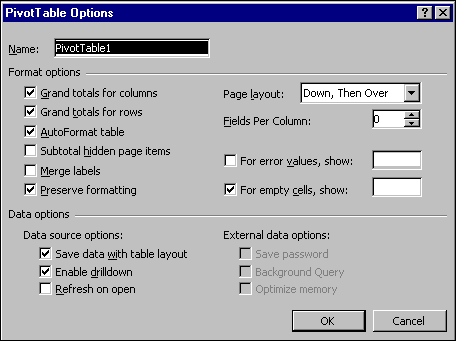
Customer site visits also revealed that advanced PivotTable users wanted more control over data display in pivot fields. In Microsoft Excel 97, users can now dynamically sort in ascending or descending order on the selected field or the data fields on the PivotTable. In addition, users can display only the top/bottom entries in the data field (e.g., The bottom three of Monthly Revenues). Controlling pivot field properties makes it easy to analyze and customize the data.
"Connectivity" is now becoming more pervasive among software users. In fact, 65% of all computer users are now connected in some way, be it an online service, an Internet service provider, or a public or private network. International Data Corporation research shows that 73% of corporations with 1,000 employees or more will have capabilities for an Intranet by the end of 1996 ("Joint Study Conducted By Network World And International Data Corp. Reveals Internet/Intranet Trends Of 500 Leading Users In The U.S." Network World and International Data Corporation, April 3, 1996). According to Jupiter Communications research, approximately 10 million people had access to the Internet in 1995, and over 35 million people will have access to the World Wide Web by the year 2000("Total Online Households In The U.S. To Reach 35 Million By The Year 2000." Jupiter Communications, April 29, 1996).
This connectivity has encouraged more users to collaborate and share information in their spreadsheet online. Microsoft Excel 97 now makes it easier to manage and exchange information with others, and to easily connect spreadsheets to data on a network, an Intranet, or the Internet.
According to usage studies, over 83% of spreadsheet users working on projects with others share their spreadsheet files. The Microsoft Excel team visited over 60 organizations and talked to hundreds of users to determine how spreadsheet users currently collaborated and what software could do to make this collaboration more effective.
Our planners found that collaboration involving a spreadsheet is most often an on‑going, ad hoc process involving multiple individuals or groups. Typical projects included group budgeting and forecasting activities, record keeping, and project tracking. Spreadsheets rarely undergo the process of drafting and editing toward a final, finished version; rather collaboration is usually a process of collecting information from multiple sources or periodically updating records. In all cases, the users doing the collaborating are rarely IS specialists, but instead are typical knowledge workers who view the spreadsheet as a tool needed to perform their job.
Thus, the approach to workgroup functionality in Microsoft Excel allows users to share information without requiring an Information Systems (IS) administrator to teach them new processes or paradigms, and without requiring the formal assignment of restrictive roles. Instead, we've solved for the most common scenario (users collaborating in an informal way), and allowed users to work in a collaborative environment in the same way they work alone in a standard worksheet.
Microsoft Excel 97 has made it easy for multiple users to work collaboratively on one workbook simultaneously, without requiring them to learn a new paradigm for sharing. One user simply marks the workbook as "shared" and other users can open and add information to the same workbook.
In addition, if a copy of the workbook is sent to someone outside of the corporate network, the copied workbook can be modified, and the changes merged into the original workbook with its revision history. Microsoft Excel makes it easier than ever for people to work together, whether their documents reside within or outside of the corporate network.
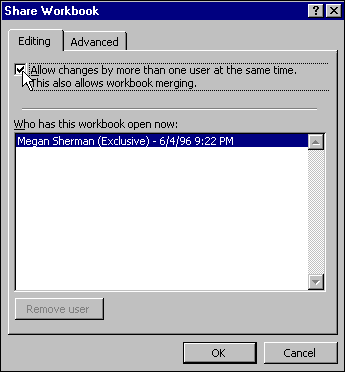
By simply checking the box, a spreadsheet owner lets others access the workbook simultaneously.
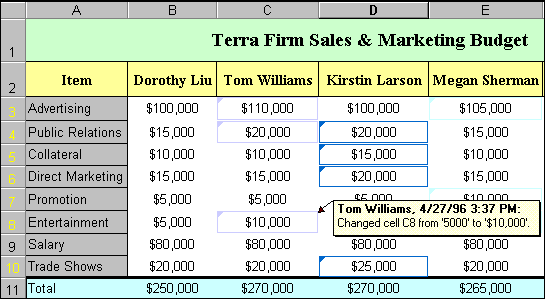
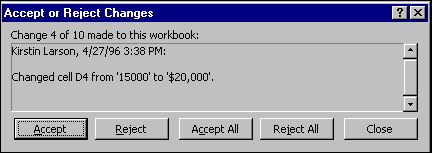
According to usage studies, a common scenario involves more than one person working on the same workbook dealing with shared projects, budgets, etc. However, keeping track of what has changed, by whom, and when is a major challenge, and becomes even more important when multiple people are working with the same document. Today, users who store versions of a document must compare versions manually.
In Microsoft Excel 97, every change to a shared spreadsheet can be stored, and its history reviewed to see what changed, when, and by whom. So, the user has the benefit of seeing the changes that occurred on the worksheet since it was last saved. Microsoft Excel highlights sets of changes by displaying a color‑coded cell border that corresponds to each person who made changes. This acts as a signal to other users that a change has been made. As a user hovers the mouse over a changed cell, a cell tip appears with the history of the changes. These changes can also be displayed on a separate worksheet to provide a complete audit trail. This "History" sheet can be easily sorted or filtered, providing users the ability to narrow their review of changes to a user or region of the spreadsheet. Besides using it in a workgroup environment, individual users can also track their own modifications.
Once the revisions have been made, the owner of the document should be able to review the changes and decide whether to incorporate them into the workbook or not. Microsoft Excel 97 uniquely identifies each reviewer's changes, and then lets users accept or reject revisions.
Consolidating changes becomes a challenge when an individual takes a copy of the shared document outside of the server environment. In Microsoft Excel 97, users can now share documents with anyone, whether or not they are connected to the server. Merge Workbooks allows a user to merge several copies of shared workbooks into a single workbook, even if the document is on a portable computer or users don't have access to a shared server. After the workbooks have been merged, a user can review and accept or reject changes made by others who worked on the document off‑line. Merge Workbooks also works with Windows 95 Briefcase replication, which allows users to work on documents away from the corporate network and update the changes into the existing document once the user reconnects to the corporate network.
Microsoft Excel 95 gave users the ability to update a workbook with changes by simply saving a shared workbook. When they saved the workbook, they would be notified that changes had been made. Microsoft Excel 97 makes it more automatic to see and review changes by others. Users can now set automatic intervals for workbooks to be either saved (every 5 minutes, for example) or updated with others' changes to keep the shared data current.
Although numerous users might contribute to the same workbook, users still want their spreadsheet to reflect their own personal "view" settings. For example, although a user might share a budget, she might want to have her own printing, filtering, or other view options appear. With Personal Views, Microsoft Excel 97 provides the flexibility to set these preferences. When the shared workbook is opened, the settings applied by a particular user are displayed only on her machine - that is, she will not have to recreate these settings every time she opens a shared workbook.
Usage studies show that more than 80% of those working on projects with others tend to ask for their feedback. As a result, Microsoft provided Cell Notes to document explanatory comments to and from others. In Microsoft Excel 97, Cell Notes have been enhanced to make it easier to understand and track comments made by others. Now Comments indicate the originator of the message followed by the text. Also, others can now respond to the original comment, initiating a dialogue within the spreadsheet.
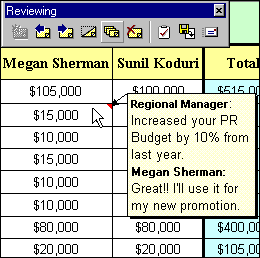
With comments, users can insert, delete, display, hide, merge several from different files into one, or create a task for Microsoft Outlook.
Microsoft Outlook is the newest member of the Microsoft Office family and the successor to Schedule+. Microsoft Outlook is more than just a Personal Information Manager (PIM), or a mail and scheduling client. It's a desktop information manager, providing a single consistent focus for the user to find and manipulate information regardless of its type. Microsoft Outlook deals with documentation, appointments, tasks, and mail in a single place in a consistent manner.
Microsoft Excel 97 takes advantage of the capabilities of Outlook by making it easy to create a task from Microsoft Excel and add it to an Outlook task list. For example, users might schedule time from Microsoft Excel to create a budget forecast or get the latest sales figures. In addition, users can track tasks in Microsoft Excel to include in the Outlook journal to aid in searching for relevant documents. For example, users might choose to have Outlook record document events - such as Open, Save, Print, Send, and Route - so they can search by parameters such as "the budget I printed last month" rather than having to know the full name of the document. Also, users can use Microsoft Office templates as Outlook forms. Microsoft Outlook Forms combine the editing and programmability features of Microsoft Office applications with the messaging and groupware features of Outlook and Exchange server. For example, a Microsoft Excel expense report template can be used as a form in Microsoft Outlook. Once completed by individuals, each of the forms can be posted to a specific Microsoft Outlook public folder in the accounts payable group. Then, an administrator can filter the completed expense forms by individual, department, etc. directly from within Microsoft Outlook. Microsoft Outlook is a central area for managing desktop information and is integrated very well with Microsoft Excel 97.
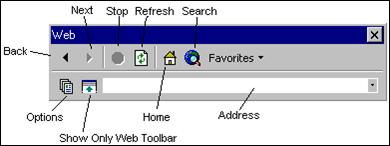
As Intranets become more pervasive, tight integration between productivity applications and networks becomes even more important. Microsoft Excel 97 allows users to use the navigation and searching metaphors of the Web to seamlessly find information using this simple, familiar paradigm.
Many users have separate documents that support a Microsoft Excel worksheet, such as a report in Microsoft Word or supporting Microsoft Excel spreadsheets with additional detail. Microsoft Excel 97 provides an easier way for users to connect and manage these documents by allowing users to create hyperlinks to these documents or to a supporting Web address. A hyperlink, when clicked, opens the linked Microsoft Office document or an URL address, whether it's located on a corporate Intranet, the Internet, a desktop, or the corporate network. Hyperlinks make it easy for users to connect to important information no matter where it resides.
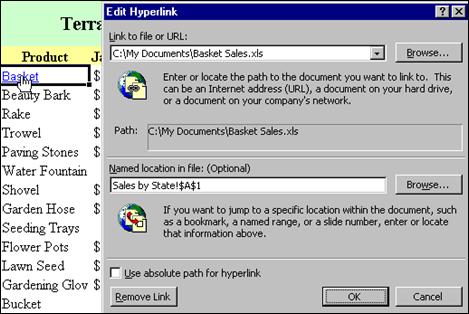
Basket is hyperlinked to a workbook called Basket Sales.
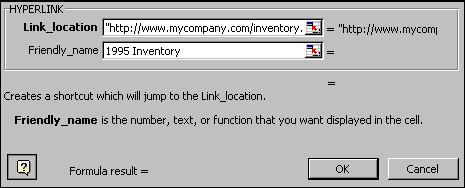
In addition, Hyperlink function makes it easy to apply a friendly name to a URL on your spreadsheet so that it's easy to reference when jumping to a document.
Navigation via hyperlinks might be confusing for a first‑time user. So, Microsoft Excel has a special Web toolbar to provide a central place for users to access navigation commands for easy browsing of the Web or their hyperlinked documents. This optimized Web toolbar appears whenever a document containing a hyperlink is opened. It is similar to the Microsoft Internet Explorer toolbar, which makes it very easy for users to navigate in Microsoft Office 97 applications or on the Intranet/Internet.
Currently it is difficult to locate documents on vast corporate networks. In the past, users were required to manually search through all the documents, or to send e‑mail asking for assistance in locating the information. Microsoft Excel 97 is integrated with the Active Web searching technology that allows users to instantaneously retrieve various Microsoft Office or HTML documents relevant to a user's task. Active Web Search is similar to using any of the popular Internet search engines, but allows corporate users to find information on a network or Intranet. Initially, the user navigates to a search form page or by using the search button on the Web toolbar or their browser. The user fills in the search form by completing the document properties, such as title, author, or other standard Microsoft Office properties, and clicks Search. This triggers the submission of the search to the Web server. The results are returned in an HTML page with hyperlinks to each of the documents.
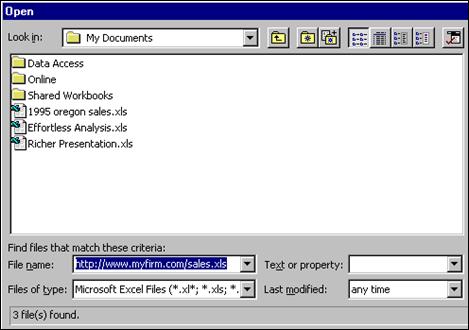
In addition, Microsoft Excel 97 will support opening files from HTTP and FTP servers. This allows users to open different file types (e.g., Microsoft Excel, HTML, etc.) using the File Open command. Microsoft Excel 97 provides users the flexibility to open files residing not only on the corporate network but also from various Web servers.
Working effectively in a connected environment means that users must be able to publish information online as easily as they now print and save. Microsoft Excel 97 takes familiar ways of publishing information and extends them to the online environment.
In January 1996, Microsoft gave users the ability to post spreadsheet data for online viewing with the introduction of the Internet Assistant Wizard for Microsoft Excel. The wizard assisted in converting spreadsheet data to HTML format either as a separate document or into an existing HTML document.
In Microsoft Excel 97, this feature has been enhanced to transform charts into a GIF file format. If spreadsheet information contains hyperlinks, they are automatically converted into HTML links. Using the option on the "Save As." menu, users can convert Microsoft Excel spreadsheet data and charts into HTML format. Save as HTML enables users to convert all tables and lists into a Web document for the Internet or a corporate Intranet, without having to understand the complicated code associated with HTML format.
Not only can users open files from HTTP and FTP servers, they can also save spreadsheets to Web resources. Once users have created Microsoft Excel spreadsheets, they can save to URLs using Microsoft Excel File Save command. Microsoft Excel 97 extends the capability to save files not only onto a corporate network but also to Web servers. Once again, Microsoft Excel provides a great extension for enabling spreadsheets for the Web.
Microsoft introduced the Microsoft Excel Viewer for Windows 95 in December, 1995. The Viewer is a small, no‑charge, freely distributable program that lets anyone view and print Microsoft Excel spreadsheet files with the added security of not being able to edit the file. Today, the Internet and other online services do a good job of dealing with text data as well as graphic images. However, tabular data (i.e., columnar lists, graphical charts, or financial reports) are not handled well. As more and more people begin creating and distributing spreadsheets over the Internet and internal corporate webs, Microsoft has created a tool that is designed to make it easier than ever to view Microsoft Excel spreadsheet files by anyone. The Microsoft Excel 97 Viewer gives users the flexibility to view page layout, copy, zoom, AutoFilter, control cell sizes, and hyperlink to another Microsoft Office document or a Web site. The Microsoft Excel Viewer supports Active Documents and can display any Microsoft Excel or Lotus 1‑2‑3 file formats.
Today, many Web pages use forms to collect user information. For common spreadsheet users, creating an online form and retrieving the information is difficult because it requires complicated HTML code; likewise submitting information to a Web server is not easy. With the Web Form Wizard, Microsoft Excel 97 makes it easy for users to submit information from a form created in Microsoft Excel directly to a Web server. Once on the Web server, administrators can access the information irrespective of the software platform. Users now have an easy way to submit expense reports, time cards, etc., to a Web server.
Microsoft introduces new HTML tags that bring Microsoft Excel functionality to HTML pages. Tags for spreadsheet formatting, formulas, AutoFilters, and PivotTables are created when a Microsoft Excel 97 spreadsheet is converted into HTML format using the Save As HTML command. Users viewing these tags in incompatible browsers see the underlying data in a simple HTML table. However, when opened in Microsoft Excel 97, these tags are interpreted and bring an added layer of active functionality to the HTML page.
Microsoft Excel creates value in a connected environment by giving users a place to analyze and work with information, rather than just statically view it. To fully take advantage of the capabilities of Microsoft Excel as a dynamic analysis tool, users must be able to easily retrieve data from remote sources and bring it into a spreadsheet.
Microsoft Excel 97 makes data retrieval easier by allowing users to pull information from Web Servers into Microsoft Excel and by making the process of querying information from all sorts of remote sources easier and more seamless for the user.
Until now, Microsoft Excel enabled users to create formulas with links to a range of cells located in a separate workbook. This workbook could reside either on a local desktop or on a corporate network. Now Microsoft Excel 97 extends this linking capability to a workbook located on a Web server. A user can specify Uniform Resource Locators (URLs) in their formulas, whether the spreadsheet exists on an HTTP or FTP server, the desktop, or a corporate network. Microsoft Excel makes it very easy to link to important data no matter where it resides.

Microsoft Excel 97 opens HTML documents as easily as .XLS files, making it easy to bring tabular information from the Web or an Intranet into a spreadsheet where it can be analyzed. Formatting tools such as background cell color and merged cells are used to display data very accurately and all hyperlinks are retained.
Much of the data available via the Internet, such as financial data, weather forecasts, and sports information, is dynamic and changes frequently. As more dynamic data becomes available online there will be a need for direct access to this data. In Microsoft Excel 97, data can be accessed from the Internet by running queries designed to bring specific data onto a spreadsheet on a timely basis. In addition, the imported data can be updated regularly on the same worksheet and used for calculations or in analysis. Now users can access data from the Internet directly from within Microsoft Excel without initially going to the World Wide Web.
In the past, when IS managers created a query, they would often have to setup Open Database Connectivity (ODBC) data sources on each machine in order to refresh the query. For example, if an administrator wanted sales figures from the main database to update a spreadsheet used by all sales personnel, the IS manager would have to either create or send instruction on connectivity setup for each desktop. In Microsoft Excel 97, all the ODBC data source creation is done automatically. Now, IS managers can simply create and distribute these queries to other users since the query (SQL string) and the data source name (DSN) is encapsulated into the query (.dqy) file. So, anyone can run the database queries in Microsoft Excel 97. Therefore, any listing queries (e.g., customers, suppliers, products, inventory, or any data that resides in a database) can now be executed without each individual user's having to understand the structure of databases. Advanced users can also edit the existing queries or create new queries. Sharable Queries give everyone easy, one‑step data access.
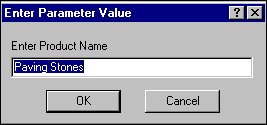
When IS administrators create queries for others, most of the time they create similar queries for different departments or individuals. Then, each department or individual filters information from this query to find specific information that they need. In Microsoft Excel 97, IS managers can create parameterized queries using Microsoft Query in the same manner as Microsoft Access. In a corporate environment, a systems administrator can set up criteria for a query (e.g., product category and time period). Then, anyone can execute the parameterized query by providing the specific product category (e.g., Paving Stones) and date (e.g., 1/1/96). The data associated with the specified criteria is imported into Microsoft Excel 97. Creating and executing parameterized queries makes it easy for people to get the specific information they need quickly and easily.
Microsoft Excel 97 makes it easy to distribute workbooks containing data from external sources, even if the workbook contains a large amount of data. Users simply save the workbook with rich formatting as a template, and select the option to remove all external data before distributing it. Removing the external data greatly reduces the size of the workbook. Once the workbook is opened, all the formatting is retained, and the external data is refreshed automatically with current information from the external source. To assist with data security, users can require the recipient to enter a password in order to connect to the database and refresh the data. Now users can share reports containing external data via e‑mail or public servers without worrying about network resources and access issues.
In the past, when executing a query, the user needed to wait until the operation was completed before continuing to work. This could be very time‑consuming when dealing with large data sets. Microsoft Excel 97 executes queries asynchronously, allowing users to define a query and then have full control of their working environment. The task of processing the query and returning the data to Microsoft Excel has been relegated to a separate thread that communicates with MS Query and checks the status of the query execution, allowing the user to continue to work in the spreadsheet with no loss of productivity. Asynchronous Queries are available through PivotTables when accessing data from an external source and are extremely useful when retrieving large data sets for PivotTable analysis.
Microsoft Excel 97 is smart about refreshing external data. Formatting is preserved and the size of data range is automatically adjusted depending on the amount of data that's returned by the query. Columns containing formulas that refer to external data ranges are automatically adjusted, and not modified or removed. These features allow a user to create truly useful, refreshable reports in Microsoft Excel. Also, any calculations based on data from the query like column totals and calculations based on values are refreshed even if the size of the range changes. Microsoft Excel 97 also has the ability to refresh queries in the background, which means that users can continue to work productively on their workbooks while data is being refreshed.
Sometimes users need to perform ad hoc queries to get some specific information beyond the canned queries and reports that let them change a few parameters. Microsoft Excel 97 now makes it easy for users other than system administrators to import data from external sources. The new Query Wizard steps through the process of connecting to a database, creating a query, and returning the data to a spreadsheet. Using the Query Wizard, IS professionals can take advantage of the Sharable Data Sources feature and create data sources to make them available to users who want to perform ad hoc queries. This process shields the user from setting up the data sources that require them to provide information such as server name, location database name, etc. IS professionals can even point to specific tables and views so that novice users are not exposed to intricacies of relational databases. Users who are database savvy and would like to delve into Microsoft Query can bypass the wizard to create a query.
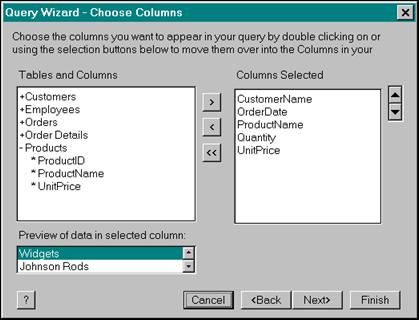
Microsoft's Query Wizard makes it easier than ever for everyone to access information residing in various external databases.
More than 500,000 solutions developers use Microsoft Excel as the platform for building custom solutions for specific business needs. Rather than spending large amount of resources writing low‑level code, companies are investing in solutions that leverage the built‑in power of Microsoft Excel for data analysis, charting, and presentation. Microsoft Excel 97 will continue to be the best spreadsheet development platform, with improvements in capacity, end‑user programmability, development environment, Forms capability, true event‑driven programming, support for ActiveX environment, increased programming control for PivotTables, and a Mapping object model.
In addition, Visual Basic for Applications (VBA) now exists in all Microsoft Office applications, and the same version of VBA is present in Microsoft Word, Microsoft PowerPoint , and Microsoft Access. VBA now provides consistent development language across Microsoft Office.
One of the top three Microsoft Excel Wish requests is to increase the capacity of Microsoft Excel worksheets, whether it be the number of characters in a cell or the number of rows on a worksheet. Users have consistently requested this increase in capacity to enable them to manage large workbooks, especially in solutions where Microsoft Excel brings in large amounts of data from an external database.
In Microsoft Excel 97, the cell capacity, number of rows and number of points per series in a two‑dimensional chart has been increased as shown below.
|
Microsoft Excel 95 |
Microsoft Excel 97 |
|
255 characters per cell |
32,767 characters per cell |
|
16,384 rows |
65,535 rows |
|
4,000 points per series (2‑D chart) |
32,000 points per series (2‑D chart) |
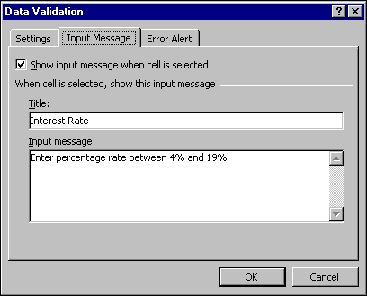
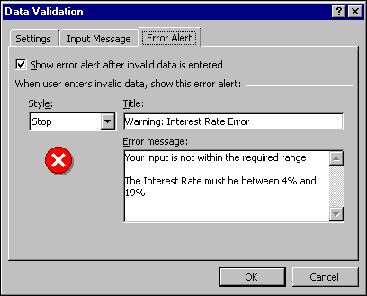
In the past, there was no simple way to control or validate data entry. Microsoft Excel 97 offers users a way to define rules in a worksheet without programming with Data Validation. Now those who create templates for data entry (e.g., Expense Reports, Invoices, Purchase Orders, etc.) can set up validation rules for cells and ranges without writing custom macros.
Data Validation performs four tasks:
Users can set criteria to determine whether the data entered by another into the worksheet is the "right" kind of data (e.g., text in a data field would be invalid).
Users can also setup a criteria and a descriptive prompt for others who might enter information into their loan statement, so those entering data know what type of information should be entered into the cell.
Users can specify error type and message to prompt the user for invalid entries.
Users can also check the form by using the Auditing toolbar to identify whether any of the entries are invalid.
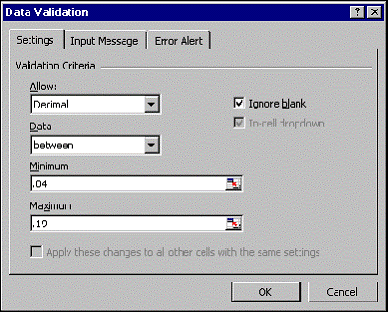
User applies Data Validation rules .
Data Validation ensures that the person entering the data will properly complete the worksheet. If the Microsoft Office Assistant is active, then the input messages and the error alerts are prompted by the Assistant. Also, reviewing of forms is reduced so that users can focus on the content rather than data‑entry errors.
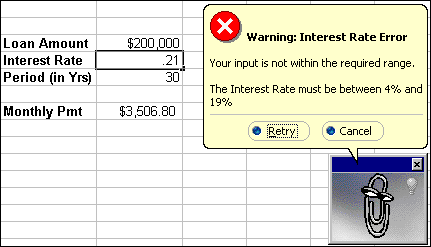
. and warns the user that the entered data is invalid.
Microsoft had two primary goals for the Visual Basic development Environment (VBE). The first was to allow all Microsoft Office applications to share a single component that provides programmability in a consistent way across the entire suite. The second goal was to be like Visual Basic 5.0, unifying our development tools with a professional development environment so that Microsoft Excel and Microsoft Office are a full‑scale, full‑featured development environment.
This means that each Microsoft Excel or Microsoft Office document can have a VBA project associated with it. The project will appear in a VBE MDI workspace which includes a much‑improved code editor, hierarchical object browser, multi‑pane debugger, a property sheet, project explorer, and a statement builder. VBE provides the same user experience as working in a standalone Visual Basic 5.0 environment. Consistency across all Microsoft Office applications and with Visual Basic 5.0 make VBA a powerful development tool for custom solutions.
Many Independent Software Vendors (ISVs) have asked for richer control of forms. Microsoft Excel 97 brings Microsoft Excel custom dialog capability to the same level as Visual Basic by providing a new Forms tool. Microsoft Forms give Microsoft Excel programmers code behind forms, rich event handling, and support of ActiveX controls. Microsoft will continue to support existing dialog sheets, but Microsoft Forms will not attempt to convert old dialogs into the new Form format.
VBA in Microsoft Excel 5.0 and Microsoft Excel 95 had event handling - the ability to watch what the user is doing and react appropriately. Microsoft Excel currently supports 14 "quasi‑events," such as as OnEntry, OnCalculate, etc. In Microsoft Excel 97, there will be much richer event handling in terms of the number of events available - 62 events (See Appendix A) - as well as the specific objects to which triggering code can be attached. Additionally, the interface to interact with these events is consistent with Visual Basic and with Microsoft Forms. Now Microsoft Excel programmers have more flexibility and control in responding to user actions.
Microsoft now gives programmers the ability to embed ActiveX controls based on Microsofts Component Object Model (COM) specification directly on their Microsoft Excel worksheets. ActiveX is Microsoft's enabling technology, used to activate both the Internet and a workbook. ActiveX takes the Internet beyond static documents to provide a new generation of more active, exciting, and useful experiences. This will enable Microsoft Excel worksheets to be quickly integrated into Internet solutions. Now it's easy to put image listboxes, directory browsers, and richer image display on top of a worksheet or in a custom Office Form.
PivotTables are a powerful analysis tool that give users a lot of flexibility to view their data from different dimensions. While users like this power and flexibility in the user interface, the solution developers want programmatic access to automate and control PivotTables through code. Microsoft Excel 5.0 and Excel 95 provided the ability to control PivotTables via VBA; Microsoft Excel 97 dramatically extends PivotTable controls by exposing properties and methods in its object model (see Appendix B) for bulletproofing, memory and cache management, formatting, and external queries. For example, developers now have programmatic access to the PivotTable cache so they can create, delete, and determine its size. Programmers can also turn off PivotTable recalculation. Finally, extensive protection of PivotTables can be implemented for secure access. Now controlling PivotTables is more flexible than ever. Solution developers can use these new properties and methods to build richer reporting solutions.
In Microsoft Excel 95 Microsoft Map (formerly called Data Map) exposed only one method, RefreshMap, for the custom solution developer. In Microsoft Excel 97, we have an object model for Microsoft Map that allows custom solution developers to add basic geographic data visualization to their solutions. This object model makes most of the capabilities available to end‑users available to developers.
|
Type of Event |
Event Name |
|
AppEvents |
NewWorkbook |
|
AppEvents |
SheetSelectionChange |
|
AppEvents |
SheetBeforeDoubleClick |
|
AppEvents |
SheetBeforeRightClick |
|
AppEvents |
SheetActivate |
|
AppEvents |
SheetDeactivate |
|
AppEvents |
SheetCalculate |
|
AppEvents |
SheetChange |
|
AppEvents |
WorkbookOpen |
|
AppEvents |
WorkbookActivate |
|
AppEvents |
WorkbookDeactivate |
|
AppEvents |
WorkbookBeforeClose |
|
AppEvents |
WorkbookBeforeSave |
|
AppEvents |
WorkbookBeforePrint |
|
AppEvents |
WorkbookNewSheet |
|
AppEvents |
WorkbookAddinInstall |
|
AppEvents |
WorkbookAddinUninstall |
|
AppEvents |
WindowResize |
|
AppEvents |
WindowActivate |
|
AppEvents |
WindowDeactivate |
|
ChartEvents |
Activate |
|
ChartEvents |
Deactivate |
|
ChartEvents |
Resize |
|
ChartEvents |
MouseDown |
|
ChartEvents |
MouseUp |
|
ChartEvents |
MouseMove |
|
ChartEvents |
DoubleClick |
|
ChartEvents |
BeforeRightClick |
|
ChartEvents |
DragPlot |
|
ChartEvents |
DragOver |
|
ChartEvents |
BeforeDoubleClick |
|
ChartEvents |
Select |
|
ChartEvents |
SeriesChange |
|
DocEvents |
Calculate |
|
DocEvents |
SelectionChange |
|
DocEvents |
BeforeDoubleClick |
|
Type of Event |
Event Name |
|
DocEvents |
BeforeRightClick |
|
DocEvents |
Activate |
|
DocEvents |
Deactivate |
|
DocEvents |
Calculate |
|
DocEvents |
Change |
|
OLEObjectEvents |
GotFocus |
|
OLEObjectEvents |
LostFocus |
|
WorkbookEvents |
Open |
|
WorkbookEvents |
Activate |
|
WorkbookEvents |
Deactivate |
|
WorkbookEvents |
BeforeClose |
|
WorkbookEvents |
BeforeSave |
|
WorkbookEvents |
BeforePrint |
|
WorkbookEvents |
NewSheet |
|
WorkbookEvents |
AddinInstall |
|
WorkbookEvents |
AddinUninstall |
|
WorkbookEvents |
WindowResize |
|
WorkbookEvents |
WindowActivate |
|
WorkbookEvents |
WindowDeactivate |
|
WorkbookEvents |
SheetSelectionChange |
|
WorkbookEvents |
SheetBeforeDoubleClick |
|
WorkbookEvents |
SheetBeforeRightClick |
|
WorkbookEvents |
SheetActivate |
|
WorkbookEvents |
SheetDeactivate |
|
WorkbookEvents |
SheetCalculate |
|
WorkbookEvents |
SheetChange |
|
New Collection Objects |
Description |
|
PivotCaches |
Collection for cache based properties |
|
PivotFormulas |
Collection for calculated fields and items |
|
New Objects |
Description |
|
PivotCache |
Object for cache based properties |
|
PivotFormula |
Object for calculated fields and items |
|
New Properties |
Description |
|
PivotCache::BackgroundQuery |
If true, use asynchronous query |
|
PivotCache::EnableRefresh |
If false, prevent cache refreshes |
|
PivotCache::MemoryUsed |
Displays RAM used |
|
PivotCache::OptimizeCache |
Optimize storage for fields with less than or equal to 255 items |
|
PivotCache::RefreshOnFileOpen |
If true, automatically refresh cache on file open |
|
PivotCache::SavePassword |
If false, don't save password for external data source |
|
PivotCache::SourceData |
Read and Write, instead of Read only, set via MS Query. |
|
PivotField::CalcEachRecord |
If true, calculated field formulas performed on each record rather than sum of all records |
|
PivotField::DragToColumn |
If false, field cannot be dragged to the column position |
|
PivotField::DragToHide |
If false, field cannot be dragged off the PivotTable |
|
PivotField::DragToPage |
If false, field cannot be dragged to the page position |
|
PivotField::DragToRow |
If false, field cannot be dragged to the row position |
|
PivotField::Formula |
Returns formula of a calculated field |
|
PivotField::IsCalculated |
If true, the field is calculated |
|
PivotField::MemoryUsed |
Returns RAM used by the field |
|
PivotField::ServerBased |
If true, retrieve one page field item at a time from the external data source |
|
PivotField::ShowAllItems |
If true, show items that have not data |
|
PivotField::IsCalculated |
If true, the field is calculated |
|
New Properties |
Description |
|
PivotField::RecordCount |
Returns the number of records for the field |
|
PivotTable::CacheIndex |
Returns the index of the PivotTable cache |
|
PivotTable::DisplayErrorString |
If true, display PivotTable::ErrorString in cells containing errors |
|
PivotTable::DisplayNullString |
If true, display PivotTable::NullString in cells containing errors |
|
PivotTable::EnableDrilldown |
If false, then no drilldown |
|
PivotTable::EnableFieldDialog |
If false, then no access to the Field Dialog |
|
PivotTable::EnableWizard |
If false, then no access to the PivotTable Wizard |
|
PivotTable::ErrorString |
Value displayed in error cells if PivotTable::DisplayErrorString is true |
|
PivotTable::ManualUpdate |
If true, don't refresh PivotTable while VBA subroutine is running |
|
PivotTable::MergeLabels |
If true, nested row and column labels are merged |
|
PivotTable::NullString |
Value displayed in empty cells if PivotTable::DisplayNullString is true |
|
PivotTable::PageFieldOrder |
Order of page fields, across columns or down rows |
|
PivotTable::PageFieldStyle |
Style applied to page field range |
|
PivotTable::PageFieldWrapCount |
Number of rows/columns before a new row/column of page fields begins |
|
PivotTable::PageRangeCells |
Returns range of page field label and dropdowns |
|
PivotTable::PreserveFormatting |
If true, preserve formatting when refresh or pivot occurs |
|
PivotTable::Selection |
Returns string containing reference of items/fields selected |
|
PivotTable::SelectionMode |
If true, structured selection is enabled |
|
PivotTable::TableStyle |
Style applied to the body of the PivotTable |
|
PivotTable::Tag |
Generic PivotTable tag string |
|
PivotTable::VacatedStyle |
Style applied to range vacated by PivotTable |
|
New Methods |
Description |
|
PivotField::AutoShow |
Sets AutoShow behavior |
|
PivotField::AutoSort |
Sets AutoSort behavior |
|
PivotField::CalculatedItems |
Returns a list of calculated items |
|
PivotTable::CalculatedFields |
Returns a list of calculated fields |
|
PivotTable::GetData |
Returns data from a PivotTable |
|
PivotTable::ListFormulas |
Creates worksheet containing formulas of all calculated fields and items |
|
PivotTable::PivotCache |
Changes the cache used by a PivotTable |
|
PivotTable::PivotFormulas |
Changes formula of calculated field or item |
|
PivotTable::Select |
Structured selection on a PivotTable |
|
PivotTable::Update |
Refresh PivotTable when PivotTable::ManualUpdate is set to true |
#########
1996 Microsoft Corporation. All rights reserved.
This document is for informational purposes only. MICROSOFT MAKES NO WARRANTIES, EXPRESS OR IMPLIED, IN THIS DOCUMENT.
Microsoft, ActiveX, IntelliMouse, the Office Compatible logo,
Outlook, PivotTable, PowerPoint, Visual Basic, and Windows are either
registered trademarks or trademarks of Microsoft in the
1‑2‑3 and Lotus are trademarks of Lotus Develoment Corporation.
Part no. xxxxx
|
Politica de confidentialitate | Termeni si conditii de utilizare |

Vizualizari: 1669
Importanta: ![]()
Termeni si conditii de utilizare | Contact
© SCRIGROUP 2025 . All rights reserved