| CATEGORII DOCUMENTE |
| Asp | Autocad | C | Dot net | Excel | Fox pro | Html | Java |
| Linux | Mathcad | Photoshop | Php | Sql | Visual studio | Windows | Xml |
Creating Graphs
![]()
Mathcad makes it easy for you to create an x-y plot. Just click in a new file, type an expression that depends on one variable, for example, sin(x), and then click on the X-Y Plot button
![]()
in the Graph Palette, or choose X-Y Plot from the Insert/Graph menu. Then press [Enter]. Voila, a plot! You should see a nicely formatted plot that looks like this:
Try It Out!
The expression you plot doesn't even have to be a function of ![]() . Try typing y^2[spacebar]-3*y, followed by the key (a shortcut for creating an x-y
plot). Mathcad will plot over a reasonable default range for the dependent
variable in your expression. Here are a
couple of other expressions you can try plotting in this way:
. Try typing y^2[spacebar]-3*y, followed by the key (a shortcut for creating an x-y
plot). Mathcad will plot over a reasonable default range for the dependent
variable in your expression. Here are a
couple of other expressions you can try plotting in this way:
![]()
![]()
Graphing a Function Using Range Variables
When you graphed the above expressions, Mathcad was choosing a default range for the dependent variable. You can have control over the range of values that are plotted. To graph a simple function using a range variable, do the following:
Define a function of one variable that you wish to plot. For example, graph the following function: Type f(x):-x^2[Spacebar]+8*x-27 See on screen
![]()
Define an independent variable for the horizontal axis. For example: Type x:0;10 See on screen
![]()
Create your plot by clicking in the worksheet window, then type to create the x-y plot and type x in the middle placeholder on the horizontal axis and type f(x) in the middle placeholder on the vertical axis. Then press [Enter]
Your plot should look like this:
Those of you familiar with the plot of ![]() will notice that the trace looks a little
rough. To smooth the trace out, try changing the definition of
will notice that the trace looks a little
rough. To smooth the trace out, try changing the definition of ![]() highlighted above to
highlighted above to ![]() . The smaller increment (or step) means
more points calculated, which means more plotted, which makes the trace
smoother because Mathcad is simply connecting the dots.
. The smaller increment (or step) means
more points calculated, which means more plotted, which makes the trace
smoother because Mathcad is simply connecting the dots.
To format an x-y plot, just double-click on it (or choose Graph from the Format menu) to bring up a formatting dialog box. The tabbed dialog box lets you change options for logarithmic axes, grid lines, legends, trace types, markers, colors, axis limits, and more. Experiment with the x-y plot below. Double-clicking on any Mathcad plot -- contour, surface, polar, vector, etc. -- brings up an appropriate formatting dialog box.
![]()
Graphing Vector Elements
Here is a vector of data points called money_spent. We created the vector using the Matrix command on the Insert menu; our vector below has 8 rows and 1 column.
To plot these data points, the horizontal
axis must be either (a) an index variable into the variable ![]() or
(b) another vector with the same number of elements. For case (a), first define an index into the
vector:
or
(b) another vector with the same number of elements. For case (a), first define an index into the
vector:
Type i:0;7 See on screen
![]()
Create your plot by typing and typing
Type money_spent[i See on screen
![]()
in the placeholder on the y axis, and i in the placeholder on the x axis. You should see a plot similar to this:
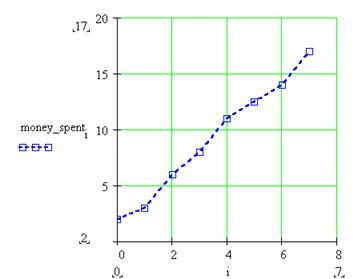
Notice here that box symbols have been used on a dashed blue line.
To demonstrate case (b), plotting two vectors of equal size against each other, we will define a second vector, called day:
Now it's easy: Create the plot by typing , as above, and type
Type money_spent See on screen
![]()
in the placeholder on the y axis, and
Type day See on screen
![]()
in the placeholder on the x axis.
The resulting plot should look similar to this:
Here the 'points' trace type has been used with magenta O's. Notice that grid lines have been turned off on both axes.
Graphing a Function of Vector Elements
You can plot a function over a domain that doesn't contain evenly spaced points. For example, your domain could consist of a vector of values. Plotting a function of vector elements entails defining a function, defining a vector which will be the domain for the function, and plotting. An example of this is:
Define a function of one variable.
Type f(x):x^2 See on screen
![]()
Define a vector of numbers to be the domain for the function. Type x: followed by [Ctrl]M , and fill in the Matrices dialog box with the appropriate number of rows and columns (here, 5 rows and 1 column), followed by OK. Then fill in the placeholders in the vector.

Define an index variable. Type i:0;4 See on screen
![]()
Type and fill in the middle placeholders on
the y and x axes with ![]() and
and
![]() The
result should look similar to this:
The
result should look similar to this:
Here, the difference with plotting a function of a range variable is that the horizontal axis does not have to be in even increments (such as 1, 2, 3, , 10). Rather, it can be any set of numbers you may wish to plot.
Graphing Two or More Functions
Plotting multiple functions over a single
domain on a single graph is straightforward. For example, suppose you want to
plot both ![]() and
and
![]() on
one plot. It's easy! Just type the two expressions separated by a comma and
then type
on
one plot. It's easy! Just type the two expressions separated by a comma and
then type
Type 1/z [Spacebar] , z^2 @ [Enter] You'll see a graph similar to this:
In this example both expressions are plotted over the same default range of values, but you could use two separate range variables if you wish. Try it out in your worksheet window now.
Type f(x):sin(x) See on screen
![]()
Type g(t):t^3 See on screen
![]()
Type x:-10,-9.9;10 See on screen
![]()
Type t:-2,-1.9;2 See on screen
![]()
Then,
Type in some blank space.
In the middle placeholder on the horizontal axis, type x,t
In the middle placeholder on the vertical axis, type f(x),g(t)
Type [Enter]
Your result should look like this:
As you can see, plotting more than one function is simple --- just separate your arguments with a comma ( The same syntax holds for plotting multiple traces using vectors and functions of vectors.
![]()
![]()
|
Politica de confidentialitate | Termeni si conditii de utilizare |

Vizualizari: 1788
Importanta: ![]()
Termeni si conditii de utilizare | Contact
© SCRIGROUP 2025 . All rights reserved