| CATEGORII DOCUMENTE |
| Bulgara | Ceha slovaca | Croata | Engleza | Estona | Finlandeza | Franceza |
| Germana | Italiana | Letona | Lituaniana | Maghiara | Olandeza | Poloneza |
| Sarba | Slovena | Spaniola | Suedeza | Turca | Ucraineana |
Performance Assessment: Tracking and Monitoring
With a solid project definition, plan, and organizational infrastructure, Perry is confident that he can control his project. He is not nave enough, however, to think that he can sit back and remain idle. Quite the contrary, he knows all about Murphys law. He knows from the physicists view of the universe that entropy can occur.
So he respondsnot reactsto changing circumstances. He does that best by tracking and monitoring performance. And the keys to tracking and monitoring performance are status data and status assessments.
Collect Status Data
Status data offer several advantages for Perry. From the data he can determine project performance specifically, how well the goals of the project are being met. He can also determine how efficiently work is being done. He can reduce his and everyone elses frustration and anxiety by providing feedback. It instills confidence in everyone that the project is under control, that the project manager is monitoring its pulse. Finally, he can maintain communications and information sharing among the participants.
Unfortunately, status data are often not collected well. The task can be labor intensive and time-consuming. This is especially the case when there is no previous infrastructure in place or when the team members lack experience. If the project manager, or the team, lacks the expertise or knowledge of collection, there may be an inappropriate assessment. Also, the project team may be using incompatible computing tools and converting the data requires considerable effort and expertise. Teams using older software and hardware particularly find this situation complicates data collection.
The style of the project manager can affect data collection. If she prefers to shoot from the hip or rely less on administration, the project manager will likely rely more on intuition and informal methods for data collection. Though theres some merit under certain circumstances, this can result in gross misjudgments. Likewise, the project manager may not have a good grasp of the projects scope. Failure to understand the scope can result in problems determining what data are needed.
Perry, fortunately, is not one of these project managers. He understands the importance of reliable data. He must have certain prerequisites in place to do meaningful assessments.
A solid information infrastructure. He sets up a process for identifying, collecting, and compiling data that will be reliable and valid.
Available expertise. He assigns responsibility for collecting data to someone who has a good understanding of data collection techniques.
A standardized set of tools to collect and compile the data. He knows that a mixture of incompatible hardware and software will cause frustration levels to rise and nobody, not even himself, will bother to collect data.
Clear value in collecting data. If people do not see the value of data collection, they will be reluctant to expend the effort. Collecting data must be meaningful on both individual and group levels. This distinction is important, since it affects how the data will eventually be formatted and reported.
Methods of Collection
Perry uses formal and informal modes for collecting data. Formal modes include status reviews, one-on-one sessions, and forms.
The status review, discussed in Chapter 13, is held regularly. The meeting covers cost, schedule, and quality measures. Perry collects data prior to the status review, so that at the meeting he can discuss the current status, make an assessment, and determine corrective actions. With proper technology, he could, at the meeting, enter the data into a computer, generate the necessary reports, assess the program, and decide an appropriate action to take.
There are problems with collecting data at status review meetings. For example, sometimes the meetings can skew results. Peer pressure can directly or indirectly force people to fudge the data in order to paint an optimistic or pessimistic picture. It is also important to remember that while collecting status data, the project manager remain objective and not influence the reports. The project manager must hear what he needs to hear and not what he wants to hear. Biased data lead to biased assessments.
One-on-one sessions work best for collecting data just prior to a status review. The project manager or her representatives meet with each person individually to collect status data.
But as the number of team members increases, so does the time needed to collect data and, as time passes by, the data age. Also, the data collected in one-on-one sessions could be more subjective than if gathered in a group setting. If peer pressure does not overtake a status meeting, more objective data will likely be available as people question the reports.
Forms are another way to collect data. Team members complete the forms with status data and submit them to the project office for processing. The data are then compiled. Ideally, the forms are computer-based and team members can forward them electronically for quick, easy compilation.
Collecting data on forms presents a challenge, however. Getting the forms submitted on time is one problem, since some people often procrastinate. The other is that forms may get lost. Both problems grow in magnitude as the number of team members gets larger.
Informal modes of data collection include holding ad hoc sessions, using word of mouth, and relying on your own judgment regarding status. Informal modes are quicker and involve less administrative hassles; they are the path of least resistance. But the data collected may not be objective, resulting in a greater chance of error. Still, many project managers rely on informal methods.
Perry decides to use both formal and informal modes of data collection. He uses status reviews to verify the accuracy of the data collected in one-on-one sessions and via forms. But he also keeps his ears open for additional information.
Data Validity and Reliability
When collecting data, Perry keeps two main concepts in mind: reliability and validity. Reliability implies consistent resultsin other words, does the data yield reliable results? Validity involves the approach or tool used to collect data. Does it influence the results, thereby introducing bias, which in turn slants the results?
Some validity errors include inconsistent application of measurement tools, failing to account for changing circumstances, using a collection tool that guarantees a particular result, and undue influence by the personality of the data collector. These are threats to data validity because they influence the data being inputted and the information being derived.
There are other examples of how collection efforts can negatively influence data reliability and validity.
The 90 percent syndrome. Team members say they have 90 percent completed a task; for its remainder, it stays 90 percent complete. Then the task slides past its completion date. Of course, the problem is that the last 10 percent proves the most difficult.
The
Overly negative or positive data. Some team members always exaggerate, saying too much or too little has been done.
The good news effect. Some team members tell the project manager what she wants to hear, usually good news. Hence, the project manager does not get a balanced view.
Lies. Rather than give honest data, some people lie, figuring perhaps no one will know or the project manager will eventually leave before anyone finds out.
Faulty data collection can have a big impact on project performance. Garbage in, garbage out: the quality of output is only as good as the quality of input. Good data lead to good decision making; bad data lead to poor decision making.
Assess Status
With reliable and valid data, Perry can assess overall project performance. Assessment involves determining how well the project has and will achieve its goals. Perry focuses on three areas: schedule, cost, and quality.
Perry assesses status via two principal reviews, looking back (history) and looking forward (the future). Looking at past performance is called tracking; projecting into the future using past performance is called monitoring. Both are important for determining where the project has been and where it will be if the current level of performance continues.
A key concept behind assessing status is variance, the difference between what is planned and what has actually occurred up to a specific point. The formula is quite simple:
Variance = planned actual
If the difference between the two is zero or a positive number, then the project is proceeding as expected, whether from a cost, schedule, or quality perspective. If the difference between the planned and the actual is a negative number, then the project is not progressing as anticipated. Quality variance is discussed in Chapter 16; the remainder of this chapter deals with cost and schedule variances.
It is important to note, however, that variance is a deviation from what is expected. The deviation in itself may not necessarily mean something is wrongit can indicate something good, too. A variance is a signal to investigate the situation and determine whether to take action.
Determining Variance
The tracking portion of the variance calculation is the actual to date. The monitoring portion is the estimate at completion; it is based on actual progress to date plus the remainder of work to do, assuming the current rate of progress is maintained.
Cost variance is calculated by using this equation:
Cost variance = budgeted cost actual cost
The equation result tells Perry whether he has spent more money than planned up to a specific point in time. He calculates it for each task, which in turn is accumulated to give the total estimate at completion for the entire project. A positive value is called an underrun and a negative one is called an overrun. Exhibit 15-1 shows examples of cost variances on the Smythe Project.
|
Exhibit 15-1. Cost
variances.
Smythe Project Budget Sheet |
Schedule variance follows the same pattern. It is the difference between planned and actual start and end dates, respectively. This variance tells Perry whether he has spent more time than planned on a task up to a specific point in time. He calculates it for each task, which in turn is accumulated to give the total estimate at completion for the entire project. A positive value represents an ahead-of-schedule condition while a negative one represents a behind-schedule situation. Exhibit 15-2 has some examples from the Smythe Project.
Earned Value
In the previous section, cost and schedule variances were treated independently. There is, however, a way to treat them as an integrated entity, called earned value. It is the preferred way to measure project performance.
Earned value consists of three basic variables:
|
Exhibit 15-2. Project
schedule sheet. Smythe Project Schedule Sheet |
Budgeted cost for work scheduled
Budgeted cost for work performed
Actual cost of work performed
The budgeted cost for work scheduled (BCWS) is the estimated cost for a task, or group of tasks, that are scheduled to be performed for a specific time period. In other words, it is the estimated value of the work scheduled. The budgeted cost for work performed (BCWP) is the estimated cost that is approved for a task or group of tasks, to be completed up to a specific period of time. In other words, it is the estimated value of the work completed up to a specific point in time. The actual cost of work performed (ACWP) is the actual costs accrued for a task, or group of tasks, up to a specific point in time.
The BCWS, BCWP, and ACWP are all instrumental in calculating the cost variance (CV) and the schedule variance (SV), which in turn are used to assess individual and project performance. Here are the calculations for both:
CV = BCWP - ACWP
SV = BCWP - BCWS
For the Smythe Project example (using $ in thousands):
CV = 200 (or BCWP) - 300 (or ACWP) = - 100, indicating a cost overrun
SV = 200 (or BCWP) - 220 (or BCWS) = - 20, indicating behind schedule
For ease of calculation, the best approach is to convert the cost variance and schedule variance to percentages:
CV % = (BCWP - ACWP) / BCWP
SV % = (BCWP - BCWS) / BCWS
For the Smythe Project example (using $ in thousands):
|
CV % |
= (BCWP - ACWP) / BCWP |
|
|
= -50%, indicating a cost overrun |
||
|
SV % |
= (BCWP - BCWS) / BCWS |
|
|
= -9%, indicating the task is behind schedule |
The values are then plotted cumulatively over time for all three variables as shown in Exhibit 15-3. Again, this can be performed for one task or the entire project.
After calculating the BCWS, BCWP, and the ACWP, Perry can determine in what combination of the following circumstances he might find the project:
|
BCWP = BCWS |
On Schedule |
||
|
BCWP < BCWS |
Behind Schedule |
||
|
BCWP > BCWS |
Ahead of Schedule |
||
|
BCWP = ACWP |
Meeting Cost Target |
||
|
|
BCWP < ACWP |
Cost Overrun |
|
|
BCWP > ACWP |
Cost Underrun |
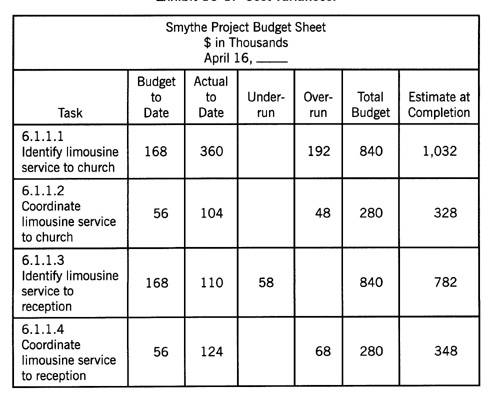
Exhibit 15-3
Earned value.
The BCWS, BCWP, and ACWP also are useful for determining overall project performance. The measures for doing so are the cost performance index (CPI) and the schedule performance index (SPI), which are calculated as:
CPI = BCWP / ACWP or planned costs / actual costs
SPI = BCWP / BCWS or planned costs scheduled costs
Smythe Project example ($ in thousands):
|
CPI |
= BCWP / ACWP |
|
|
=
200 / 300 = .66, indicating cost performance is not very |
||
|
SPI |
= BCWP / BCWS |
|
|
=
200 / 220 = .91, indicating schedule performance is not |
The measure of performance is determined by how close the calculated value approximates 1.00. If the CPI and SPI are less than 1.00, then performance needs improvement. If greater than 1.00, then performance exceeds expectations. This can be performed for one, a group, or all tasks on the project.
Making Performance Assessment Count
A project plan serves no purpose if no one knows or cares if it is being followed. Perry, therefore, regularly keeps a pulse on the schedule and cost performance of the project. He collects and analyzes data to ensure that plan and reality match as closely as possible. If a variance exists, he determines whether to take corrective action. Of course, a variance can exist for quality as much as it does for cost and schedule. Perry knows that and ensures that metrics also exist to measure quality.
Questions for Getting Started
When collecting data for determining cost and schedule status, did you determine:
Expertise needed?
Mode of collection (e.g., formal versus informal)?
Obstacles you will face?
Tools to do the job?
Type of information infrastructure you want in place?
Ways to communicate the value of collecting status?
In regard to status reviews, did you determine whether to collect data prior to or during the meetings?
When collecting data, did you identify the threats to reliability? To validity? How will you deal with those threats?
When assessing status, what variables will you look at? Variances? Cost variance? Schedule variance? Earned value? How will you go about calculating them and how often? Will the calculations be for selected tasks or the entire project?
|
Politica de confidentialitate | Termeni si conditii de utilizare |

Vizualizari: 1689
Importanta: ![]()
Termeni si conditii de utilizare | Contact
© SCRIGROUP 2025 . All rights reserved