| CATEGORII DOCUMENTE |
| Bulgara | Ceha slovaca | Croata | Engleza | Estona | Finlandeza | Franceza |
| Germana | Italiana | Letona | Lituaniana | Maghiara | Olandeza | Poloneza |
| Sarba | Slovena | Spaniola | Suedeza | Turca | Ucraineana |
Intersection of Surfaces
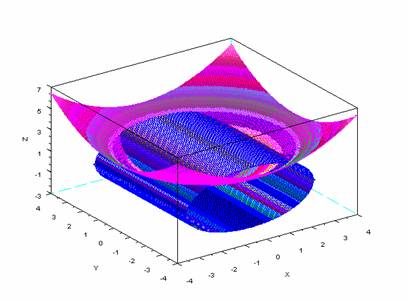
1) Plot the surfaces defined by the cylinder z2 + x2=8 and the paraboloid
z=0.2(x2 +y2 ) and show their intersection.
//program for plotting cylinder
deff('[z]=f1(x,y)','z=sqrt(8-x^2)') //define the function z=f1(x,y)
x= [-2.9:0.05:2.9]; y = x; ĀĀĀĀĀĀĀĀĀĀĀĀĀĀĀĀĀĀĀĀĀĀĀĀĀĀĀĀĀĀĀĀ //Populate the vectors x and y.
z=feval(x,y,f1); ĀĀĀĀĀĀĀĀĀĀĀĀĀĀĀĀĀĀĀĀĀĀ //evaluate matrix z as per f1(x,y) for every value of x & y
surf(x,y,z','edgecolor',[0 0 1],'facecolor',[0 0 1]); //plot z as a surface to show the upper
//half of the cylinder
surf(x,y,-z','edgecolor',[0 0 1],'facecolor',[0 0 1]); //plot -z as a surface to show the lower
//half of the cylinder
//program for plotting paraboloid
deff('[z]=f2(x,y)','z=(x^2+y^2)/5') ĀĀĀĀĀĀĀĀĀĀĀĀĀĀĀĀĀ //define the function z=f2(x,y)
x= [-4:0.05:4]; y = [-4:0.05:4]; ĀĀĀĀĀĀĀĀĀĀĀĀĀĀĀĀĀĀĀĀĀĀĀ //Populate the vectors x and y.
z=feval(x,y,f2); ĀĀĀĀĀĀĀĀĀĀĀĀĀĀĀĀĀĀĀĀĀĀ //evaluate matrix z as per f2(x,y) for every value of x & y
surf(x,y,z','edgecolor',[1 0 1],'facecolor',[1 0 1]); //plot z as a surface to show theĀĀĀĀĀĀĀĀĀĀ //paraboloid
OUTPUT:
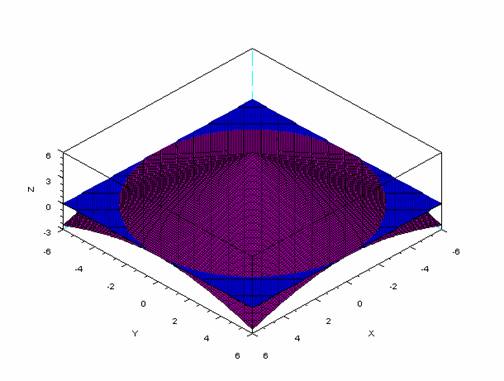
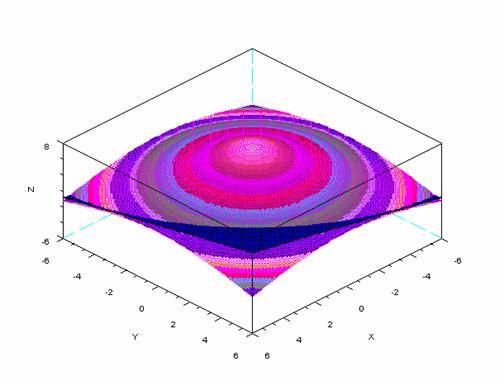
2) Plot the surfaces defined by the cone (6-z)2 = x2 +y2and the plane
z=0 and show their intersection.
//Plotting of cone
deff('z=f1(x,y)','z=6-sqrt(x^2+y^2)')ĀĀĀ //define the function z=f1(x,y) as a conical surface
x=-6:0.1:6 ; y=x ;ĀĀ //populate the vectors x and y
fplot3d(x,y,f1) ĀĀĀĀĀĀĀĀĀĀĀ //plot 3D graph of function z=f1(x,y) to show the conical surface
//Plotting of plane
deff('z=f2(x,y)','z=0') ĀĀĀĀĀĀĀĀĀĀĀĀĀĀĀĀĀĀĀĀĀĀĀĀĀ //define the function z=f2(x,y) as a plane surface
x=-6:0.1:6 ; y=x ; ĀĀĀĀĀĀĀĀĀĀĀĀĀĀĀĀĀĀĀĀĀĀĀĀĀĀĀĀĀĀĀ //populate the vectors x and y
e=gce() ĀĀĀĀĀĀĀĀĀĀĀĀĀĀĀĀĀĀĀĀĀĀĀĀĀĀĀĀĀĀĀĀĀĀĀĀĀĀĀĀĀĀĀĀĀĀ //get the handle of graphics
e.color_mode =23; ĀĀĀĀĀĀĀĀĀĀĀĀĀĀĀĀĀĀĀĀĀĀĀĀĀĀĀ //set the color of the plot
fplot3d(x,y,f2) ĀĀĀĀĀĀĀĀĀĀĀ //plot 3D graph of function z=f2(x,y) to show the plane surface
OUTPUT:
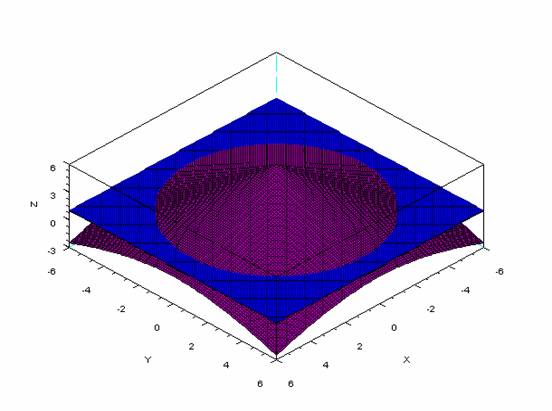
3) Plot the surfaces defined by the cone (6-z)2 = x2 +y2and the plane
z=1 and show their intersection.
//Intersection of a conical surface with a plane to form a circle
//plot the conical surface
deff('z=f1(x,y)','z=6-sqrt(x^2+y^2)') //define the function z=f1(x,y) as a conical surface
x=-6:0.1:6 ;y=x ;ĀĀĀĀĀĀĀĀĀĀĀĀĀĀĀĀĀĀĀĀĀĀĀĀĀĀĀĀĀĀĀĀĀ //populate the vectors x and y
fplot3d(x,y,f1) //plot 3D graph of function z=f1(x,y) to show the conical surface
//plot the plane
deff('z=f2(x,y)','z=1') //define the function z=f2(x,y) as a plane surface
x=-6:0.1:6 ;y=x ;ĀĀĀĀĀĀĀĀĀĀĀĀĀĀĀĀĀĀĀĀĀĀĀĀĀĀĀĀĀĀĀĀĀ //populate the vectors x and y
e=gce()ĀĀĀĀĀĀĀĀĀĀĀĀĀĀĀĀĀĀĀĀĀĀĀĀĀĀĀĀĀĀĀĀĀĀĀĀĀĀĀĀĀĀĀĀĀĀĀ //get the handle of graphics
e.color_mode =23;ĀĀĀĀĀĀĀĀĀĀĀĀĀĀĀĀĀĀĀĀĀĀĀĀĀĀĀĀ //set the color of the plot
fplot3d(x,y,f2) //plot 3D graph of function z=f2(x,y) to show the plane surface
OUTPUT:
4) Plot the surfaces defined by the cone (8-z)2 = x2 +y2and the plane
z=0.1x+0.3y+4 and show their intersection.
//Intersection of a conical surface and a plane to form an ellipse
//plot the conical surface
deff('z=f1(x,y)','z=8-sqrt(x^2+y^2)') //define the function z=f1(x,y) as a conical surface
x=[-6:0.1:6];y=x ; ĀĀĀĀĀĀĀĀĀĀĀĀĀĀĀĀĀĀĀĀĀĀĀĀĀĀĀĀĀĀĀ //populate the vectors x and y
z=feval(x,y,f1); ĀĀĀĀĀĀĀĀĀĀĀĀĀĀĀĀĀĀĀĀĀĀ //evaluate matrix z as per f1(x,y) for every value of x & y
surf(x,y,z','edgecolor',[1 0 1],'facecolor',[1 0 1]); ĀĀĀĀĀ //plot z as a surface to show the
//conical surface
//plot the plane
deff('z=f2(x,y)','z=.1*x+.3*y+4')ĀĀĀĀĀĀĀĀĀ //define the function z=f2(x,y) as a plane surface
x=[-6:0.1:6];y=x ; ĀĀĀĀĀĀĀĀĀĀĀĀĀĀĀĀĀĀĀĀĀĀĀĀĀĀĀĀĀĀĀ //populate the vectors x and y
e=gce()ĀĀĀĀĀĀĀĀĀĀĀĀĀĀĀĀĀĀĀĀĀĀĀĀĀĀĀĀĀĀĀĀĀĀĀĀĀĀĀĀĀĀĀĀĀĀĀ //get the handle of graphics
e.color_mode =16; ĀĀĀĀĀĀĀĀĀĀĀĀĀĀĀĀĀĀĀĀĀĀĀĀĀĀĀ //set the color of the plot
fplot3d(x,y,f2); //plot 3D graph of function z=f2(x,y) to show the plane surface
OUTPUT:
5) Plot the surfaces defined by the cone (8-z)2 = x2 +y2and the plane
z=0.5(x+y) and show their intersection.
//Intersection of a conical surface with a plane to form a hyperbola
//Plotting of cone
deff('z=f1(x,y)','z=8-sqrt(x^2+y^2)')ĀĀĀ // define the function z=f1(x,y) as a conical surface
x=[-6:0.1:6];y=x ;ĀĀĀĀĀĀĀĀĀĀĀĀĀĀĀĀĀĀĀĀĀĀĀĀĀĀĀĀĀĀĀĀ //populate the vectors x and y
z=feval(x,y,f1); //evaluate matrix z as per f1(x,y) for every value of x & y
surf(x,y,z','edgecolor',[1 0 1],'facecolor',[1 0 1]); ĀĀĀĀĀ //plot z as a surface to show the
//conical surface
//Plotting of plane
deff('z=f2(x,y)','z=.5*(x+y)')ĀĀĀĀĀĀĀĀĀĀĀĀĀĀĀ // define the function z=f2(x,y) as a plane surface
x=[-6:0.1:6];y=x ; ĀĀĀĀĀĀĀĀĀĀĀĀĀĀĀĀĀĀĀĀĀĀĀĀĀĀĀĀĀĀĀ //populate the vectors x and y
e=gce()ĀĀĀĀĀĀĀĀĀĀĀĀĀĀĀĀĀĀĀĀĀĀĀĀĀĀĀĀĀĀĀĀĀĀĀĀĀĀĀĀĀĀĀĀĀĀĀ //get the handle of graphics
e.color_mode =23; ĀĀĀĀĀĀĀĀĀĀĀĀĀĀĀĀĀĀĀĀĀĀĀĀĀĀĀ //set the color of the plot
fplot3d(x,y,f2); //plot 3D graph of function z=f2(x,y) to show the plane surface
OUTPUT:
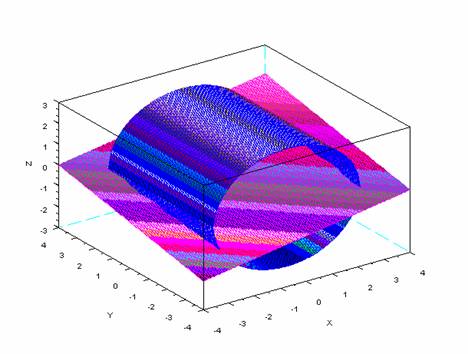
6) Plot the surfaces defined by the cylinder z2 = x2 - 8and the plane
z=0.2(x+y) and show their intersection.
//program for plotting cylinder
deff('[z]=f1(x,y)','z=sqrt(8-x^2)') // define the function z=f1(x,y) as a cylidrical surface
x= [-2.9:0.05:2.9]; y = x;ĀĀĀĀĀĀĀĀĀ //populate the vectors x and y
z=feval(x,y,f1); //evaluate matrix z as per f1(x,y) for every value of x & y
surf(x,y,z','edgecolor',[0 0 1],'facecolor',[0 0 1]); ĀĀĀĀĀ //plot z to show the upper half of the
//cylindrical surface
surf(x,y,-z','edgecolor',[0 0 1],'facecolor',[0 0 1]);//plot -z to show the lower half of the
//cylindrical surface
//program for plotting plane
deff('[z]=f2(x,y)','z=(x+y)/5') ĀĀĀĀĀĀĀĀĀĀĀĀĀ // define the function z=f2(x,y) as a plane surface
x= [-4:0.05:4]; y = x; ĀĀĀĀĀĀĀĀĀĀĀĀĀĀĀĀĀĀĀĀĀĀĀĀĀĀ //populate the vectors x and y
z=feval(x,y,f2); ĀĀĀĀĀĀĀĀĀĀĀĀĀĀĀĀĀĀĀĀĀĀ //evaluate matrix z as per f2(x,y) for every value of x & y
surf(x,y,z','edgecolor',[1 0 1],'facecolor',[1 0 1]);ĀĀĀĀĀĀ //plot z as a surface to show the
//plane surface
OUTPUT:
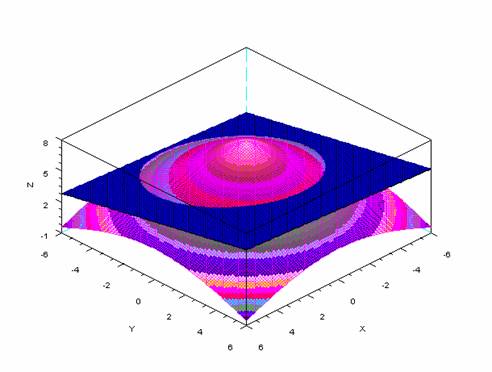
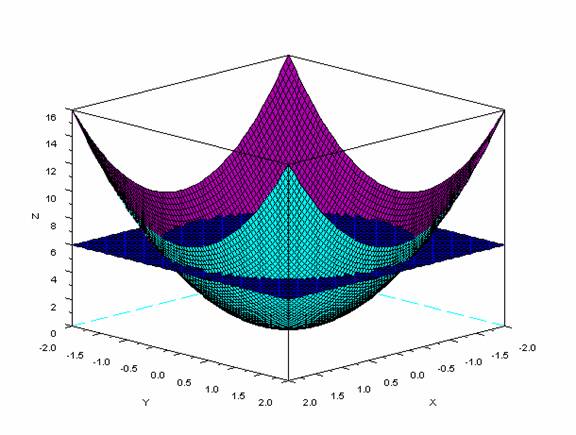
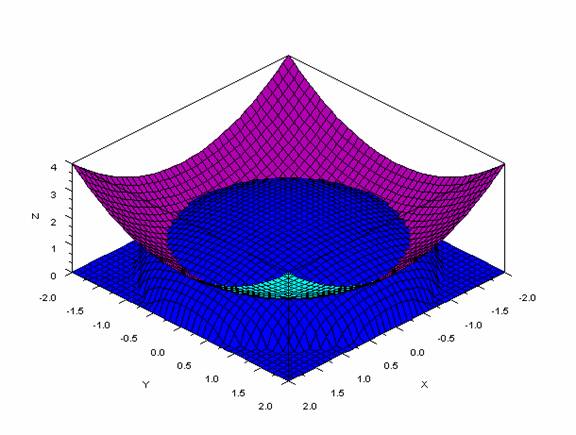
7) Plot the surfaces defined by the paraboloid z = 2(x2+y2) and the plane
z=6 and show their intersection.
//Plotting of paraboloid and sphere
deff('z=f1(x,y)','z=(x^2+y^2)/.5') // define the function z=f1(x,y) as a parabolic surface deff('z=f2(x,y)','z=6') // define the function z=f2(x,y) as a plane surface
x=-2:0.05:2 ;y=x ; //populate the vectors x and y
fplot3d(x,y,f1)//plot 3D graph of function z=f1(x,y) to show the parabolic surface
e=gce()ĀĀĀĀĀĀĀĀĀĀĀĀĀĀĀĀĀĀĀĀĀĀĀĀĀĀĀĀĀĀĀĀĀĀĀ //get the handle of graphics
e.color_mode =23; ĀĀĀĀĀĀĀĀĀĀĀĀĀĀĀ //set the color of the plot
fplot3d(x,y,f2) //plot 3D graph of function z=f2(x,y) to show the plane surface
OUTPUT:
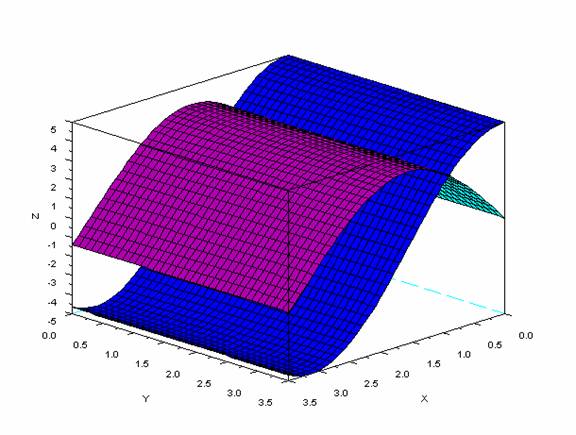
8) Plot the surfaces defined by z = 4sinx and z=5cosx and show their intersection.
deff('z=f1(x,y)','z=4*sin(x)') // define the function z=f1(x,y) as a sinusoidal surface
deff('z=f2(x,y)','z=5*cos(x)') // define the function z=f2(x,y) as a cosinusoidal surface
x=0:0.1:3.5 ;y=x ; ĀĀĀĀĀĀĀĀĀĀĀĀĀĀĀĀĀĀĀ //populate the vectors x and y
fplot3d(x,y,f1) //plot 3D graph of function z=f1(x,y) to show the sinusoidal surface
e=gce()ĀĀĀĀĀĀĀĀĀĀĀĀĀĀĀĀĀĀĀĀĀĀĀ //get the handle of graphics
e.color_mode =23; //set the color of the plot
fplot3d(x,y,f2) //plot 3D graph of function z=f2(x,y) to show the cosinusoidal surface
OUTPUT:
9) Plot the surfaces defined by the paraboloid z = 0.5(x2+y2) and the sphere x2+y2+z2=4 and show their intersection.
//Plotting of paraboloid and sphere
deff('z=f1(x,y)','z=(x^2+y^2)/2') // define the function z=f1(x,y) as a parabolic surface
deff('z=f2(x,y)','z=sqrt(-x^2-y^2+4)')// define the function z=f1(x,y) as a spherical surface
x=-2:0.1:2 ;y=x ; ĀĀĀĀĀĀĀĀĀĀĀĀĀĀĀĀĀĀĀĀĀĀĀĀĀĀĀĀĀĀĀĀ //populate the vectors x and y
fplot3d(x,y,f1)//plot 3D graph of function z=f1(x,y) to show the parabolic surface
e=gce()ĀĀĀĀĀĀĀĀĀĀĀĀĀĀĀĀĀĀĀĀĀĀĀĀĀĀĀĀĀĀĀĀĀĀĀĀĀĀĀĀĀĀĀĀĀĀĀ //get the handle of graphics
e.color_mode =23;ĀĀĀĀĀĀĀĀĀĀĀĀĀĀĀĀĀĀĀĀĀĀĀĀĀĀĀĀ //set the color of the plot
fplot3d(x,y,f2)//plot 3D graph of function z=f1(x,y) to show the spherical surface
OUTPUT:
|
Politica de confidentialitate | Termeni si conditii de utilizare |

Vizualizari: 491
Importanta: ![]()
Termeni si conditii de utilizare | Contact
© SCRIGROUP 2025 . All rights reserved