| CATEGORII DOCUMENTE |
| Bulgara | Ceha slovaca | Croata | Engleza | Estona | Finlandeza | Franceza |
| Germana | Italiana | Letona | Lituaniana | Maghiara | Olandeza | Poloneza |
| Sarba | Slovena | Spaniola | Suedeza | Turca | Ucraineana |
FEASIBILITY ANALYSIS FOR CONSTRUCTION ![]() PROJECTS
PROJECTS
1 Feasibility of Construction Projects-Economic Approach
Construction investments represent major commitments of resources and have serious consequences on the profitability and financial stability of an organization which proposes to develop a construction project.
The feasibility of a project refers to whether the project can be done without violating certain accepted rules, principles or constraints.
The constraints can range from logical consistency or physical possibility to arbitrary criteria based on the goals and objectives of some involved party.
When referring to constraints at least three main approaches to feasibility can be identified, namely:
Technical feasibility - dealing with structural requirements, buildability or construction technology related constraints. These aspects are likely to become dominant mostly in case of large or avant garde projects.
Legal feasibility - referring to codes and zoning regulations or other legal constraints that can prevent a project from going on.
Economic and Financial Feasibility - referring to constraints that are measures of economic performance of the project delivery process (ex: cost, revenue, rate of return, etc).
It is important to distinguish between the economic evaluation of alternative schemes which are meant to satisfy the same main goal and the alternative financing plans for the project.
The former refers to the evaluation of cash flow representing the benefits and costs associated with the acquisition and operation of the facility. More specific, this approach refers to design, construction, operation and maintenance of the facility.
The latter refers to the evaluation of the cashflow representing the incomes and expeditures as a result of adopting a specific financing plan for funding the project.
The essential difference between traditional economic feasibility assessment and those of modern approach to feasibility is the latter's recognition of the effect of the time value of money. This modern approach to economic feasibility (investment appraisal technique) regards to the project life cycle. It begins with the initial conception of the project and ends with its disposal. The attention that now is being paid to life cycle cost analysis (or modern approach to economic feasibility) was generated by the energy crisis in the 1970'.
Life Cycle Costing
Life Cycle Costing is the use of the discounted cashflow (taking into account the effect of time versus money) to allow alternative designs to be evaluated at an earlier stage tacking into account not only the initial capital cost, but also the future running costs and income.
A systematic approach to economic feasibility (Life Cycle Costing Analysis) of investments consists in the following major steps:
(i) Generate a set of alternative projects for investment consideration;
(ii) Establish the planning horizon for economic analysis (usually the horizon refers to the project useful life);
(iii) Estimate the cashflow profile for each alternative project;
(iv) Establish the criterion for accepting or rejecting a proposal on the basis of the objective of the investment;
(v) Perform risk (sensitivity) analysis;
(vi) Accept or reject a proposal on the basis of the established criteria;
The advantages of life Cycle Costing analysis consists in:
(i) Assessing the total cost and resources required in the project;
(ii) Identifying the required funding in relationship to any constraint;
(iii) Conducting trade- off studies between alternatives;
(iv) Estimating the revenue levels required to produce a required rate of return.
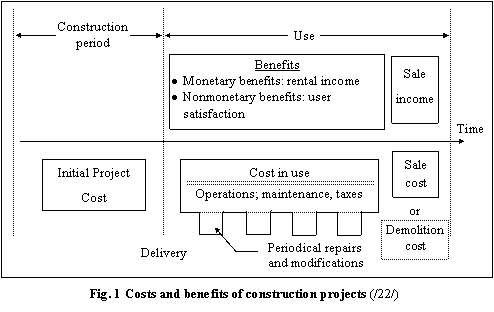
For example the total cost of a project over the project life cycle will include the following components (Eq.1) and (Fig.1)
|
|
where:
CT Total cost of the project over the project useful life.
CI Initial project cost referring to:
cost of feasibility studies
cost of design
land cost
permits
construction costs
professional fees
furniture/ equipment
construction financing cost.
CU Cost- in- use, due to:
operation
maintenance
taxes
repair and replacement
CD Disposal cost: sale or demolition cost.
These costs (both initial and future costs) must be weighed against the benefits of the constructed facility. Normally , the benefits are expected to occur lately in the future. This is why discounted analyses are needed for.
2. The time value of money; Discounting
Discounting is a method of appraising capital (investment) projects by comparing their income in the future and their present and future costs with the current equivalents. The current equivalents take account of the fact that future receipts are less valuable than current, in that interest can be earned on current receipts. On the other hand, future payments are less onerous than current payments, as interest can be earned on money retained for future payments. Accordingly, future receipts and payments are discounted to their present values by applying discount factors, taking account of interest that could be earned for the relevant number of years to the date of payment or receipt.
Interest is the charge made for borrowing money. The rate of interest is the charge made, expressed as a percentage of the total sum loaned, for a stated period of time (usually one year or one month). Interest can be simple or compound.
In simple interest, the charge is calculated on the sum loaned only. (Eq.2)
|
|
where:
IS the simple interest ; (lei)
P the principal sum ; (lei)
r the rate of interest ; (% /year) or (% /month) etc.
T the time period ; (year) ;(month) etc.
In compound interest, the charge is calculated on the sum loaned plus any interest that has accrued in previous periods (Eq.3).
|
|
where:
n the number of periods for which interest is separately calculated.
Discount Factors
The basic discounting procedures are presented bellow:
(i) Future value: The future value (F) of a present single amount of money (P) invested for n periods at a rate r is given by Equation 4.
|
|
Example 10:1. If a sum of money, say P 1000 lei, is invested in an account for n 5 years at an interest rate of r 10%, the amount that can be withdrawn at the end accumulates as follows:
F1 P P i P(1 r) 1100 lei: at the end of the first period (year)
F2 F1 F1 i P(1 r)2 1210 lei : at end of the second period (year)
F5 P(1 r)5 165 lei; the end of the fifty period (year)

(ii) Present value: The present value (P) of a sum (F) to be received n periods from the present date (year zero), considering an interest rate r, is given by Equation 5.
|
|
This is the inverse of the future value
Example 2. If a sum of money, say 165 lei is required in five years time, what amount has to be invested today to generate this amount if interest rate is 10%. The solution is:
![]()
The terms (1 r)n or 1/(1 r)n are called discount factors which usually are given by tables.
The discounting procedure provides a convenient way to compare two different sums of money occurring at different times.
(iii) Future value of an annuity
If a uniform amount A is invested at the end of each period for n periods, at a rate of interest r per period, then the total equivalent amount FVa at the end of the n periods will be as follows: (note that the last payment/ receipt does not earn any interest).

|
|
By multiplying both sides of the equation by (1 r) and subtracting the result from the original equation, the result will be:
|
FVa r A(1 r)n- 1 |
which can finally be rearranged to designate the future value of the annuity (Eq.8)
|
|
The term ![]() is sometimes known as the uniform series compound amount factor .
is sometimes known as the uniform series compound amount factor .
The relationship can be re-arranged to yield:
|
|
Here, the term ![]() is known as the uniform series sinking fund factor, because it determines the
uniform end-of-period investment A that must be made in order to provide an
amount FV at the end of 'n' periods.
is known as the uniform series sinking fund factor, because it determines the
uniform end-of-period investment A that must be made in order to provide an
amount FV at the end of 'n' periods.
(iv) Present value of an annuity (PVa)
Now, we are interested in the present value PVaof a series of equal payments of amount A, considering a discount rate r per each period.

To find this value, simply discount the future value of the annuity (Eq.8) as a lump sum, as given by Eq. The resulting equation is:
|
|
The discount factor now is known as the uniform series present value factor.
Equation 10 gives the equivalent uniform periodic series (annuity) required to replace a present value of PV.
By inverting Eq. 10, we can obtain the equivalent uniform series of end- of -period values A from a present value PV (Eq.11).
|
|
In this case, the discount factor is called the uniform series capital recovery factor.
3. Economic Performance Measures
The problem of assessing the worthwhileness of a project from an economic point of view is equivalent to that of selecting appropriate measures of economic performance and than estimating its value for the project under scrutinity from a standpoint of a decision maker .
A measure of performance can be defined as a variable that can be measured, that tells the designer / constructor / economic analyst of any object or solution for a problem how well a solution is doing, how well the object or solution serves his purpose.
A measure of economic performance for a building for example, is a variable that measures how well the building meets the economic objectives and concerns of the client. Similar assessment can be considered related to execution of the building contract.
There are several economic performance measures that are commonly used by decision makers, whoever they might be, such as cost, profit, rate of return, payback - period, internal rate of return etc.
The interrelationship between money and time for a project lasting more than 1 year (usually) is presented using related cash-flows and applying the discounting procedures.
A cash flow is the transfer of money out of (cash out º negative cash flow) or into (cash in º positive cash flow) the project in question at a known or forecast point in time.
Knowledge of the amount and time of cash flows representing a project permit the use of modern investment techniques (discounted procedure).
(i) Cost(C)
Cost is an expenditure, usually of money, incurred in achieving a goal (ex: building a factory, construct a bridge, etc.). Cost may be viewed as initial cost, running annual cost, life cycle cost etc. For an investor constructing a factory , for example, the initial cost of the project (or the maximum capital lock-up) is the maximum demand for capital from the start of the project until the project starts its operations(brings incomes).
Present value of Cost .
Often in engineering economic studies, the typical use of present worth analyze is to compare two ore more schemes, each with different initial investment and different running costs. The present worth is found by discounting the cost flows of the schemes using a predetermined rate of interest (Minimum attractive rate of interest). The minimum most attractive rate of interest is usually equal to the current rate of interest for borrowed capital (cost of capital rate) plus an additional rate for such factors as risk, uncertainty etc. (Eq.12)
|
|
where:
PV present value of the project's costs
Cn Cost occurring in interval n
T total period of time (comprising n periods)
r rate of interest considered (discount rate)
(ii) Income
For investment purposes, income is any sum a person or organization receives as a return on investments (revenue).
The discounted income for a project scheme will be: (Eq.13)
|
|
where:
P.IN. present value of the project's incomes.
Consider the project generates incomes after one year. Year zero is for investment.
(iii) Net Present Value (N.P.V.)
A net present value (N.P.V) can be seen to be a statement in present day terms of the value of an investment to an investor. N.P.V. is calculated by summing the project (investment) revenues and costs over its full life and subtracting the later from the former (Eq.14).
|
|
where:
Cfn The incremental cash- flow in period n. Receipts are designated as positive and payments as negative cash flows.
C0 The initial investment;
r Usually is the most attractive rate or return.
If the calculation yields a positive NPV, then the project should be profitable. NPV is a measure of a gain from a project.
Calculation of NPV as a profitability measure for a project often involves subjective judgments (future cash flow and interest rates), therefore the decision making process should consider other profitability measures as well (payback period, benefit-cost ratio etc.).
N.P.V. can be seen as the net profit of an investment .
(iv) Payback Period (Pb)
This involves how long is taken for a project(usually years) to repay its original invested capital. The shorter the payback period, the greater is the likelihood that the project will be profitable. The weakness of this method is that it does not take account of the cashflows that occur after the payback period.
(v) Average Rate of Return (ARR)
This is the annual amount of income from an investment expressed as a percentage of the original investment. (Eq.15)
|
|
where:
B The benefit/profit generated by investment. This will be taken as the sum of the cash flows minus the initial investment.
In this respect, if discounted, B N.P.V.
This rate is very important in assessing the relative merits of different investments. It indicates what share of the money invested 'returns' to the investor each year.
Obviously, the greater the ARR, the more profitably the project/variant of investment will be.
The weakness of this method is that it usually does not discount benefits and therefore does not discriminate between the timing of the cash flows. For this purpose, the benefit cost ratio is considered.
(vi) Benefit-Cost Ratio (B/C)
The benefit- cost ratio is the ratio of the discounted benefits to the discounted cost at the same point in time. To be profitable, a project should have its B/C ratio greater than one (Eq.16).
|
|
However, a project with the maximum B/C ratio among a group of mutual exclusive proposals, generally does not necessarily lead to the maximum net benefit. Therefore, this approach is not recommended by itself for use in selecting the best proposal but in conjunction with other profitability measures .
(vii) Internal Rate of Return (IRR)
The Internal Rate of Return is that discount rate that will produce zero Net Present Value for a project (Eq.17)
|
|
The IRR can be seen as the maximum interest rate that could be paid on borrowed capital assuming that all the outlay to fund the project is acquired as an overdraft. The IRR is sometime called Discounted Cashflow Yield.
If the IRR exceeds the market rate of interest , then the project is profitable (This means that the project NPV will be positive).
INFLATION
Inflation is the persistent rise in the level of prices and wages throughout an economy.
So far it has been assumed that the forecasts of future costs and revenues have been at today's prices. However, for insight analysis the effect of inflation may be considered. The simplest way for doing this is to adjust the interest rate used to discount the future cash flows. The cash flows remains estimated at today's princes (year zero) but the discount rate will take account both of the interest rate and inflation rate (Eq.18).
|
|
where:
d The 'real' discounting rate (decimal figure)
r The interest rate (decimal figure)
i The inflation rate (decimal figure)
Then, the discounting factor for present values will be 1/(1 d)n.
4. Application of Economic Performance Measures
The following examples will illustrate a few application ways of the Economic Performance Measures for construction.
Example3
A contractor proposes to buy a new item of a certain plant. For this purpose he considered two possible schemes , each with a different initial investment and different running costs, as follows:
|
Initial plant cost |
Scheme 1 |
Scheme 2 |
|
5, 000 u.v. |
4, 000 u.v. |
|
|
Running cost |
600 u.v./year |
800 u.v./year |
|
Useful life considered |
6 years |
6 years |
If the interest rate is r 10%, which is the less costing scheme/the optimum solution.
Solution
If no discounting is considered, obviously the less costing scheme should be scheme 1 with a total cost over the useful life of 8,600 u.v. instead of 8,800 u.v. as for scheme 2.
However, so far the cost of capital was not considered. Applying the discounting procedure and calculating the present values of the two schemes will generate a more realistic result. The calculation is based on Eq.5 for determining the present value of future amounts of money. (Table 1)
Table 1. Calculation of Present Value (r
|
Year (n) |
Discounting factor |
Scheme 1 |
Scheme 2 |
||
|
f r)n |
Value (Cn) |
Present value by year (Cnxf) |
Value (Cn) |
Present value by year (Cnxf) |
|
|
545.46 | |||||
|
495.84 | |||||
|
450.78 | |||||
|
409.80 | |||||
|
372.54 | |||||
|
338.70 | |||||
|
P.V. |
7, 613.12 | ||||
Thus, since scheme 2 has in fact the smaller present value (of cost) it is said that scheme 2 is more economic.
What is being compared in fact is the 1000 u.v. extra initial investment of scheme 1 with the 200 u.v. extra running cost in scheme 2. (Is 1000 u.v. now more or less than 200 u.v. each year for the next 6 years; the interest rate being 10%?).
From previous calculation 1000 u.v. now is 128.96 u.v. more than 200 u.v. each year for six years.
Note .The same conclusion would result if the particular formula for discounting annuities had been used .
The present value of a regular seria (annuity) of payments/ receipts is given by Eq.19.
|
|
where:
PVa The present value of an annuity
A The uniform amount of money payments (receipts) continuing for a duration of n periods. (payments/ receipts occur at the end of period)
Thus the present value discount factor for both schemes (when r 10% and n 6 years) is 4.3552 (from tables).
Having said this, the calculation is very simple:
P.V.1 600x4.3552
P.V.2 800x4.3552 Þoptimum.
Example 4
Find the Internal Rate of Return for the project below (Table 2)
Table 2. Project Cash Flow
|
Stage of investment |
Year |
Project's cash flow (x104 lei) |
|
Investment | ||
|
Return | ||
Solution
The calculation of IRR is given in Table 3 by applying the discounting procedure (Remember that IRR is that particular interest rate that makes the project NPV equal to zero).
Table 3 Calculation of IRR
|
Year |
Project Cashflow |
First Trial |
Second Trial |
||
|
Present Value Factors at 7% |
Present Value |
Present Value Factors at 8% |
Present Value |
||
|
Net Present Values: |
NPV1 |
NPV2 | |||
Then, interpolating between 7% and 8%, gives the IRR:
![]()
The graph bellow (Fig.2) illustrates the same result.
Fig. 2 N.P.V. versus
interest rate

Thus, if the cost of capital is greater then 7.52%, the project does not yield enough to be profitable.
Example 5
An investor is considering three project schemes in order to decide on which of them to invest his money. The three schemes, whose cashflows are outlined in Table 4, are to be apprised according to the modern economic performance measures. If you were the investor's consultant, which scheme would you propose? The interest rate is 5%.
Table 4. Cashflows (105 lei)
|
Year |
Project schemes |
||
|
A |
B |
C |
|
Solution
(i) Payback
If decision makers specify a required payback period, and if an investment has a payback period equal to, or shorter than this period , the investment is accepted. If the payback period is longer than that specified, the project is rejecter. If no period is specified, the shorter the payback period, the better .
If we assume that cash flows are received at the end of each year, the payback for the three schemes is shown in Table 5.
Table 5. Payback calculation
|
Project |
Initial outlay(-) |
Cumulative cashflow ( |
Payback Period. |
||||
|
Years: | |||||||
|
A |
Never |
||||||
|
B |
2 Years |
||||||
|
C |
3 Years |
||||||
Table 5 reveals the following:
Project A will never manage to payback the initial investment. (It will have a negative N.P.V.).Consequently it should be rejected.
Project B will have a payback period of 2 years.
Project C will have a payback period of 3 years.
According to this performance measure, project C is the one to be accepted.
However , this criteria used by itself is not completely relevant, since the future receipts are neglected (ex: Project C will have a 700 u.v. gain after its payback period since project B will have only 150 u.v.). Also, the timing of the cashflows were neglected. This is why this economic performance measure should be used in conjunction with other performance measures.
(ii) Net Present Value
From this stage, project A has been rejected.
The calculation of N.P.V. for the remained projects is given in Table 6
Table 6. Net Present Value Calculation
|
Year |
Discount factor for r |
Cash flows (Todays values) |
Present Value |
||
|
B |
C |
B |
C |
||
|
Net Present Value (NPV): | |||||
Operation of the NPV rule indicates that project B and C should be accepted (they both have NPV>0). Further, from these two possible options, project C appears more profitable.
(iii) Average Rate of Return
Being a relative measure, the Average Rate of Return calculation may be conducted using the initial cashflows. The calculation for projects B and C is shown in Table 7.
TABLE 7. Average Rate Of Return Calculation (Non- discount approach)
|
Project |
Total cash inflow (I) |
Initial Cost (C0) |
Non-discounted Benefit (B I-C0) |
Project Life (T) |
Average Rate of Return |
|
B | |||||
|
C |
Both rates are greater than the market rate of return used for discounting (r 5%). Therefore both projects can be considered as being acceptable.
Where the design maker specifies a greater rate of interest (say 'the most attractive rate of return - MARR') to motivate himself for investment into a particular field, the average rate of return of a project should be greater than this MARR. (For example if MARR 15%, then project B will be rejected by the decision maker). However, from the ARR stand print, project C again appears of being the most profitable.
(iv) Internal Rate of Return
Following the methodology given by Eq.17 and Example 4 the Internal Rates of Return for projects B and C have resulted as follows:
IRRB
IRRC
This means that project B can afford a cost of capital up to 25%, whereas project C can be funded considering a maximum level of the cost of capital of 20%. Hence, in respect with this performance criteria, project B appears more advantageous.
Anyway, for borrowing rates around the market interest rate, project C has resulted to be the optimum choice. However, further discussions may appear related to the hierarchy score the decision maker is giving to each performance measures. The cumulative net cash flow for project C is outlined in Fig.3.

Example 6
Determine the adjusted discount rate (d) if the interest rate (r) is 10% and the inflation rate (i) is 6%.
Solution
The adjusted discount rate is given by Eq.(18) as follows:
![]()
Example 7
A contractor is considering to either purchase and run a new item of plant or to hire it.
The cost of the new plant is 55 mil. lei and the forecasted salvage value is 10 mil. lei. The operation of the new plant will cost 5 mil. lei per annum. The hiring cost of the plant is 15 mil lei per annum.
For both schemes, the period considered is 5 years, and the discount rate is r
Which of the two alternatives is more economical?
Solution
The input data for the problem can be arranged as follows:
|
Input data |
Alternatives |
|
|
Buying |
Hiring |
|
|
Initial Cost |
50 mil. lei | |
|
Running Cost |
5 mil. lei p.a. |
15 mil. lei p.a. |
|
Salvage value |
10 mil.lei p.a. | |
|
Duration |
5 years |
|
|
Discount rate | ||
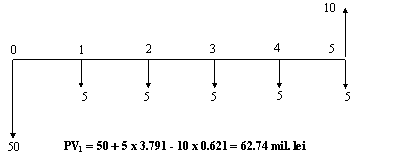 Knowing that the discount factor for an annuity for 5
years and r 10% is 3.791 (Table B4) and that the discount factor
for an amount occurring in year 5 is 0.621 (Table B2) the equivalent costs (present value) of the two
alternatives is given bellow. The corresponding cash flows are also presented.
Knowing that the discount factor for an annuity for 5
years and r 10% is 3.791 (Table B4) and that the discount factor
for an amount occurring in year 5 is 0.621 (Table B2) the equivalent costs (present value) of the two
alternatives is given bellow. The corresponding cash flows are also presented.
Buying
 Hiring
Therefore, hiring is more economical.
|
Politica de confidentialitate | Termeni si conditii de utilizare |

Vizualizari: 3818
Importanta: ![]()
Termeni si conditii de utilizare | Contact
© SCRIGROUP 2025 . All rights reserved

