| CATEGORII DOCUMENTE |
| Bulgara | Ceha slovaca | Croata | Engleza | Estona | Finlandeza | Franceza |
| Germana | Italiana | Letona | Lituaniana | Maghiara | Olandeza | Poloneza |
| Sarba | Slovena | Spaniola | Suedeza | Turca | Ucraineana |
1.1. Theoretical Background
1.1.1 Tension Static Test
Theoretical Stress-Strain Diagram for Structural Steel
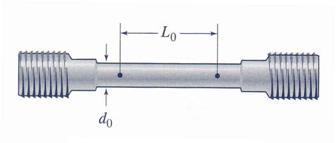
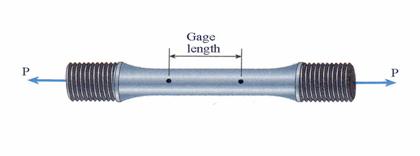
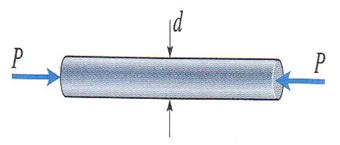
The test is conducted by subjecting a specimen made of
structural steel to a monotonically increasing loading. The specimen is
schematically depicted in Figure 1.1.1 During the test a series of pairs
(P*,d*) are collected and tabulated. Consequently, the normal stress ![]() and the corresponding
axial strain
and the corresponding
axial strain ![]() are calculated as:
are calculated as:
![]() (1.1)
(1.1)
![]() (1.2)
(1.2)
where ![]() is the initial area of
the specimen and
is the initial area of
the specimen and ![]() is the current elongation.
is the current elongation.
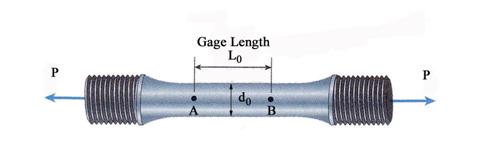
Figure 1.1.1
The normal stress ![]() and axial strain
and axial strain ![]() calculated using the
formulae (1.1) and (1.2) are called engineering
stress and engineering stain,
respectively. If the normal stress and the normal strain are calculated using
the value of the measurements at the particular moment the normal stress and
the corresponding axial strain are called true
stress and true strain,
respectively. They are calculated as:
calculated using the
formulae (1.1) and (1.2) are called engineering
stress and engineering stain,
respectively. If the normal stress and the normal strain are calculated using
the value of the measurements at the particular moment the normal stress and
the corresponding axial strain are called true
stress and true strain,
respectively. They are calculated as:
![]() (1.3)
(1.3)
![]() (1.4)
(1.4)
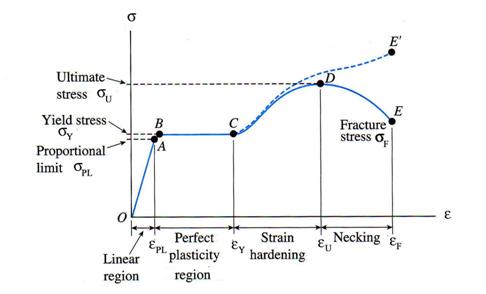
Figure 1.1.2
The typical tensile stress-strain diagram for structural steel behavior is shown in Figure 1.1.2. This stress-strain diagram plotted in the e-s plan is characterized by a number of defining points:
Point A (ePL ,sPL) - where sPL is the proportional limit;
Point B (eY ,sY) - where sY is the yielding point;
Point C (eEY ,sEY) - where sEY is the end stress of the perfect plastic region;
Point D (eU ,sU) - where sU is the ultimate stress;
Point E (eF ,sF) - where sF is the fracture stress;
Point E (eF ,sF) - where sF is the true fracture stress.
The true stress-strain diagram is plotted with a dashed line above the engineering stress-strain diagram.
For some materials (i.e. aluminum), which do not have after
the proportional limit point a perfect plasticity region, the yield point is
not easily identify and, consequently, it is determined using a method called
the offset method. A straight line
parallel to the initial linear part of the stress-strain diagram and passing
through ![]() is drawn. The
construction is shown in Figure 1.1.3. The point A is located at the
intersection between the stress-strain diagram and the parallel line. The
stress corresponding to point A is called offset
yield stress and is used instead of the yield stress.
is drawn. The
construction is shown in Figure 1.1.3. The point A is located at the
intersection between the stress-strain diagram and the parallel line. The
stress corresponding to point A is called offset
yield stress and is used instead of the yield stress.
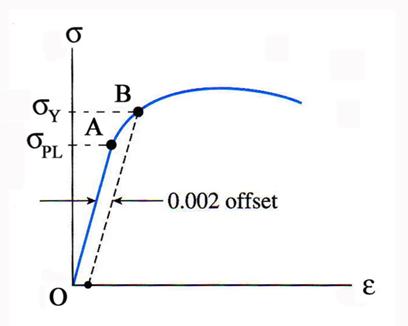
Figure 1.1.3
1.1.2 Material Behavior
Non-Linear Elastic Behavior
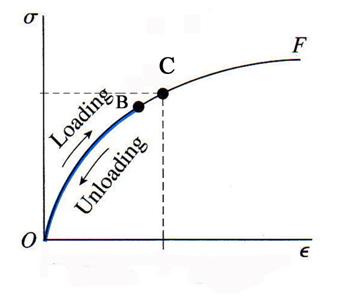
Figure 1.1.4
The non-linear elastic behavior is characterized by a one-to-one correspondence between the stress
and the strain. During loading or unloading for a given value of ![]() always corresponds the
same value of
always corresponds the
same value of![]() . Mathematically this can be expressed as:
. Mathematically this can be expressed as:
![]() (1.5)
(1.5)
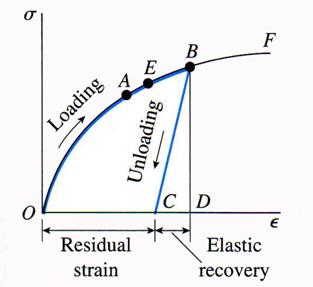
Figure 1.1.5
The elasto-plastic behavior is characterized by a different behavior during loading and unloading phases. During the unloading phase the material behaves elastically. Consequently, even when the load is completely removed a residual strain remains.
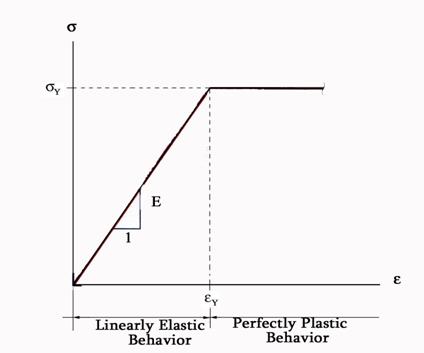
Figure 1.1.6
An idealized elasto-plastic behavior typical for structural steel is the Prandthls curve shown in Figure 1.1.6. This curve represents a material with an elastic-perfect plastic behavior.
Ductile and Brittle Materials
A material is ductile if can undergo large plastic strain before fracture. In contrast, a material which fails at small strain in classified as brittle. The difference between the behavior of a ductile and brittle material is schematically pictured in Figure 1.1.7.
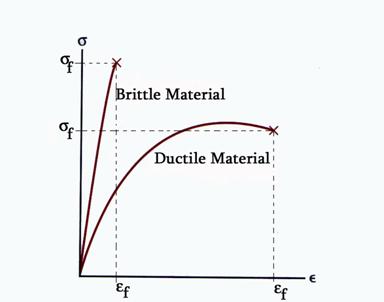
Figure 1.1.7
The ductility of a material in tension is characterized by its elongation and reduction of the area at the cross-section where the failure occurs. The percentage elongation is defined as:
![]() (1.6)
(1.6)
where ![]() and
and![]() are the original and failure gage lengths, respectively.
are the original and failure gage lengths, respectively.
The percentage reduction in area is obtained as:
![]() (1.7)
(1.7)
where ![]() and
and![]() are the original and failure areas, respectively.
are the original and failure areas, respectively.
1.1.3 Linear Elasticity, Hooks Law and Poissons Ratio
A bar is loaded in tension, as shown in Figure 1.1.8.b, the axial elongation is accompanied by lateral contraction.
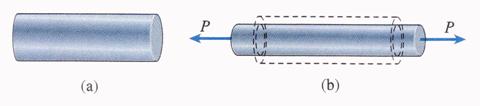
Figure 1.1.8
The structural steel axially loaded under the
proportionality limit![]() behaves linearly
elastic. Mathematically, the relation between the stress and strain is
expressed by the Hooks Law:
behaves linearly
elastic. Mathematically, the relation between the stress and strain is
expressed by the Hooks Law:
![]() if
if ![]() (1.8)
(1.8)
where E is the modulus of elasticity.
The lateral strain ![]() is proportional with
the longitudinal strain
is proportional with
the longitudinal strain ![]() . The relation is:
. The relation is:
![]() (1.9)
(1.9)
where ![]() is the Poissons ratio.
is the Poissons ratio.
Consequently, the elastic behavior of a material is
characterized by two material constants: the modulus of elasticity, E, and the
Poissons ratio, ![]() .
.
1.2 Solved Problems
Problem 1.2.1- Strain Measurements
A mechanical extensometer uses the lever principle to magnify the elongation of a test specimen enough to make the elongation (or contraction) readable. The extensometer shown in Figure 1.2.1 is held against the test specimen by a spring that forces two sharp points against the specimen at A and B. The pointer AD pivots about a pin at C, so that distance between the contact points at A and B is exactly La = 15 cm (the gage length) of this extensometer when the pointer points to the origin, O, on the scale. In a particular test, the extensometer arm points 'precisely' at point O when the load P is zero. Later in the test, the 25.5 cm long pointer points a distance d = 0.30 cm below point O. What is the current extensional strain in the test specimen at this reading?
A. General Observations
The body of the extensometer is considered rigid in comparison to the specimen subjected to deformation. Consequently, the distance BC remains unaffected by the deformation of the specimen. This finding implies that during the elongation only the point A can move from A to A*.
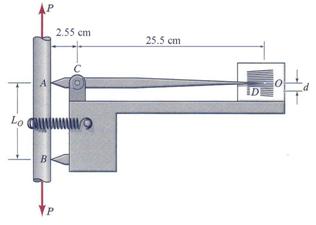
Figure 1.2.1
B. Calculations
The distance AA* represents the current elongation![]() . Using the geometrical ratio:
. Using the geometrical ratio:
![]()
the current elongation ![]() is obtained:
is obtained:
![]()
The strain is calculated as:
![]()
Problem 1.2.2- Stress-Strain Diagram
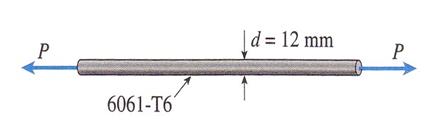
The tension specimen, shown in Figure 1.2.2.a, with an initial diameter d0=12
mm and a gage length L0 = 50 mm is used to obtain the
load-elongation data contained in Table 1.2.1. Using the test data plot the
stress-strain diagram and then calculate the following: (a) the proportional
limit, (b) modulus of elasticity, (c) yield stress at 0.2% offset, (d) ultimate
stress, (e) percent elongation and (g) percentage area.
Figure 1.2.2.a
Table 1.2.2 Load-Elongation Test Data
|
Force (kN) |
Elongation (mm) |
Force (kN) |
Elongation (mm) |
A. General Observations
The initial measurements of the diameter and gage length of the specimen are:
![]()
![]()
Consequently the size of the original area is obtained as:

![]()
![]()
B. Calculations
B.1 Calculation of the Stress-Strain Diagram
The stress and strain corresponding to each measurement step
are calculated using the collected values contained in Table 1.2.2. There are a
number of eighteen (18) measured steps![]() . The measured values of the elongation
. The measured values of the elongation ![]() and applied
force
and applied
force ![]() are collected into two
separate vectors:
are collected into two
separate vectors:
Force Elongation


The stress ![]() and strain
and strain ![]() values corresponding
to each one of the measured steps are calculated using the formulae below:
values corresponding
to each one of the measured steps are calculated using the formulae below:
![]()
 engineering strain
 engineering stress
The obtained values are show in a tabular format below.
Strain Stress
The minimum and maximum values obtained are:
![]()
![]()
![]()
![]()
![]()
![]()
The graphical representation of the stress-strain diagram is shown in Figure 1.2.2.b. A qualitative analysis of the stress-strain diagram indicated an elasto-plastic behavior and consequently, a ductile behavior.
Figure 1.2.2.b
B.2 Calculation of the modulus of elasticity
To obtain the value of the modulus of elasticity, E, representative for the elastic behavior of the material, the ratio of the stress and strain increased corresponding to each measured step is calculated:
![]()
![]() stress increased
stress increased
![]() strain increased
strain increased
 the ratio
stress-strain
the ratio
stress-strain
The numerical values of the ratio stress-strain obtained are tabulated below and plotted in Figure 1.2.2.c. It should be remarked that despite the fact that theoretically the modulus of elasticity is constant in the elastic range, due to the measurement errors a small variation is obtained.
Figure 1.2.2.c
The elastic range is represented by the almost constant variation and in this case ends after the third measurement point. The theoretical value of the modulus of elasticity is obtained by averaging the calculated values of the measurement steps pertinent to the elastic behavior:
![]()

![]()
![]()
B.3 Calculation of the 0.2% Offset Stress
The construction is shown in Figure 1.1.3. The line anchored
at the offset strain value and parallel to the linear portion of the
stress-strain diagram is constructed below using two description points: ![]() and
and ![]()
![]()
![]()
strain stress


The graphical construction is shown in Figure 1.2.2.d. The
value of the stress ![]() corresponding to
corresponding to ![]() is obtained by reading
the stress scale as:
is obtained by reading
the stress scale as:
![]()
This value can be considered as the yielding stress.
Figure 1.2.2.d
B.4 Calculation of the Ultimate Stress
Analyzing the stress-strain diagram the value of the ultimate stress is obtained as:
![]()
![]()
![]()
B.5 Calculation of the Percentage Elongation
The percentage elongation is calculated at failure:
![]()

![]()
![]() %
%
B.5 Calculation of the Percentage of Area Reduction
The calculation of the area at failure is based on the assumption that volume remained constant during the deformation:
![]()
![]()
![]()

![]()
![]()
The percentage reduction of the area is calculated as:

![]()
![]() %
%
Problem 1.2.3
Two tension specimens with initial identical dimensions, diameter d0=12 mm and gage length L0 = 50 mm, are made of structural materials A and B, respectively. They are tested in tension until the failure is reached. The test data obtained is shown in Table 1.2.3. Conduct the following tasks: (a) calculate the percent elongation and the percent of reduction in the area at failure (b) draw to scale the idealized stress-strain diagram pertinent to both materials; (c) classify the material as either brittle or ductile and explain the judgment.
Table 1.2.3 Tensile Test Data
|
Data |
Material |
|||
|
A |
B |
|||
|
1. Gage at failure |
73.66 mm |
56.39 mm | ||
|
2. Diameter at failure |
6.68 mm |
11.96 mm | ||
|
2. Modulus of Elasticity |
6.9x10¹⁰ Pa |
7.2x10¹⁰Pa | ||
|
3. Yield Stress |
3.5x10⁷ Pa |
5.0x10⁸Pa | ||
|
4. Ultimate Stress |
8.9x10⁷Pa |
5.7x10⁸Pa | ||
|
5. Failure Stress |
1.25 |
4.14 | ||
|
6. Ultimate Strain |
0.85 of ultimate |
0.85 of ultimate | ||
A. General Observations
The initial measurements of the specimen dimensions (gage length and diameter) are:
![]()
![]()
The initial area of the specimen is:

![]()
![]()
B. Calculations
B.1 Calculation of the percentage elongation
The percentage elongations corresponding to both materials are:

![]()
![]()
![]() material A
material A

![]()
![]()
![]() material B
material B
B.2 Calculation of the percentage reduction of the area
The diameters and areas at failure, corresponding to material A and B, respectively, are:
![]()
![]()
The areas at failure are:

![]()
![]()

![]()
![]()
The percentage of the area reduction is obtained as:

![]()
![]()
![]() material A
material A

![]()
![]()
![]() material B
material B
B.3 Schematic plot of stress-strain relations
The strain corresponding to the yielding point is:

![]()
![]() material A
material A

![]()
![]() material B
material B
The strain at failure is calculated as:

![]()
![]() material A
material A

![]()
![]() material B
material B
The strain corresponding to the ultimate stress:
![]()

![]()

The representative points of the stress-strain curves are:
material A material B


The plot of the two stress-strain diagrams is shown in Figure 1.2.3.
Figure 1.2.3
B.4 Classification of the materials
The percentage of elongation previously calculated for the two materials is:
![]()
![]() material A
material A
![]()
![]() material B
material B
The ductility ratios, other ductility indicators, are calculated as:

![]()
![]() material A
material A

![]()
![]() material B
material B
It can be concluded that both materials show ductile behavior. Obviously the material A is more ductile than B.
Problem1.2.4- Mechanical Properties of Materials
A tensile specimen of a certain alloy has an initial diameter of 13 mm and a gage length of 200 mm. Under a load P = 20 kN, the specimen reaches its proportional limit and is elongated by 3 mm. At this load the diameter is reduced by 0.064 mm. Calculate the following material properties: (a) the proportional limit, (b) sPL the modulus of elasticity, E, and (c) the Poisson's ratio, n.
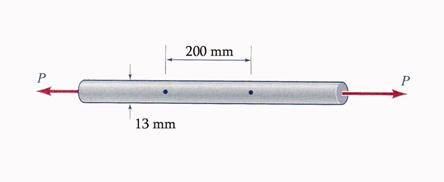
Figure 1.2.4
A. General Observations
The initial measurements of the specimen dimensions (gage length and diameter) are:
![]()
![]()
The original area of the specimen is:
![]()
![]()
At the application of the axial load ![]() the proportional limit, defined by the stress
the proportional limit, defined by the stress ![]() and the strain
and the strain![]() , is attained.
, is attained.
B. Calculations
B.1 Calculation of proportional limit corresponding stress and strain
The strain ![]() is calculated using the measured elongation
is calculated using the measured elongation ![]() as:
as:

![]()
![]()
The stress ![]() is obtained as:
is obtained as:

![]()
![]()
B.2 The modulus of elasticity
The modulus of elasticity is calculated:

![]()
![]()
B.3 The Poissons Ratio
The Poissons
Ratio represents the ratio between the transversal strain ![]() and the longitudinal strain
and the longitudinal strain![]() . Consequently, the transversal strain
. Consequently, the transversal strain ![]() is obtained employing
the reduction of the diameter
is obtained employing
the reduction of the diameter![]() :
:

![]()
![]()
The Poissons Ratio is calculated:

![]()
![]()
Problem1.2.5
A wire of length L0 = 2.50 m and diameter d0= 1.6 mm is stretched by tensile forces P = 1250 N. The wire is made of a copper alloy having a stress-strain relationship that may be described mathematically by the following equation:
![]()
![]() where e is nondimensional and s has MPa units.
where e is nondimensional and s has MPa units.
Conduct the following tasks: (a) construct a stress-strain diagram for the material, (b) determine the elongation of the wire due to the forces P, (c) if the forces are removed, what is the permanent strain of the bar considering an average elastic modulus Eaverage=7.086x10¹⁰ Pa and (d) if the forces are applied again, what is the proportional limit?
A. General Observations
The initial measurements of the specimen dimensions (gage length and diameter) are:
![]()
![]()
The original area of the specimen is:
![]()
![]()
The strain is limited to the value:
![]()
B. Calculations
B.1 Plot the stress-strain diagram
A number of
thirteen (13) points are considered ![]() and
consequently, the step increased of the strain is calculated as
and
consequently, the step increased of the strain is calculated as 
![]()
The points representing the strain and stress diagram are obtained:
![]()
![]()

The stress-strain diagram values are first tabulated and then plotted in Figure 1.2.5.
Figure 1.2.5
B.2 Calculation of the stress and strain corresponding to load P=1250 N
The stress is obtained as:

![]()
![]()
The corresponding strain is calculated using the expression:

![]()
![]()
B.3 Calculation of the remnant strain after unloading
The remnant
strain is obtained by constructing the unloading line which is anchored at
point ![]() and has a slop of
and has a slop of![]() .
.
The remnant strain is obtained as:

![]()
![]()
The unloading line is constructed using two points described as:


B.4 The loading proportional limit
The loading
follows the same linear behavior described by the unloading and the new
proportional limit is ![]() , the point where the unloading begun.
, the point where the unloading begun.
![]()
![]()
1.3 Proposed Problems
Problem 1.3.1
A 'pencil' laser extensometer, like the mechanical lever extensometer in Prob.1.2.1, measures elongation, from which extensional strain can be computed, by multiplying the elongation. In Figure 1.3.1 the laser extensometer is being used to measure strain in a reinforced concrete column. The target is set up across the room from the test specimen so that the distance from the fulcrum, C, of the laser to the reference point O on the target is dOC = 5m. Also, the target is set so that the laser beam points directly at point O on the target when the extensometer points are exactly Lo = 150 mm apart on the specimen, and the cross section at B does not move vertically. At a particular value of (compressive) load P, the laser points upward by an angle that is indicated on the target to be f = 0.0030 rad. Determine the extensional strain in the concrete column at this load value.
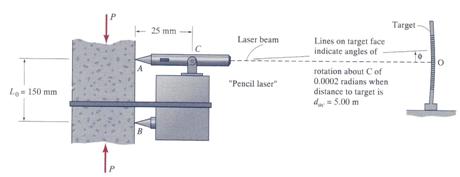
Figure 1.3.1
Problem 1.3.2
A tensile
test is conducted on a flat-bar steel specimen having the dimensions shown in
Figure 1.3.2. Using the experimental load-elongation data, shown in Table
1.3.2, collected during the test conduct the following tasks: (a) plot a curve
of engineering stress, ![]() , versus engineering strain,
, versus engineering strain, ![]() ; (b) determine the modulus of elasticity of this material;
(c) use the 0.2%-offset method to determine the yield strength,
; (b) determine the modulus of elasticity of this material;
(c) use the 0.2%-offset method to determine the yield strength, ![]() , of this material.
, of this material.
Table 1.3.2 Tension Test Data
|
Force (kN) |
Elongation (mm) |
Force (kN) |
Elongation (mm) |
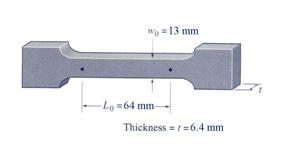
Figure 1.3.2
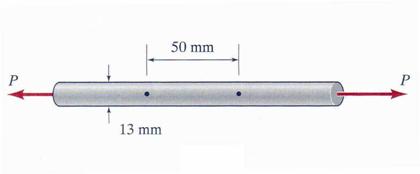
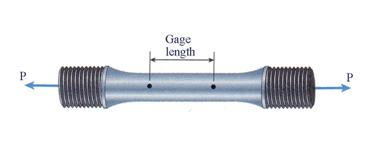
Problem 1.3.3
A standard
ASTM tension specimen, shown in Figure 1.3.3, with an original diameter d0=13
mm and a gage length L0 = 50 mm is used to obtain the
load-elongation data contained in Table 1.3.3. Conduct the following tasks: (a)
plot a curve of engineering stress,![]() , versus engineering strain,
, versus engineering strain, ![]() ; (b) determine the modulus of elasticity of this material;
(c) use the 0.2%-offset method to determine the yield strength,
; (b) determine the modulus of elasticity of this material;
(c) use the 0.2%-offset method to determine the yield strength, ![]() , of this material.
, of this material.
Table 1.3.3 Tension Test Data
|
Force (kN) |
Elongation (mm) |
Force (kN) |
Elongation (mm) |
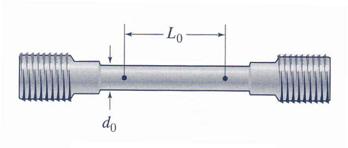
Figure 1.3.3
Problem 1.3.4
The tension
specimen, shown in Figure 1.3.3, with an initial diameter d =13 mm
and a gage length L0 = 50 mm is used to obtain the load-elongation
given in Table 1.3.4 Conduct the following tasks: (a) plot a curve of
engineering stress,![]() , versus engineering strain,
, versus engineering strain,![]() , (b) determine the modulus of elasticity of this material, (c)
use the 0.2%-offset method to determine the yield strength,
, (b) determine the modulus of elasticity of this material, (c)
use the 0.2%-offset method to determine the yield strength,![]() , of this material.
, of this material.
Table 1.3.4 Test Data
|
Force (kN) |
Elongation (mm) |
P(kN) |
∆L (mm) |
Problem 1.3.5
A specimen of a methacrylate plastic shown in Figure 1.3.5 is tested in tension at room temperature, producing the stress-strain data listed in the accompanying Table 1.3.5. Plot the stress-strain curve and determine the proportional limit, modulus of elasticity, the yield stress at 0.2% offset and establish if the material is brittle or ductile.
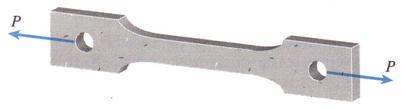
Figure 1.3.5
Table 1.3.5 Test Data
|
Stress (MPa) |
Strain |
Stress (MPa) |
Strain |
|
fracture |
Problem 1.3.6
The data shown in the accompanying Table 1.3.6 were obtained from a tensile
test of high-strength steel. The test specimen had a diameter of 13 mm and a
gage length of 50 mm as shown in Figure 1.3.6. At fracture, the elongation
between the gage marks was 3.0 mm and the minimum diameter was 10.7 mm. Plot
the conventional stress-strain curve for the steel. Determine the following:
(a) the proportional limit, (b) modulus of elasticity, (c) yield stress at 0.1%
offset, (d) ultimate stress, (e) percent elongation, and (f) percent reduction
in area.
Figure 1.3.6
Table 1.3.6 Test Data
|
Force (kN) |
Elongation (mm) |
Force (kN) |
Elongation (mm) |
|
fracture |
Problem 1.3.7
A tensile test is performed on an aluminum specimen that is 13 mm in diameter using a gage length of 50 mm, as shown in Fig. 1.3.7. When the load is increased by an amount P = 8 kN, the distance between gage marks increases by an amount DL = 0.0430 mm. Calculate: (a) the value of the modulus of elasticity, E, for this specimen, (b) If the proportional limit stress for this specimen is sPL= 280 MPa, what is the distance between gage marks at this value of stress?
Figure 1.3.7
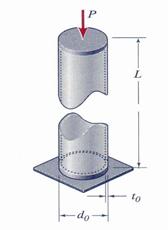
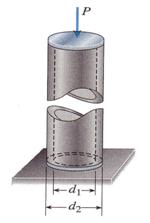
Problem 1.3.8
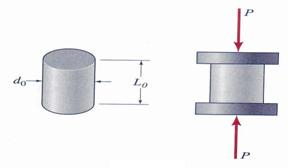
A short brass cylinder (![]() , L0 = 25.5mm) is compressed between two perfectly
smooth, rigid plates by an axial force P = 22.73 kN. (a) If the measured
shortening of the cylinder, due to this force is 0.02667 mm, what is the brass
specimen modulus of elasticity E? (b) If the increase in diameter due to the load
P is 0.00533 mm, what is the value of Poisson's ratio n
, L0 = 25.5mm) is compressed between two perfectly
smooth, rigid plates by an axial force P = 22.73 kN. (a) If the measured
shortening of the cylinder, due to this force is 0.02667 mm, what is the brass
specimen modulus of elasticity E? (b) If the increase in diameter due to the load
P is 0.00533 mm, what is the value of Poisson's ratio n
Figure 1.3.8
Problem 1.3.9
A tensile force of 500 kN is applied to a uniform segment of a titanium-alloy bar. The cross section is a 50 mm x 50 mm square, and the length of the segment being tested is 200 mm. Using titanium-alloy data from Appendix 1, determine: (a) the change in the cross-sectional dimension of the bar, and (b) the change in volume of the 200 mm segment being tested.
Problem 1.3.10
A cylindrical rod with an initial diameter of 8 mm is made of 6061-T6 aluminum alloy. When a tensile force P is applied to the rod, its diameter decreases by 0.0101 mm. Using the appropriate aluminum-alloy data from Appendix 1, determine (a) the magnitude of the load P, and (b) the elongation over a 200 mm length of the rod.
Problem 1.3.11
Under a compressive load of P = 110 kN, the length of the concrete cylinder in Figure 1.3.11 is reduced from 305 mm to 304.924 mm, and the diameter is increased from 150 mm to 150.008 mm. Determine the value of the modulus of elasticity, E, and the value of Poisson's ratio, n. Assume linearly elastic deformation.

Figure 1.3.11
Problem 1.3.12
The
cylindrical rod in Figure 1.3.12 is made of annealed (soft) copper with modulus
of elasticity E = ![]()
![]() and Poisson's ratio n = 0.33, and it has an initial diameter, d0,
of 51 mm. For compressive loads less than a 'critical load' Pcr,
a ring with inside diameter d = 51.005 mm is free to slide along the
cylindrical rod. What is the value of the critical load Pcr?
and Poisson's ratio n = 0.33, and it has an initial diameter, d0,
of 51 mm. For compressive loads less than a 'critical load' Pcr,
a ring with inside diameter d = 51.005 mm is free to slide along the
cylindrical rod. What is the value of the critical load Pcr?
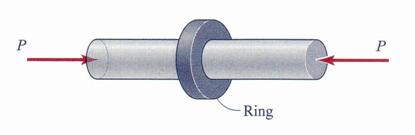
Figure 1.3.12
Problem 1.3.13
A steel pipe
column of length L0 = 3.65 m, outer diameter d0 = 102 mm,
and wall thickness t = 13
mm is subjected to an axial compressive load P = 570 kN as shown in Figure 1.3.13.
If the steel has a modulus of elasticity E = 100 GPa and Poisson's ratio n
0.30, determine: (a) the change, DL, in the length of the column, and (b) the
change, Dt in
the wall thickness.
Figure 1.3.13
Problem 1.3.14
A rectangular aluminum bar (w0 = 25 mm; t0, = 13 mm) is subjected to a tensile load P by pins at A and B (Figure 1.3.14). Strain gages measure the following strains in the longitudinal, x, and transversal, y, directions: ex m, and ey m. (a) What is the value of Poisson's ratio for this specimen? (b) If the load P that produces these values of ex and ey P = 27.5 kN, what is the modulus of elasticity, E, for this specimen? (c) What is the change in volume, DV, of a segment of bar that is initially 50 mm long?
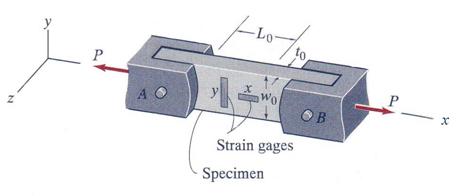
Figure 1.3.14
Problem 1.3.15
Three different materials, designated A, B, and C, are tested
in tension using test specimens having diameters of 12 mm and gage lengths of
50 mm. At failure, the distances between the gage marks are found to be 54.5,
63.2, and 69.4 mm, respectively. Also, at the failure cross sections the
diameters are found to be 11.46, 9.48, and 6.06 mm, respectively. Determine the
percent elongation and percent reduction in area of each specimen, and then,
using your own judgment, classify each
material as brittle or ductile.
Figure 1.3.15
Problem 1.3.16
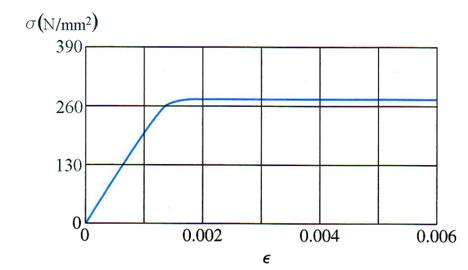
A bar made of structural steel having the stress-strain diagram shown in Figure
1.3.16 has a length of 1.525 m. The yield stress of the steel is 280 MPa and
the slope of the initial linear part of the stress-strain curve, modulus of
elasticity, is ![]() GPa. The bar is loaded axially until it elongates 5.334 mm,
and then the load is removed. How does the final length of the bar compare with
its original length?
GPa. The bar is loaded axially until it elongates 5.334 mm,
and then the load is removed. How does the final length of the bar compare with
its original length?
Figure 1.3.16
Problem 1.3.17
A bar of length 0.8 m is made of a structural steel having the stress-strain diagram shown in the Figure 1.3.17. The yield stress of the steel is 250 MPa and the slope of the initial linear part of the stress-strain curve (modulus of elasticity) is 200 GPa. The bar is loaded axially until it elongates 2.5 mm, and then the load is removed. How does the final length of the bar compare with its original length?
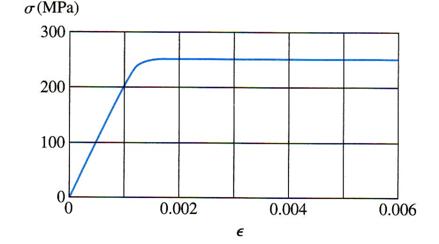
Figure 1.3.17
Problem 1.3.18
An aluminum bar has length L = 40.5 cm and diameter d = 18
mm. The stress-strain curve for the aluminum alloy is shown in Figure 1.3.18.
The initial straight-line part of the curve has a slope, the modulus of
elasticity, of![]() . The bar is loaded by a tensile force P = kN and then unloaded. (a) What is the permanent
set of the bar? (b) If the bar is reloaded, what is the proportional limit?
. The bar is loaded by a tensile force P = kN and then unloaded. (a) What is the permanent
set of the bar? (b) If the bar is reloaded, what is the proportional limit?
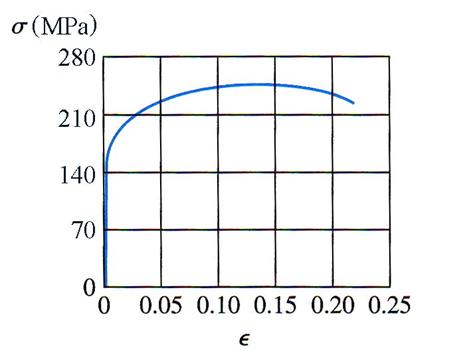
Figure 1.3.18
Problem 1.3.19
A circular bar of magnesium alloy is 750 mm long. The stress-strain diagram for the material is shown in the Figure 1.3.19. The bar is loaded in tension to an elongation of 4.5 mm, and then the load is removed. (a) What is the permanent set of the bar? (b) If the bar is reloaded, what is the proportional limit?
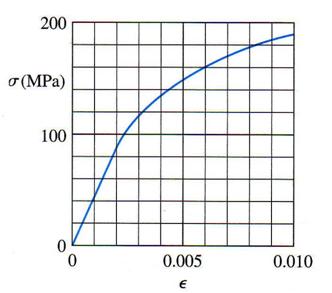
Figure 1.3.19
Problem 1.3.20
A round bar of length L = 2.5 m and diameter d = 10 mm is stretched by tensile a force P = 60 kN. The bar is made of an aluminum alloy for which the stress-strain relationship may be described mathematically by the following equation:
![]()
where s has units of megapascals (MPa) and e is nondimensional.
Conduct the following calculations: (a) construct a stress-strain diagram for the material, (b) determine the elongation of the bar due to the force P, (c) if the forces are removed, what is the permanent strain of the bar and (d) if the forces are applied again, what is the proportional limit?
Problem 1.3.21
A high-strength steel bar used in a large crane has diameter d = 57 mm as shown
in Figure 1.3.21 is compressed by axial forces. The steel has modulus of
elasticity E =![]() and Poisson's ratio n
= 0.30. Because of clearance requirements, the diameter of the bar is limited
to 57.025 mm. What is the largest compressive load Pmax that is
permitted?
and Poisson's ratio n
= 0.30. Because of clearance requirements, the diameter of the bar is limited
to 57.025 mm. What is the largest compressive load Pmax that is
permitted?
Figure 1.3.21
Problem 1.3.22
The round bar, shown in Figure 1.3.22 has the initial diameter of 12 mm
diameter and is made of aluminum alloy 6061-T6. When the bar is stretched by
axial force P, its diameter decreases by 0.012 mm. Find the magnitude of the
load P. (Obtain the material properties from Appendix 1)
Figure 1.3.22
Problem 1.3.23
A nylon bar having diameter d1 = 70 mm is placed
inside a steel tube having inner diameter d2, =70.25 mm as shown in
Figure 1.3.23. The nylon cylinder is then compressed by an axial force P. At
what value of the force P will the space between the nylon bar and the steel
tube be closed, assuming that the nylon has the modulus of elasticity E =![]() and the Poissons
ratio n = 0.4?
and the Poissons
ratio n = 0.4?
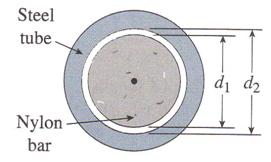
Figure 1.3.23
Problem 1.3.24
A prismatic bar of circular cross section is loaded by a tensile force P as shown in Figure 1.3.24. The bar has an initial length L0 = 3.0 m and diameter d0 = 30 mm. The bar is made of aluminum alloy 2014-T6 with modulus of elasticity E = 73 GPa and Poisson's ratio n = 0.333. (a) If the bar elongates by 7.0 mm, what is the decrease in diameter d0? (b)What is the magnitude of the load P?
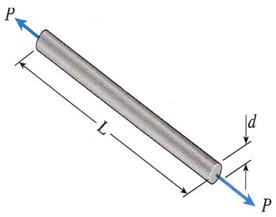
Figure 1.3.24
Problem 1.3.25
A bar of monel metal with an initial length L0 =
0.38 m and a diameter ![]() is loaded axially by a
tensile force P = 12 kN. Using the data in Appendix 1.1, determine the increase
in length of the bar and the percent decrease in its cross-sectional area.
is loaded axially by a
tensile force P = 12 kN. Using the data in Appendix 1.1, determine the increase
in length of the bar and the percent decrease in its cross-sectional area.
Problem 1.3.26
A high-strength steel wire with an initial diameter of d0= 3 mm stretches 37.1 mm when a 15-meter length of it is stretched by a force of 3.5 kN. (a) What is the modulus of elasticity, E, of the steel? (b) If the diameter of the wire decreases by 0.0022 mm, what is Poisson's ratio?
Problem 1.3.27
A hollow bronze cylinder, shown in Figure 1.3.27, is compressed by a force P.
The cylinder has inner diameter d1 = 47 mm, outer diameter d2
= 55 mm, and modulus of elasticity ![]() Mpa. When the force P increases from zero to 35 kN, the outer
diameter of the cylinder increases by 0.0432 mm. Determine: (a) the increase in
the inner diameter, (b) wall thickness and (c) the Poisson's ratio for the
bronze.
Mpa. When the force P increases from zero to 35 kN, the outer
diameter of the cylinder increases by 0.0432 mm. Determine: (a) the increase in
the inner diameter, (b) wall thickness and (c) the Poisson's ratio for the
bronze.
Figure 1.3.27
Problem 1.3.28
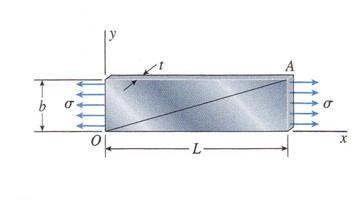
A plate of length L, width b, and thickness t is subjected to a uniform tensile
stress s applied at its ends as shown
in Figure 1.3.28. The material has a modulus of elasticity E and Poisson's
ratio n. Before the stress is applied,
the slope of the diagonal line OA is b/L. What is: (a) the slope when the
stress s is acting; (b) the increase in
area of the front face of the plate; (c) the decrease in cross-sectional area?
Figure 1.3.28
Problem 1.3.29
An axially loaded member having before loading a squared cross-section area of 3cm x 3cm and a length of 180 cm becomes 0.001 cm wider and 0.07 cm shorter after loading. Determine the Poissons ratio.
Problem 1.3.30
At the proportional limit, the 205 mm gage length of a 12.5 mm diameter alloy bar has elongated 0.3 mm and the diameter has been reduced by 0.0064 mm. The total axial load carried was 22 KN. Determine the following properties of this material: (a) the modulus of elasticity; (b) the Poisson's ratio and (c) the proportional limit.
Problem 1.3.31
A 455 kN axial load is slowly applied to a 2.50 m long rectangular bar. The bar cross-section is 2.5 cm wide and 10.5 cm deep. When loaded, the 10.5 cm side of the cross-section measures 10.445 cm and the length has increased by 0.2286 cm. Determine Poisson's ratio and Young's modulus for the material.
Problem 1.3.32
In a 0.65 cm diameter steel tie rod 3.2 m long, there is an axial tensile stress of 1.38 N/m2. Poisson's ratio for this steel is 0.25. How much has the rod elongated, and how much has its diameter been altered?
Problem 1.3.33
A 70 mm by 150 mm rectangular alloy bar elongates 0.003 cm. The member has an original length of 1.55 m and is loaded with an axial load of 44.5 kN. Considering that the proportional limit of the material is 2.4*105 kN/m2, calculate the following: (a) the axial stress in the bar, (b) the modulus of elasticity of this material, (c) if Poisson's ratio for the material is 0.25 what will be the total change in each lateral dimension?
Problem 1.3.34
A steel rod characterized by a 38 mm diameter solid circular cross-section and a length of 6 m elongates 12 mm under an axial load of 235 kN. The rod diameter decreased 0.025 mm during the loading. Determine the following properties of the material: (a) the Poisson's ratio, (b) the modulus of elasticity and (c) the modulus of rigidity.
Problem 1.3.35
A steel and an aluminum bar are coupled together end to end and loaded axially at the extreme ends. Both bars are 50 mm in diameter; the steel bar is 1.55 m long, and the aluminum bar is 1.25 m long. When the load is applied, it is found that the steel bar elongates 0.102 mm in a gage length of 205 mm. Poisson's ratio for this steel is 1/4, and the modulus of elasticity of the aluminum is 69 GPa. Determine: (a) the load, (b) the total change in length measured between the bar ends and (c) the change in the diameter of the bar.
|
Politica de confidentialitate | Termeni si conditii de utilizare |

Vizualizari: 13442
Importanta: ![]()
Termeni si conditii de utilizare | Contact
© SCRIGROUP 2025 . All rights reserved