| CATEGORII DOCUMENTE |
| Bulgara | Ceha slovaca | Croata | Engleza | Estona | Finlandeza | Franceza |
| Germana | Italiana | Letona | Lituaniana | Maghiara | Olandeza | Poloneza |
| Sarba | Slovena | Spaniola | Suedeza | Turca | Ucraineana |
Project Management with SAP R/3
Teaching Material for the Department of
Production Management

Vienna University of Economics and
Business
Administration
Andreas Mild
Alfred Taudes
V.1.0
Introduction 3
Basics & Keywords 4
Getting ready for the workshop 7
Case Study 13
Case description 13
Data for Project Realization 14
Planning the project structure 15
General 15
Implementation in SAP 17
Scheduling 26
General 26
Basic calculations 29
Implementation 30
The project planning board 41
Cost planning & Controlling 47
General 47
Implementation 48
Looking up the costs 61
Capacity Planning 64
General 64
Implementation in SAP 65
Earned Value Analysis 69
General 69
Measurement techniques 69
Calculation of Earned-Value and Deviation Analysis 73
Aggregation 74
Implementation 74
Execution 77
Implementation 77
Confirming network activities 77
Invoices 79
Material 83
Information System 86
Implementation 86
Cost reports 86
Earned-Value Analysis 92
Literature 98
This script serves as a basis for the workshop 'Project Management with SAP R/3'. This workshop is part of a series of SAP-related workshops which are held by the Department of Production Management of the Vienna University of Economics and Business Administration, headed by Prof. Dr. Alfred Taudes. The workshop was developed by Andreas Mild.
The goal of this Project Management Workshop is that, after having attended it, each student should be familiar with the theoretical backgrounds and be able to plan and control a project. The project manager has the task of ensuring that the project is executed efficiently, on time, and within the budget - which he/she achieves by making certain that the required resources and funds are available when needed. Every student should then be able to put his/her SAP knowledge into action.
To make the continuous improvement of this script possible, please report mistakes found or ideas for further development to andreas.mild@wu-wien.ac.at.
SAP R/3 is an integrated and industry-independent standard software which covers, integrates and connects all functional areas in a business. SAP AG defines integration as 'defined communication'.[1] Although R/3 is designed for complete integration, it can also be used for a couple of business areas.
SAP is the abbreviation for Systeme, Anwendungen, Produkte, the German words for Systems, Applications, Products.[3]
Information about the company can be found at: https://www.sap.com.
Projects are tasks with special characteristics. Attributes of a project are the following issues:
complexity, non-repetitivity, high risk
detailed goals to be achieved
time restrictions
high cost and capital expenditure
quality requirements
often strategic significance
To be able to plan, monitor, control, and carry out a project as a whole, the project goals must be precisely described and the activities to be performed have to be structured.
A project can be described as follows:
according to how it is organized, i.e. by explaining the project structure,
according to the processes involved.
A project starts out as a statement of work which is either a written description of the objectives to be achieved and the desired rough schedule like start and end dates. In the description one could include also performance metrics and budget constraints.
A project is further subdivided into meaningful pieces, referred to as tasks. Tasks take usually less than a few months. The task can be further subdivided into subtasks.
A work package can be defined as a group of activities combined to be assignable to a single organizational unit. [4]
The project tasks, subtasks, and work packages are brought into a hierarchy by defining a work breakdown structure.
The individual elements represent activities within the work breakdown structure and are called work breakdown structure elements (WBS elements).
WBS elements can be:
tasks
partial tasks which are subdivided further
work packages
WBS can be structured according to
object
function
phase
Which kind of structuring is used depends on the focus of the project. Objects orientation is often used, if the main part of the project is a physical object like a power plant. Functional organisation is preferred, if many different parts of an organisation or many organisations are involved.
In practice, all three kinds of structuring are used within one WBS.
Project Management can be defined as planning, directing, and controlling resources (people, equipment, material) to meet the technical, cost and time constraints of the project.[5] The primary reason why projects fail is insufficient effort in the planning phase. Project Management thus is considered as very important.
The SAP Project System enables close and constant monitoring of all aspects of a project by having constant access to data in all the departments involved.
Project management can be subdivided into project planning, i.e. the task which will be undertaken before the project starts, and project controlling during the implementation of the project.Planning must include:
organization service
process dates
costs
capacity
There are many possible project goals such as, for example, to realize a positive net present value, to achieve a high imputed interest, to minimize costs, to cover costs, to maximize gross profit, or simply to finish as early as possible. However, it is important, that goals are defined operationally, thait is when it is possible to measure to which extent the goal has been achieved.
The project manager breaks the project down into a set of activities. Then he also defines the relationships among these activities. The outcome is a guideline regarding the activities that can be performed in parallel and those that have to be done in a sequential order. This task is done via planning by network.
Now, there are activities that require capacities and resources like personnel and material. Such resources are limited and these requirements have to be considered in order to be able to develop a feasible, sound plan. Information from other modules as e.g. the material planning module is required.
The system calculates the material requirements for each step of the project and organizes that materials are bought in time to avoid delays. When purchasing material, the system takes into account order sizes, inventory policies as well as other information.
To prepare the financial statements, the value of work in progress (including project work) has to be calculated. This also requires interaction of some R/3 modules.
Thus, the system needs information from all business areas simultaneously. And this is exactly what integration does.
The project module is part of the integrated concept of SAP R/3 providing interfaces to other modules like Accounting, Distribution, Material Management and Production Planning and Control. Each area within the organization has its own structure and its own view of the project, but data has to be entered only once.
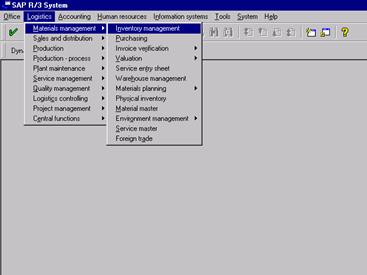
This chapter provides information on the first use of the system.
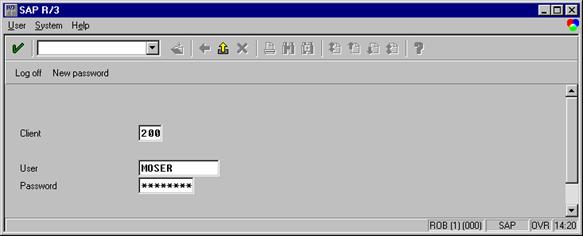
Logging on R/3
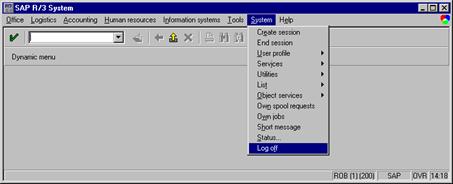
Logging off
SAP R/3 is a client/server application. Therefore, you have to cancel the connection with the server by telling it that you want to log off.
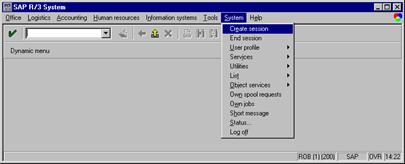
Create Session
Often it is useful to open more screens. You can do this by creating a new session, like a new document in a word processor.
SAP Help
If you want to get some basic information about a specific field, focus this field with your mouse and press <F1>.The dialog box indicates what the field is for. Sometimes even dependencies are explained.
Match codes
Match codes are useful for finding data, because it is difficult to know/remember the identification number of a line position such as a material.
Example:
You want to edit the material master of a material. You dont know the number, but you know that the material description starts with something like PM_
If you press F4 you get a search-mask where you are able to search with wildcards
After having pressed Enter you get a list with the search results.
Then you can select one material, you can sort or cancel.
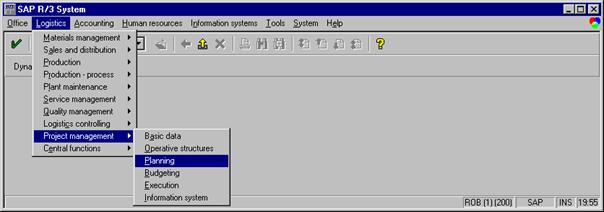
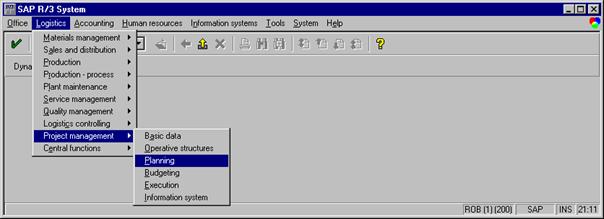
Transaction Codes
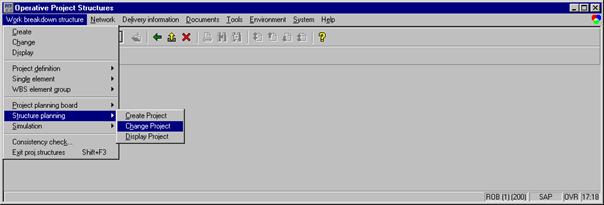
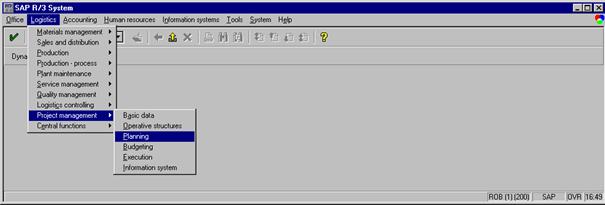
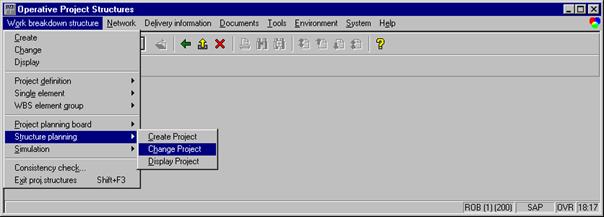
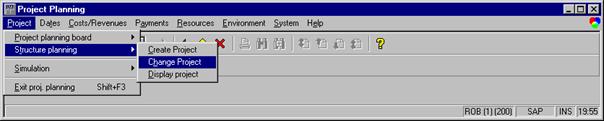
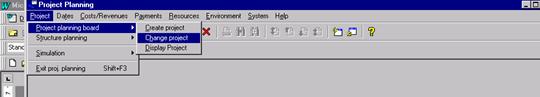
The following screen will be often used during the workshop. Thus, we can use Transaction Codes for faster access.
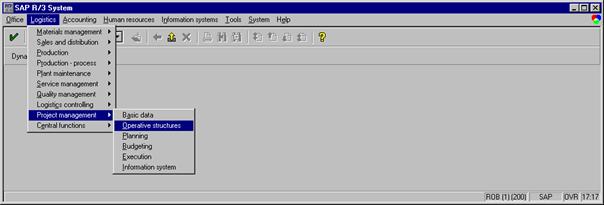
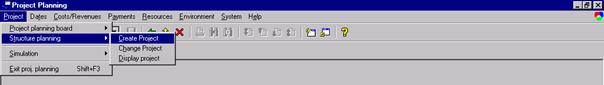
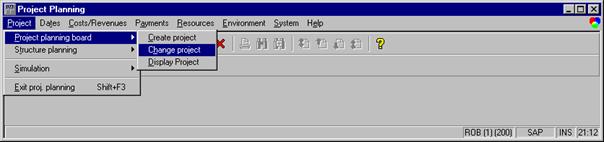
Then select Structure planning Change Project.
Now, we want to bookmark this screen.
So, we look up the transaction code.
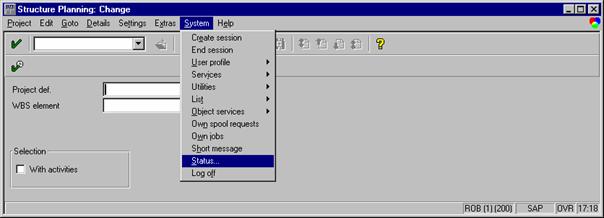
The status dialog box opens:
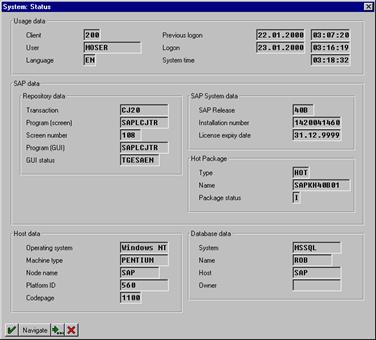
Here we see a lot of information concerning important relevant technical details.
Wherever you find yourself in the system, you can get to this screen by entering CJ20 in the Transaction screen.
Let us refine this a little bit. If you have several transaction codes, you may get confused. Key in the appropriate transaction code and the comment edit project structure.
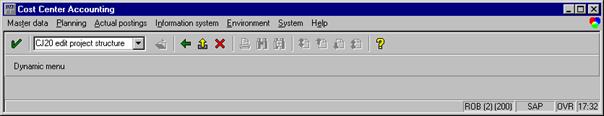
Then, if you open the combo box of the transaction codes after having entered more codes, you will find the appropriate one .
The Standard Toolbar
In many screens you will find the standard toolbar.
Save button
![]()
When you press the save button, the system also validates your input. If there was an error, you have to correct the error first,before you can proceed.
Back button
![]()
If you click the back button you return to the previous screen without saving your data.
Help
![]()
Enter button
![]()
When you have finished entering information on a screen, you press the Enter button which performs the same function as pressing the Enter key.
Exit button
![]()
Press it, if you want to leave the current application to go back to the previous menue.
Cancel button
![]()
Click on this button to exit the current task without saving. The Cancel button performs the same function as Cancel in the Edit menu.
Print button
![]()
Paging keys
![]()
Find/Find next button
![]()
Click on this button, if you want to perform a search for data required in the screen you are currently working in.
This case was developed in order to demonstrate the project system of SAP R/3 . All prices and data are pure fiction and held very simple.
The object of the project is the specification and installation of an elevator.
Physically, the Elevator consists of
a cabine
an engine
mechanical parts
a control unit
In the course of the project, these parts must be constructed, procured and assembled.
At the end, an external inspection of the entire system is prescribed.
The project must be finished by 30.6.2000.
The company consists of two work centers:
Development (PROJ-RD)
Installation (PROJ-INS)
Specification activities are performed by the Development department. Procurement activities will be done outside the project organisation, and neither cost nor capacity considerations are planned within a project for procurement. Installation is done by the Installation department.
In particular, the activities are as follows:
|
Activity |
Duration |
Work |
Work-center |
|
Specification of the cabine |
Development |
||
|
Specification of the engine |
Development |
||
|
Specification of mechanical parts |
Development |
||
|
Specification of the control unit |
Development |
||
|
Procurement of the cabine | |||
|
Procurement of the engine | |||
|
Procurement of mechanical parts | |||
|
Procurement of the control unit | |||
|
Installation I |
Installation |
||
|
Installation II |
Installation |
||
|
External Inspection |
external, 80.000 |
Specification activities can be performed in a consecutive order only. Specification starts with the cabine. After completion, the specification of the engine can be done. Then, the mechanical parts can be designed. The last activity is the design of the control unit.
After the completion of each specification activity, the procurement of the specific item can be effected.
After the procurement of all parts the Installation can start and must be done in two consecutive steps (I + II).
The final activity of the project is external inspection.
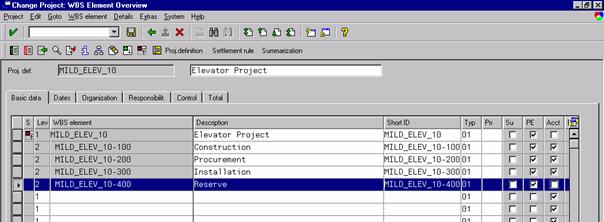
A 10% planning reserve on the baisis of planned cost is required. No actual cost should be posted to this WBS element.
Corresponding materials assigned to the purchasing activities
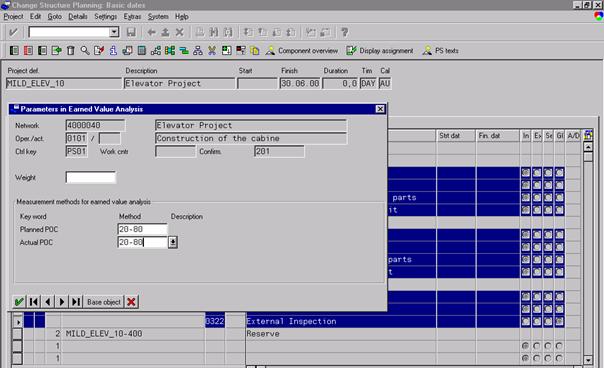
Parameters fr Earned-Value Analysis
All specification activities and Installation II use the 20-80 Method for performance measurement. Procurement activities use 0100 method.
Installation I has 3 milestones, viz. Preparation finished (20%), Installation finished (80%), Quality checked (100%).
|
Activity |
Start |
End |
Work |
|
Specification of the cabine | |||
|
Specification of the engine | |||
|
Specification of mechanical parts | |||
|
Specification of the control unit | |||
|
Procurement of the cabine |
| ||
|
Procurement of the engine | |||
|
Procurement of mechanical parts | |||
|
Procurement of the control unit | |||
|
Installation I | |||
|
Installation II | |||
|
External Inspection |
External inspection had to be paid in advance at 3.2.2000 (100000 ATS).
All material was taken from stock at given time.
Each project starts with the definition and classification of the structures required for processing and the incorporation of these into the existing enterprise structure.
The Project System has no organizational structures of its own; it has to be incorporated into the existing structure by making assignments to the organizational units in Accounting and Logistics.[7]
After that, the project is broken down into meaningful pieces in a hierarchy reaching from tasks to the lowest level, the work packages.
Datastructure in SAP
As mentioned above, the project must be incorporated into the existing structure by assigning organizational units in Accounting and Logistics.
Source: SAP Online Documentation IDES Release 4.0B
This chart provides an overview of what can be assigned to a project and its components. We will define the SAP vocabulary later on.
The work-breakdown-structure (WBS) defines the hierarchy of the tasks within a project and divides the project into useful steps.
To control costs assigned to WBS elements, operative indicators are used.
The following operative indicators can be assigned to a WBS element:
|
Planning |
WBS elements for which costs can be planned |
|
Account assignment |
WBS elements to which costs can be assigned |
|
Billing |
WBS elements to which revenues can be posted |
In this section we create a new project. We then will have a look at the control parameters. After that we enter the work breakdown structure. Finally, the status concept of SAP R/3 will be explained.
Create new project
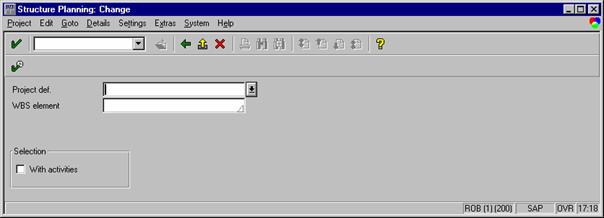
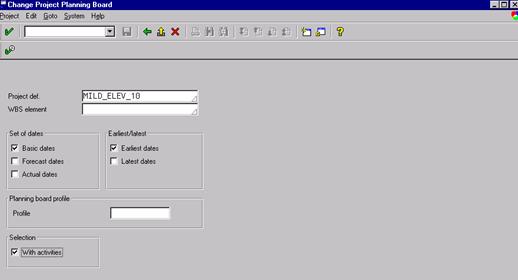
Thus, we get to the initial screen:
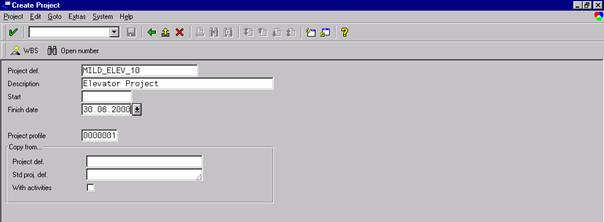
We enter our project definition, a description of our project and select the standard profile for projects.
In our case, we only set a finish date. When pressing Enter, a warning message that this date is not a working day might occur. One can pass the warning by pressing Enter
We then save our work and get the confirmation that the project has been created.
Note: It is wise to save your work from time to time. We will not mention the save procedure in the rest of the manuscript!
To continue, we have to choose to change our project.
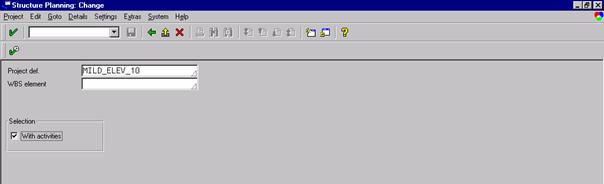
Make sure that the checkbox with activities is always checked. Click execute to proceed.
Now he have created a new project. Although we have not keyed in any data except the Project Profile Number, many parameters have already been assigned to our new project.
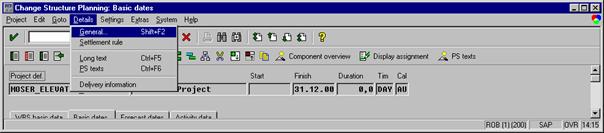
General control parameters
Click here to view the global parameters. This section should provide you with a basic insight into which parameters are set. If you feel that the results calculated by R/3 are not logical, you should have an idea where to start searching the relevant customizing details.
|
|
The network profile specifies general data like settings for the graphical representation, activity parameters, like the currency default of externally processed activities. |
In the WBS scheduling profile items like the scheduling type (forward, backward) are specified. |


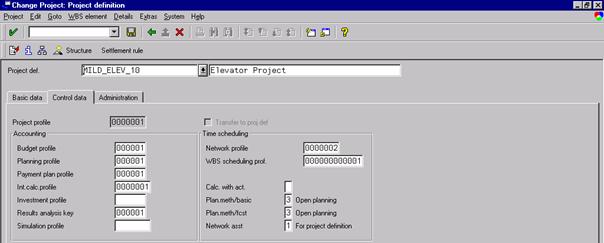
|
The budget profile specifies items like budgeting currency, the valid time horizon for budgeting back in- to the past or into the future |
The planning profile specifies, e.g., costing variant and time horizon. |
Planning parameters
In the general parameter section, many parameters are set as discussed above. Naturally, one can override a part of them in the current project. However, we are not changing any parameters.
|
|

![]()
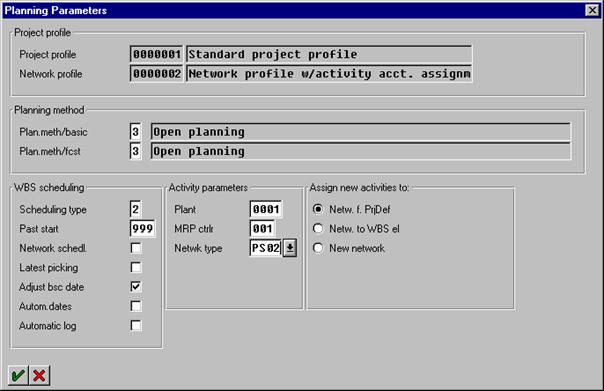
|
Here we specify what the system should do if scheduling determines dates which are not within the basic dates. In case, the scheduled dates should be taken over as new dates. |
An important parameter is the scheduling type. Here you specify, if you want to use forward, backward or other scheduling types. |
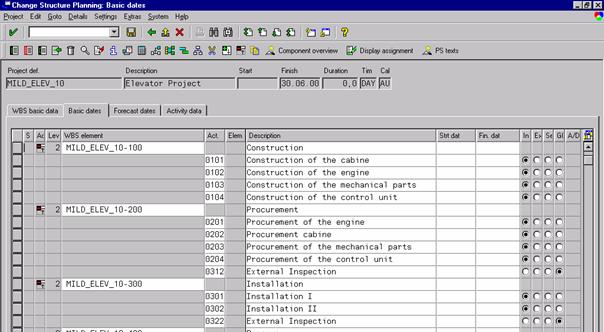
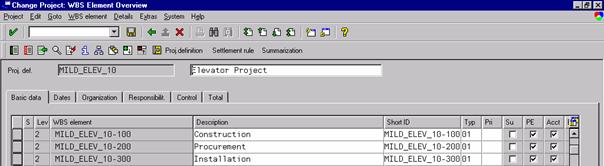
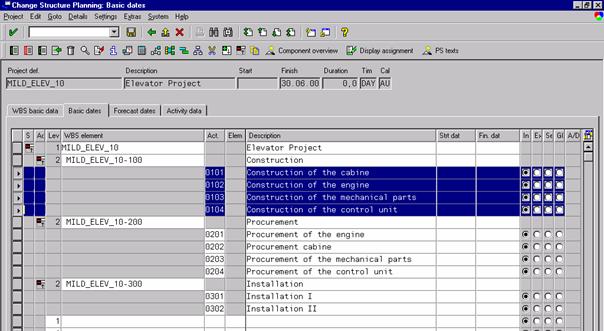
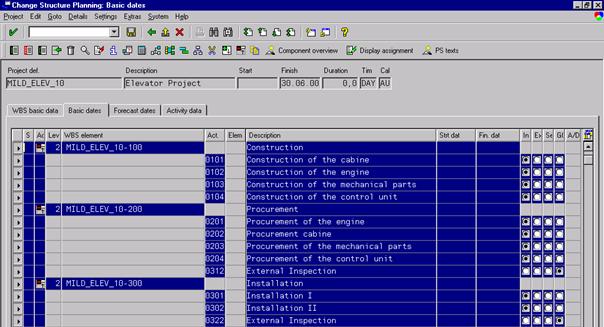
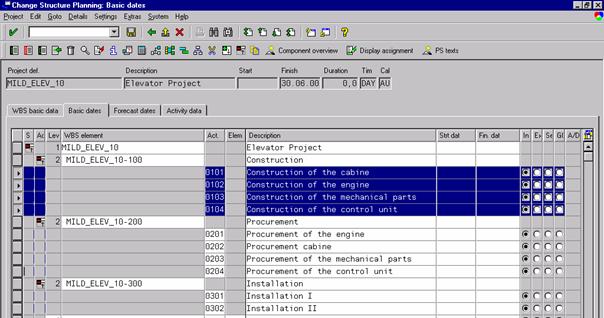
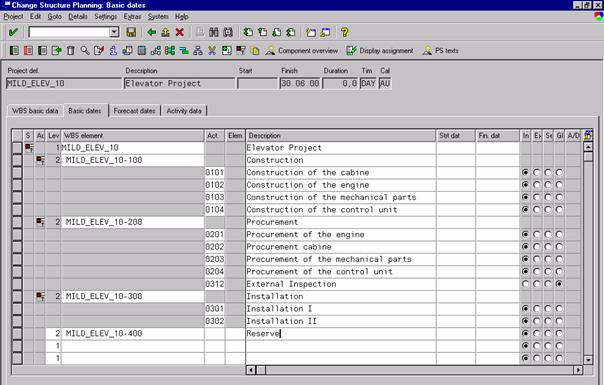
Start entering the data given in the screenshot below. If you are finished, press Enter.
Then, your screen should look like this:
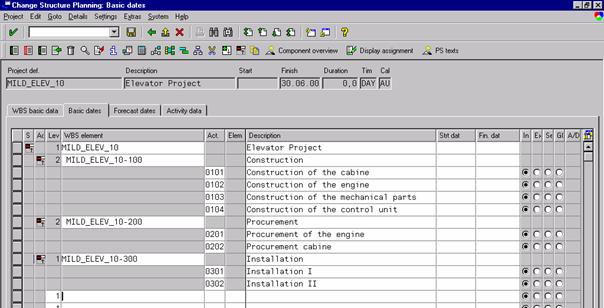
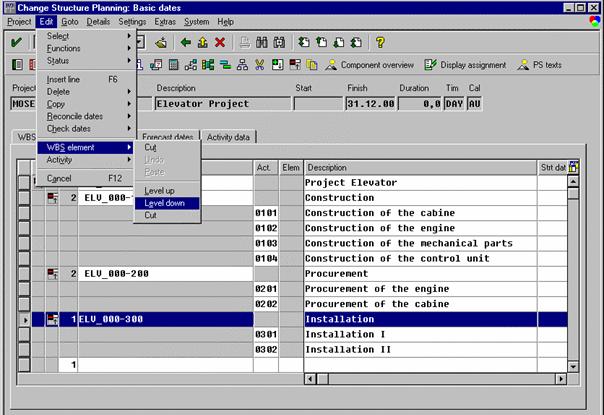
Leveling up/down WBS Elements
There is a mistake. WBS Element ELV_000-300 should have level 2.
Select the WBS Element to leveling it down.
Inserting WBS Elements/activities
We have forgotten to enter enter Activity 203, Procurement of the mechanical parts and Activity 204, Procurement of the cabine.
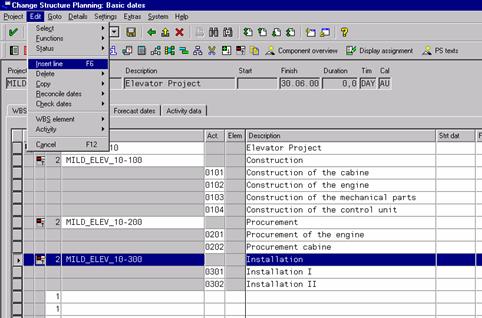
Select the row above which you want to insert a row and add it by menue or simply by pressing F6. Proceed with the second row in the same way. Do not forget that these activities do not have a level.
After these changes your screen should look like this:
The hidden-quick-menue
If you press the right mouse button, you get a list of useful commands. All these commands can also be accessed via menues and buttons. However, you are faster when you use the right-mouse-quick-menue.
User Status and Business Administration Procedures
A status documents the current state of processing of an object. Depending on which business transaction is performed for an object, such as a WBS element, an internal order, or a network, the status of that object changes. The status of an object, in turn, influences which business transactions can be carried out for an object.
There are two types of statuses:
The user status and the system status.
A system status is set by the system which tells us that a particular function has been carried out for an object. A user cannot delete, change, or otherwise amend the system status in any way.
A user status is a status which can be set by the user in addition to the current system status. In this workshop, we will skip the user status and focus only on the system status.
Now, the system status of the project is CREATED.
If you want to check this by yourself, press CRTL + F9 from the project structure changing screen and click to Business Transactions. Now we get a list of which business procedures are currently allowed and which are currently disabled.
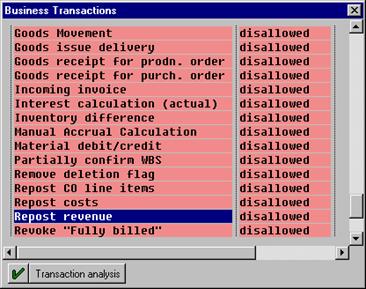
A number of business transactions are currently disallowed. In order to allow for entering actual data (e.g. via Incoming invoices), we must change the user status.
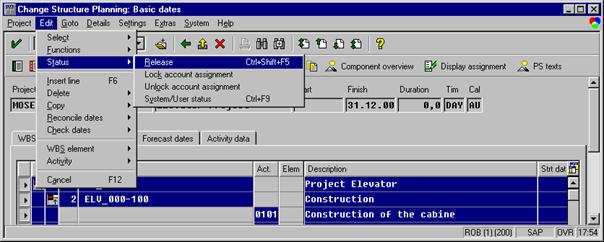
For this purpose, we are going to release the whole project. Select all rows and release the project.
You get the message that the status was changed.
Confirm it.
Now, check if we are currently allowed to report costs. Select the highest WBS Element and then press CRTL + F9
Click to Business Transactions to see what has changed.
Note that now we are no longer allowed to delete WBS-Elements.
Press Enter and leave the status screen by going back.
Before releasing the project we had already selected all activities. Thus we have released the whole project. Note that we would have been able to select only a few activities or WBS elements. Therefore, it is possible that different WBS elements and different activities can have a different status. In fact, in practice this is the case with large-scale projects.
Operative Structures
Get into the screen change structure planning by using Transaction code CJ20 and select WBS basic data.
Check the boxes PE and Acct to to allow for planned costs and for actual costs. Note that is possible and sometimes useful to allow for planned cost on an aggregate level, but not for actual cost.
In top-down planning, we start at the highest level of the work breakdown structure (WBS), and all the subordinate WBS element must fall within the time frame of the particular higher WBS elements. In contrast, in bottom up planning, we start at the subordinate levels and aggregate the plan to the top. Planning without hierarchical dependencies is referred to as open planning. However, several constraints have to be considered. For example, we could specify that the manufacturing process must end before the annual plant shutdown. A powerful tool in project management is planning by network.
As a preliminary step to get a rough idea about the time structure of a project, GANTT Charts are used. This simply means that the duration of each activity is drawn against time. The problem is that functional relationships among sequential activities are not captured formally and changes require a new drawing. In a network there is usually a reason for a specific sequence of activities. For example, there may be technical dependencies between individual activities.
Example of a network. Source: SAP Documentation CD
In order to consider these relationships, several algorithms for planning problems have been developed and are referred to in an umbrella definition as planning by network.
The essential components of a network are:
Activities
Relationships
Activities can be seen as 'components of a process ' with the following characteristics:
They take a certain periods of time
They have a defined start and a defined end
They are processed without interruption
Resources are needed to execute them
They involve costs
Different kinds of network types have emerged in the field of Operations Research. Starting with deterministic durations and structure, networks with stochastic durations (like PERT) and even stochastic structure (like GERT) offer powerful time planning techniques. However, practitioners are sceptical about the results, and large, complicated project structures require tools which are rather easy to handle. Therefore, we will only discuss Metra Potential Method (MPM) which is used in the PS modul as well. MPM method uses deterministic durations and structures. As a consequence, neither probabilties of, e.g., a specific duration of the project can be calculated nor can be captured a project structure which has stochastic elements. This would be the case, e.g., if we wished to model a situation a test could be passed with a certain probability. This would lead to a loop on a MPM structure which is forbidden.
A network does not only graphically display the relationships among various activities, it provides also information on the critical path. The critical path indicates which activities are the most critical to be performed in time to avoid delaying the whole project.[8] Planning by network is based on the Theory of Graphs.
MPM uses nodes to represent activities and arrows for their relationships as this is easier to follow. One must know that SAP supports several types of relationships and not only the standard relationship. The following relationships are supported:
Finish - Start

The preceding activity must finish before the following activity may start.
Start - Start
One activity cannot start until the other one has started.
Finish - Finish
One activity cannot be finished until the other one is finished.
Start - Finish
One activity cannot be finished until the other one has started
For some activities, the earliest possible start and the latest possible start differs. The difference between the earliest possible start and the latest possible start is called slack time. A slack time greater than zero means that the duration of the activity can be longer than planned without delaying the completion date of the whole project. The sequences of activities having a slack time of zero are called the critical path. In this context critical means that, if the duration of one of these activities is longer than expected, the completion date of the whole project is delayed by at least that period of time. One must also realize that there can be several critical paths. Moreover, the critical paths can change during the project as a result of unexpected delays of certain activities.
The change of the critical path due to excessive consumption of the slack time is referred to as Parkinson Phenomena.[10] The slack time for an activity cannot be used without affecting the slack time for other activities. As a rule of thumb, the total slack time can be used only once within a non-critical path without changing the particular path into a critical one. Thus, the MPM (Metra Potential Method) method splits the slack time into four different parts.
The total slack time is calculated as the difference between the earliest possible start and earliest possible end. This is equal to the difference between the latest possible start and the latest possible end.
The free slack time at the end is calculated assuming that all predecessors have begun at the earliest possible date. Thus, the free slack time at the end calculates, provided the assumption holds, the time the activity can be delayed in order to enable the successor of the activity in question to start at the earliest possible date, too.
The free slack time in the beginning is the counterpart of the free slack time at the end. It is calculated as the time at the beginning of a non-critical path if all successors start at the latest possible time and the predecessor has started at the latest possible time, too.
The independent slack time is
calculated by assuming that all successors are going to start at the earliest
possible time and all predecessors have ended at the latest possible time.
Thus, this type of slack time can be used to the full extent without resulting
neither in a reduction of slack times of other activities nor in a delay of the
whole project.
Note that the free slack time at the end and the free slack time at the beginning affect each other. If one part is consumed, the counterpart is not available to its full extent.
In project planning, planning is a continuous dynamic process. Thus, replanning is unavoidable. Moreover, for different situations different sequences of actions are optimal. Hence, planning with revisions is referred to as rolling or revolving planning.[12]
By taking into account the dependencies among activities and their estimated duration, activities that are most likely to become bottlenecks can be identified. Last, but not least, planning by network is useful to evaluate possible effects of deviations from schedule. Originally, only the effect on time could be evaluated. However, in an integrated system like SAP R/3 effects on other areas such as, e.g., production capacities can be simulated in real time.[13],
After having set up a network, make sure that you perform a final check:
Which important activity may have been overlooked?
Are the sequential relationships among activities correct?
Note that time estimates are just that - estimates and, therefore, subject to the problems associated with estimation.
Summary of calculations[16]
|
Calculation |
|
|
Earliest possible start |
Max (earliest possible end) of all predecessors |
|
Earliest possible end |
Earliest possible start + duration (activity) |
|
Latest possible end |
Min (earliest possible start) of all successors |
|
Latest possible start |
Latest possible end - duration (activity) |
|
Total slack time for activity |
Latest possible end- Earliest possible start -Duration |
|
Free slack time at the end |
Min (Earliest possible start(Successor)) of all successors |
|
Free slack time in the beginning |
Latest possible start - Max (Latest possible end (Predecessor)) of all predecessors |
|
Independent slack time |
Min (Earliest possible start (Successor)) - Max (Latest possible end (Predecessor) - duration (activity) |
Forward scheduling
Forward scheduling means to calculate the earliest start of each activity. The result is the earliest possible date of completion and, for each activity, the earliest possible start and the earliest possible end.
Backward scheduling
Backward scheduling means - by starting from a given date in the future - calculating for each activity when it has to be started and finished (latest possible start and latest possible end) in order to keep the date of completion.
Data structure in SAP
The following data must be entered to perform the above mentioned calculations:
Work center in which the activity is to be carried out
Duration of the activity
Resources required to carry out the activity
There are the following categories of activities in the Project System:
Internally processed activities
Externally processed activities
General costs activities
Activities can be broken into activity elements for more detail.
Types of Dates in SAP
SAP offers the following types of dates:
|
Type |
Description |
|
Basic dates |
These are fixed dates which are entered manually in the WBS (work breakdown structure). |
|
Forecast dates |
These are expected dates which can be used to reflect best or worst-case scenarios. They are entered manually in the network and the WBS. |
|
Actual dates |
Reflect the current state of the project. They are either entered manually or copied by the system from the activity confirmations |
|
Scheduled dates |
Are calculated either in the WBS or in the networks. |
When planning top-down by starting with the highest WBS element, all dates in the subordinate WBS elements must fall within the time frame given by the highest WBS element.
By contrast, when planning bottom up, we start with the subordinate WBS elements and the system thereby calculates the dates for the higher EBS elements.
In open planning, dates are planned without hierarchical dependencies.
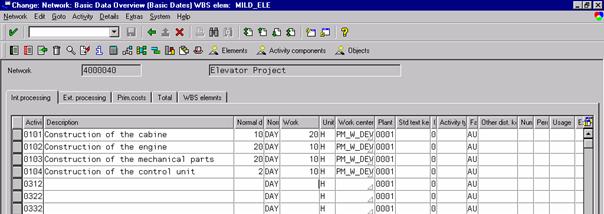
Enter the Project definition and check the box with activities.
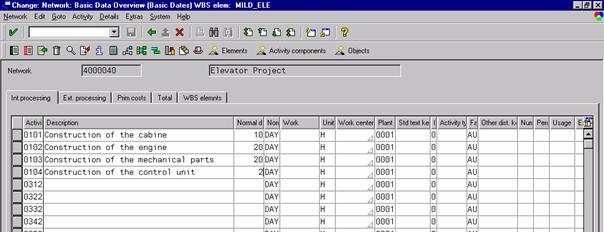
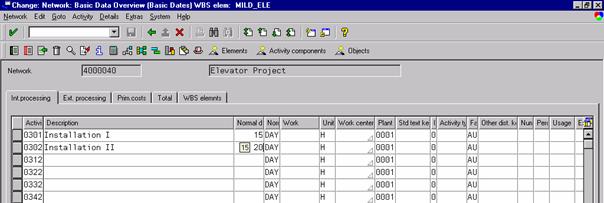
Entering the durations of the activities
Select the first four activities and press Activity data.
Enter the durations.
Click WBS elements to go back
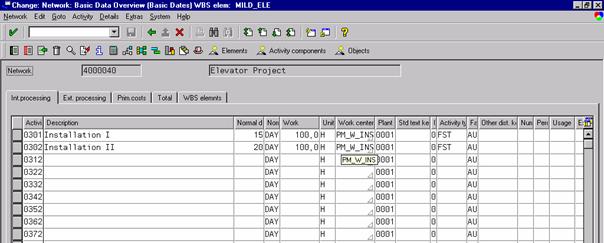
Specify the durations also for the Procurement activities
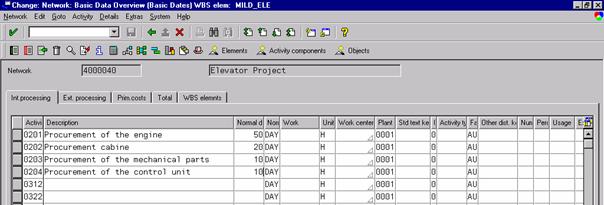
and provide the system with durations also for the installation-activities.
Defining the relationships between activities
Select all activities and press the button for network structure graphic.
Now, information is needed about the structural dependencies between the tasks.
For this purpose, press the connection button (the 11th button from the left hand side in the menu bar). Then move the cursor to the first activity, press the left button and hold it depressed while you move the mouse cursor to the successor. Having done this, release your mouse to draw an arrow representing the relationship.
Deleting relationships between activities
Select a relationship and click the button showing the trash can.
Confirm by pressing Continue, and the relationship is deleted.
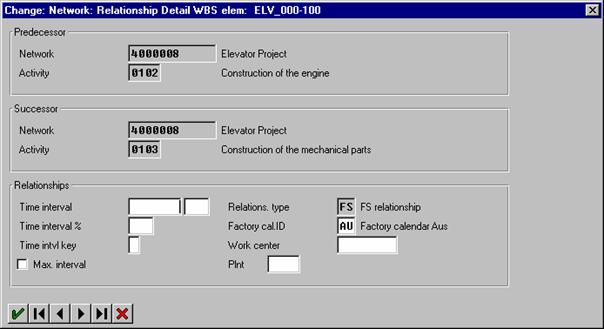
Define additional control data for the relationships
Double-click on the specific relationship.
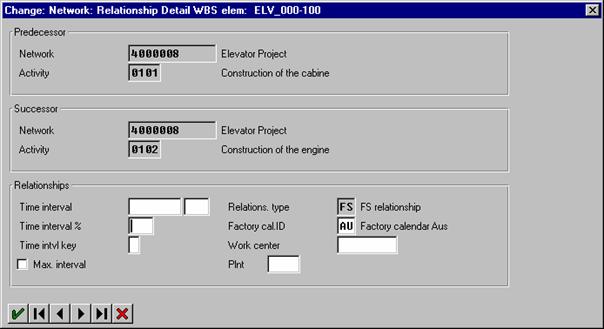
Thus, you can specify a time interval between predecessor and successor.
You can explore all features by focusing an input data field and pressing F1.
Redrawing the network
After you have defined some relations, you may feel that the network looks somewhat chaotic.
In order to solve this problem, you press the Adjust button (it is located left from the Activities button).
Press Continue and the graph looks nice again.
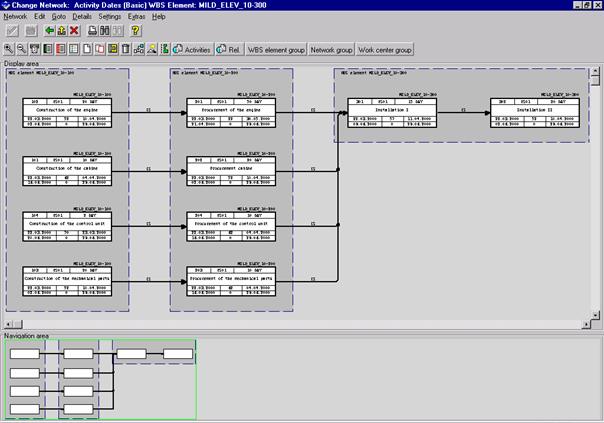
Now, proceed with completing the network.
Zooming in and out
Zooming can be used in order to get a better overview of the network. To this end, use the first two buttons on the left-hand side in the second toolbar. To navigate through big networks, use the navigation area.
After having entered the relationship, adjust the graph once more. Then your network should look like this:
Loop Analysis
If you want to make sure not to have created a cycle by accident, you can perform a loop analysis.
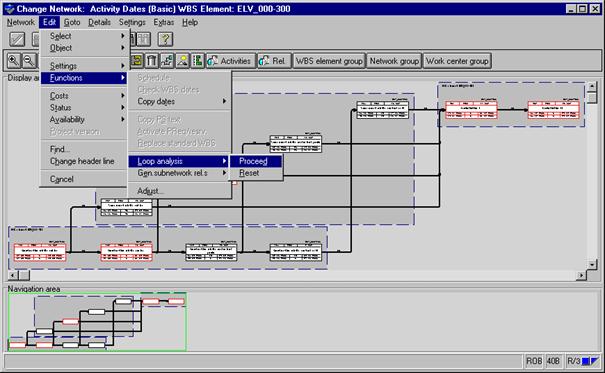
If everything is OK, at the bottom of the screen you get the message No loop exists.
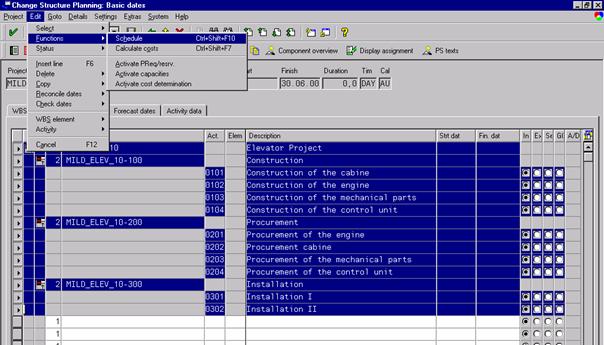
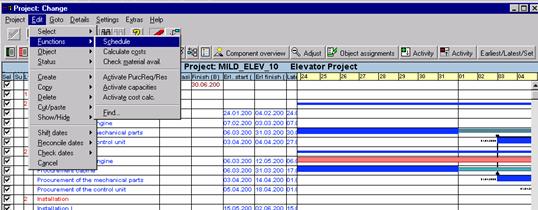
Triggering the scheduling
Select all activities and carry out the scheduling.
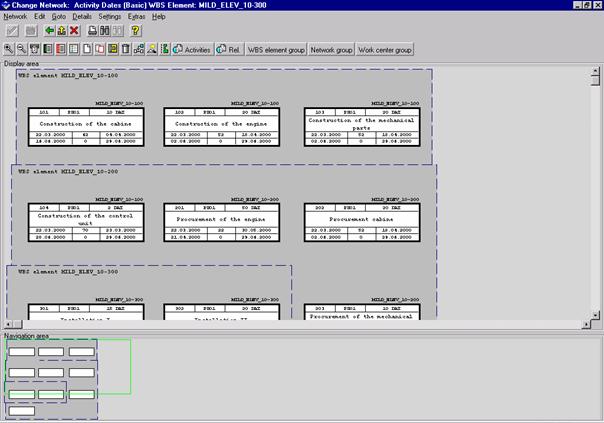
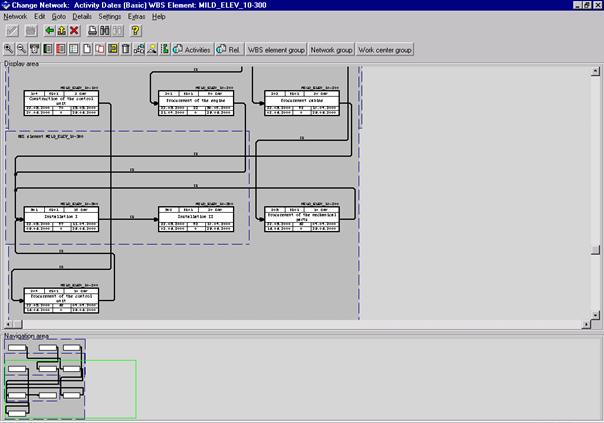
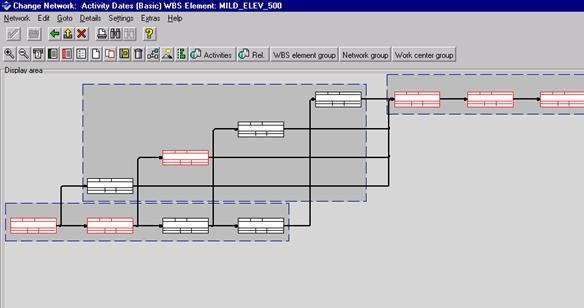
Interpreting the network graphic
Now, lets take a look at what happened. We select all activities, hold down the right mouse button and select the Network Structure Graphic or simply press Shift+F6 after having selected all elements and activities.
Zoom out, if it is necessary to oversee the network.
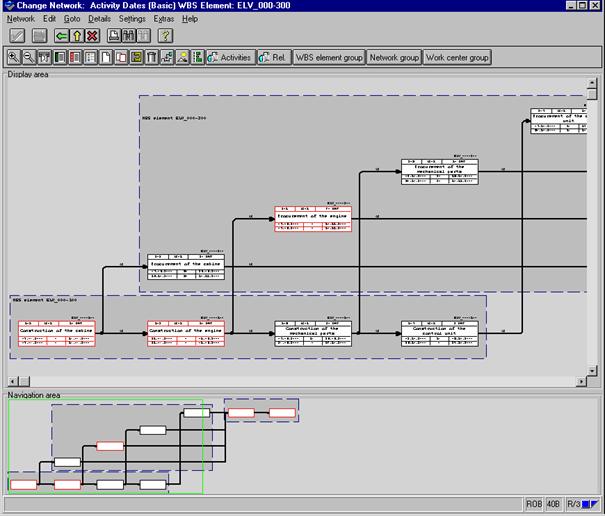
Now, we see that some activities are marked by a red border. This indicates the critical path.
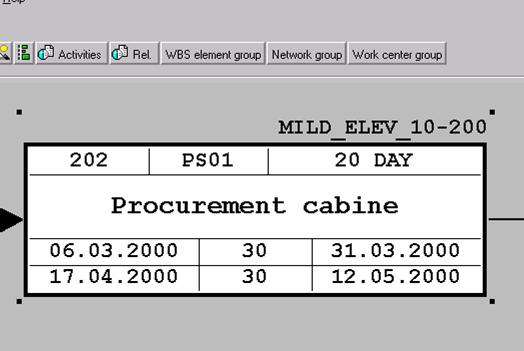
Interpreting of the node
Zoom in to the procurement of the cabine.
|
|
Duration of the activity. (Note that the system uses working days for calculation (depending on the factory calendar) |
Total float (= slack time) |
Earliest finish |

![]()
![]()
![]()
|
Latest start |
Free float |
Latest finish |
Note that if the slack time is consumed, the critical path is bound to change.
Compare this activity with a critical one, the procurement of the engine:
we expect that the slack time will be zero as a critical activity lies along a critical path.


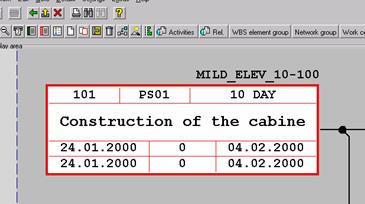
|
As expected, the total slack time is zero, as it is a critical activity. Note the identical date for earliest and latest start and end. |
Here you see that the system calculates in workdays, as the difference between 24.1.2000 and 4.2.2000 is more than 10 days. |
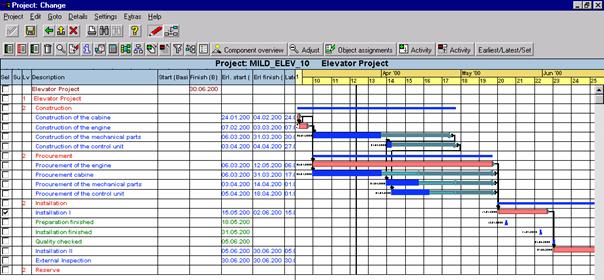
The project planning board provides a graphical overview of the entire project with enhanced functions. Most of the functions can be done via the planning board. In this context we will show some scheduling functions.
Getting to the project planning board
From Structure Planning use the button of Shift-F8 to go to the project planning board.
The direct way from the R/3 main menu is shown below:
Select the project you want to edit.
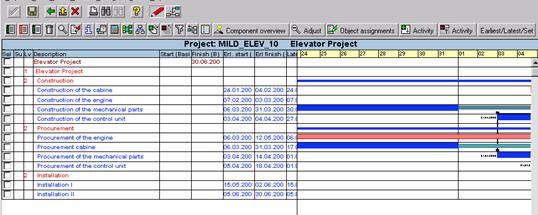
The Screen
![]()
![]()
![]()
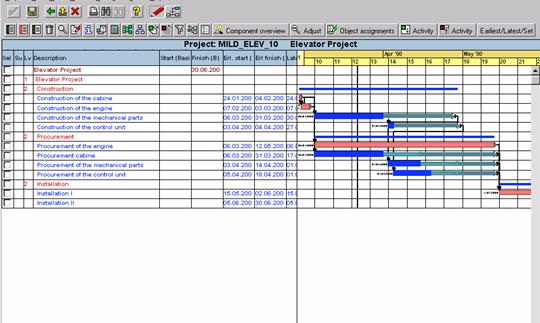
|
List of Activities (blue) and WBS Elements (red) |
Activity Dates |
Gantt chart providing an overview of the activity durations. |
Editing details of activities
Click at the bar representing the activity which you want to edit.
Editing relationships
Click on the relationship you want to enter and you get a dialog box.
For example you can specify a time interval between two consecutive activities. This is useful for waiting times, etc. which consume time but no ressources.
Changing the scale of the GANTT chart
Now, the GANTT chart is displayed in weeks. We want it to be displayed in days, as we are interested in getting a more accurate overview.
Double-click on the scale header.
Select another value for the Scale time axis.
Return to the planning board by pressing Enter twice.
You may have to scroll in order to see the results, if the scheduled starting date is in the future.
Scheduling of activities from the planning board
To schedule from the planning board, select all rows and start the scheduling.
Cost planning deals with the costs which occur in the course of the project. In the various phases of the project, cost planning has different goals. [17]
In the conception and rough planning phase, cost planning is used for calculating the costs which will occur for the project.
In the approval phase, cost planning serves as a basis for budget allocation.
Within the realization phase, cost planning is used for controlling cost deviations.
The cost planning process starts at the lowest level with the cumulation of the costs. Then, the budget is requested. Management approves the budget, and the funds are allocated to the different levels.
Controlling is the process of developing targets and plans, measuring actual performance and comparing it against planned performance and taking corrective action, if necessary.
As far as costs are concerned, the PM module interferes mainly with the following R/3 components:
CO - Controlling
FI - Financial Accounting
PP - Production Planning
MM - Materials Management
Often, in early stages of project planning (or even projects), only rough estimates for the costs of workpackages are available. For this stage, cost can be entered manually without excplicit calculation. We will use only cost calculation with networks, based on prices and quantity structures. Network costing includes automatic calculation of the planned costs from activities, activity elements, and components.
The graphic illustrates how the system determines network planned costs:
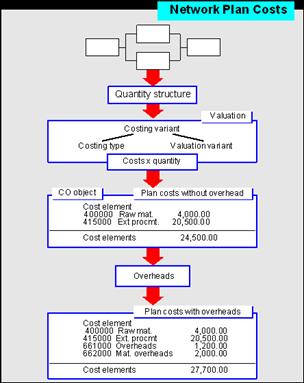
Source: SAP Online Documentation IDES Release 4.0B
The quantity structure is the basis for costing. It contains all network data needed for the calculation.
The system values the quantity structure using a costing variant. The costing variant contains the criteria for costing and comprises a costing type and valuation variants for materials, internal services, and external services. It also includes a costing sheet for the overheads, and an overhead key.
The overhead is calculated automatically as a part of costing. Depending on the network type in question, the planned costs are recorded in the network header or activity.
We are going to assign to activities personnel costs as well as external costs. Then we are planning a cost reserve. Subsequently, the system will calculate the costs.
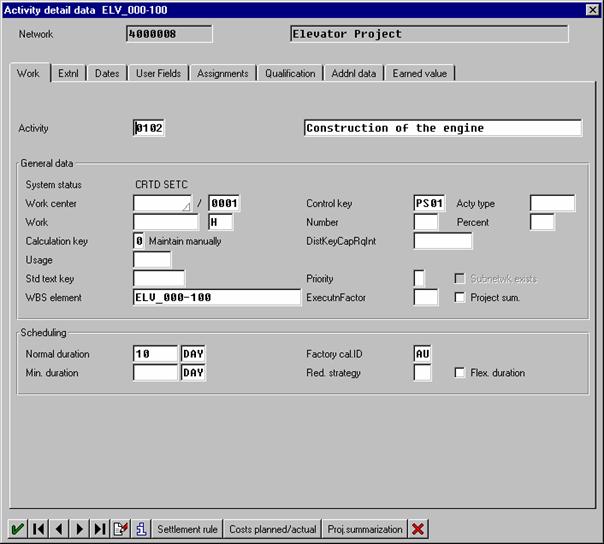
Assigning Personnel Costs to Activities
To calculate the planned cost, the planned work and work center performing this work has to be entered:
Select all specification activities.
Click to activity data
Now, enter Work (hours) and work center. After having pressed Enter, the activity type is set to FST as it is the only maintained activity type for this work center.
Go back and then assign work to the installation activities.
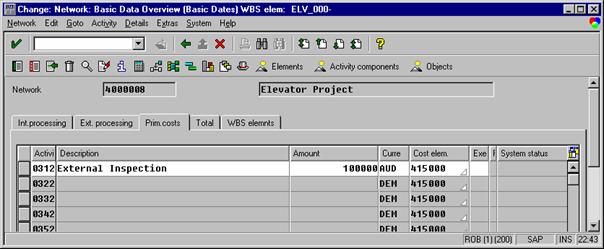
Assigning External Costs to Activities
You use externally-processed activities to plan work to be performed externally.
In our case, for the installation II 100000 ATS are planned for external inspection.
Select the activity installation II and click Activity data and, then, select Prim.costs
Assigning material to Activities
Internally produced components as well as externally procured components can be allocated. It is also possible to allocate material that does not have a material number.
When you allocate material componets to network activities, the system creates requirements either as reservations or purchase requisitions.
If the materials involve long delivery times, you can trigger advance procurement: This results in preliminary requirements being produced in an earlier activity. These preliminary requirements are then used when they are actually required by the activity concerned.
Move to structure planning and check with activities.
Now, we want our system to make our parts available when we need them. The reservations, purchase requirements or planned orders will depend on the dates the system will calculate once we have entered the durations for the activities within our project.
Then, we wish to tell the system that it should assign the following materials to the corresponding procurement activities:
|
Activity |
Material |
|
Engine |
|
|
Cabine |
|
|
Mechanical Parts |
|
|
Control Unit |
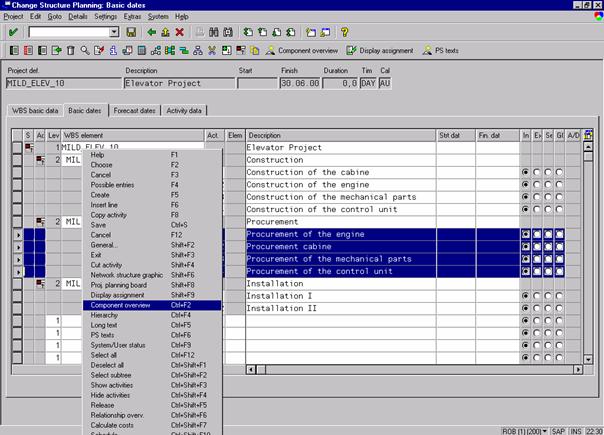
First, we select our procurement activities and, then, we use the quick menu by pressing the right mouse button.
We then search for the engine with matchcodes.

Press Enter
We select the elevator engine and enter 1 for quantity.
Go the next activity by pressing -> and do not click Enter. If you were to press Enter now, you would get back to the WBS Element view. Hence, you would have to select the activities again.
We get an error message, since we have forgotten to specify an item category which is a mandatory input field.
Select for the other activities the corresponding material, too, and enter one for each quantity. Proceed by clicking ->. After having entered the material for the last activity selected, you get the information:
Press Enter to confirm the message.
Then press Enter to return to the structure plan editing screen.
Availability Check
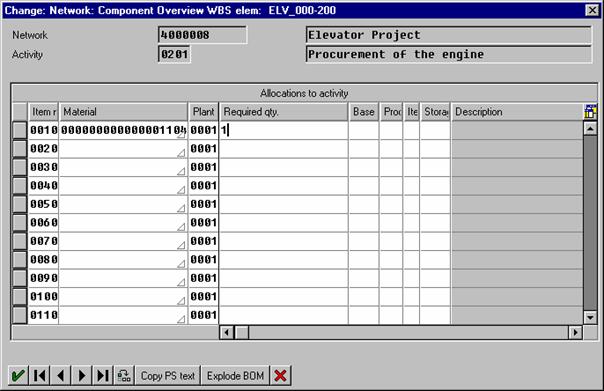
Select the activity procurement of the engine and press component overview.
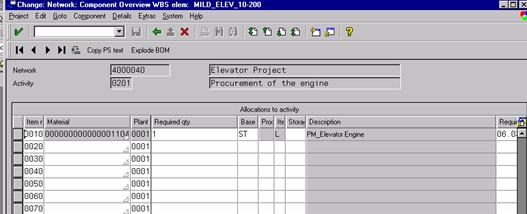
You get a list of all materials assigned to the activity choosen. Mark the material and follow the procedure to get an availability check for it.
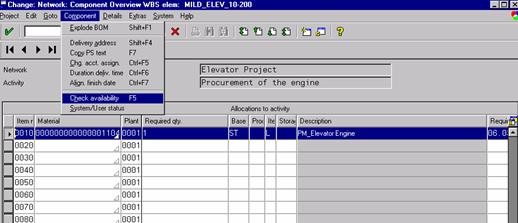
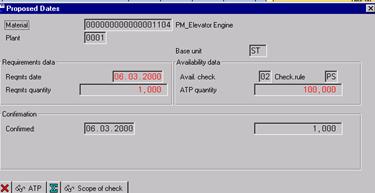
Note the requirement date, it is a result from the above performed scheduling.
Perform an ATP check:
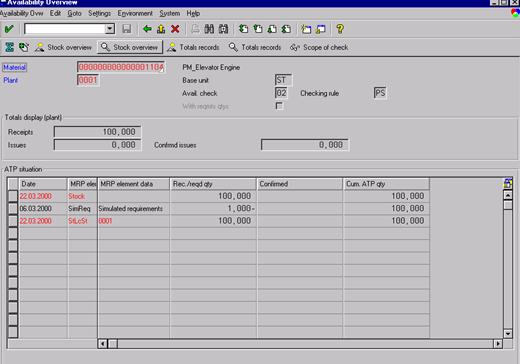
Stock of engines is 100, enough for our requirment.
Checking material reservation
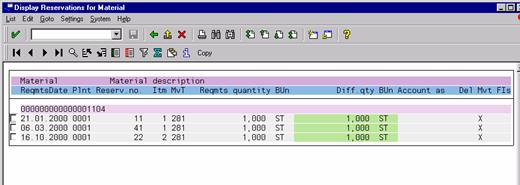
Move to Inventory Management
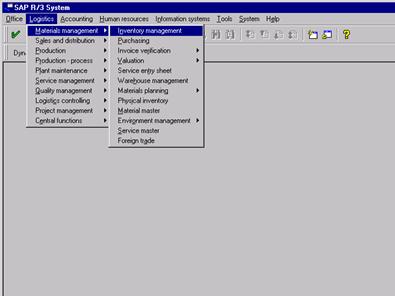
Then, go to Reservation display and search for the elevator engine:
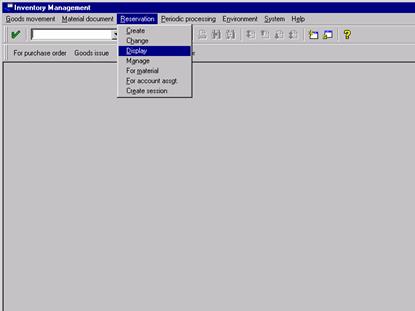
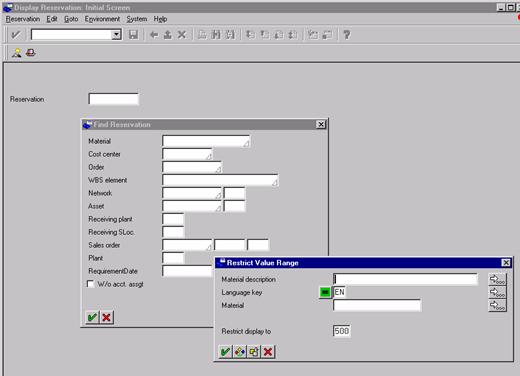
Note the reservation.
Cost Reserve
To plan a cost reserve, we start by appending an abstract PSP Element to the project:
It is important to avoid entering actual costs to the reserve element. Therefore, we change the operative structe.
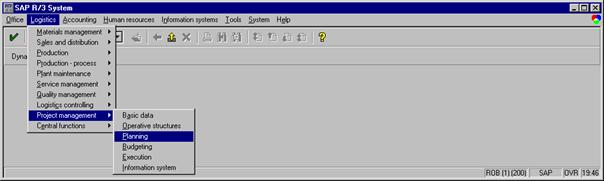
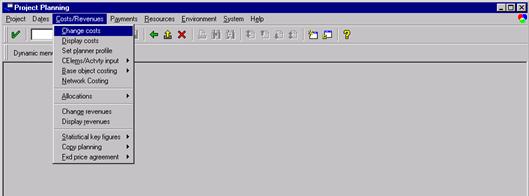
Then, go to Project planning.
Change the costs by assigning 100000 ATS to WBS Element ELV_000_400
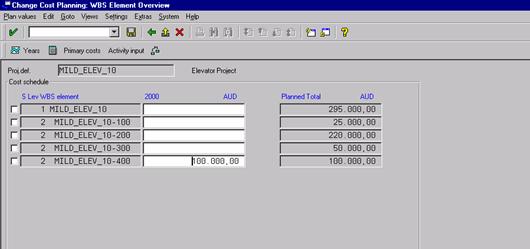
Finally, use Total up to aggregate cost to the higher-level WBS elements.
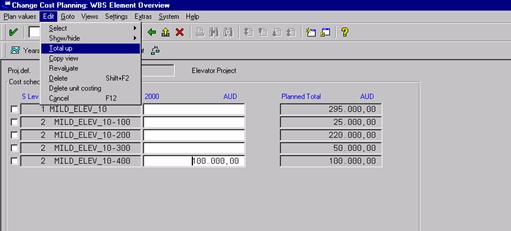
The procedure shown is also used for early planning stages, if only cost estimates without quantity structure are to be entered.
Determining Costs
Select all and trigger the calculations of the costs.
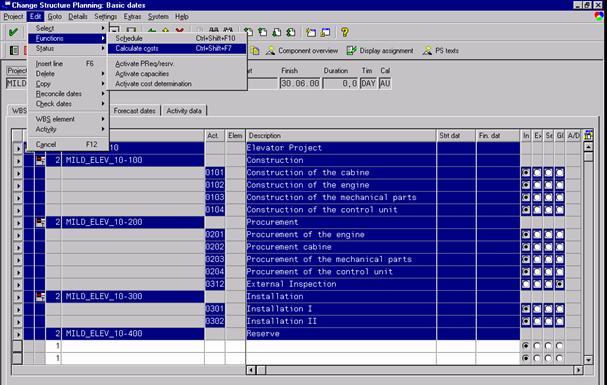
When saving the project SAP R/3 automatically calculates the costs.
If we get the message Data saved, after having pressed the save button, we know, that SAP R/3 had no problems with the calculation. If there are Warnings or Errors you have to look up in the Error log.
If there are neither Errors nor Warnings, the error log is empty.
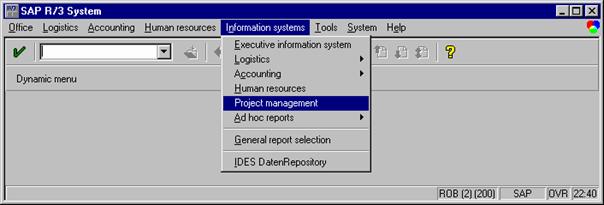
To get a cost report, we will move to the Information System
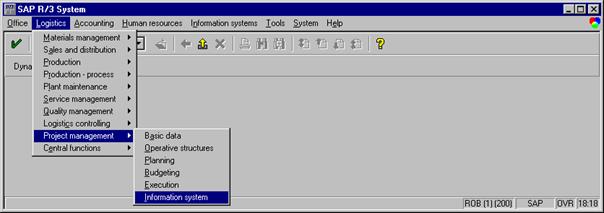
Then, we can choose a cost report
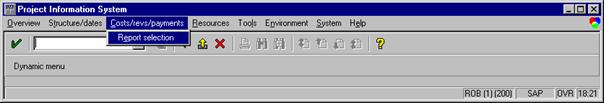
We chose a hierarchical cost report, i.e the report is structured according to the project structure.
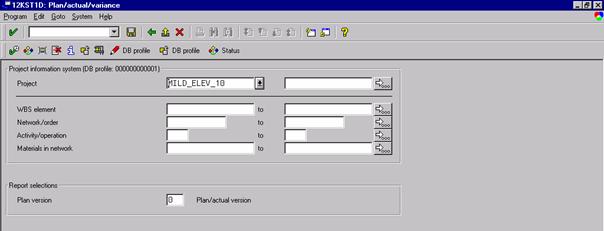
To proceed, press the first button under the Enter button.
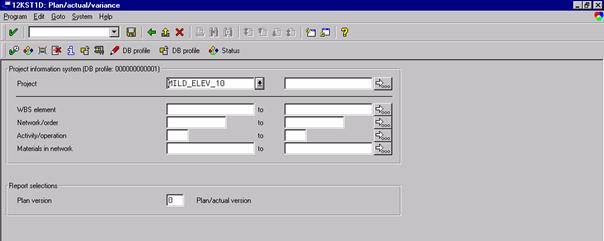
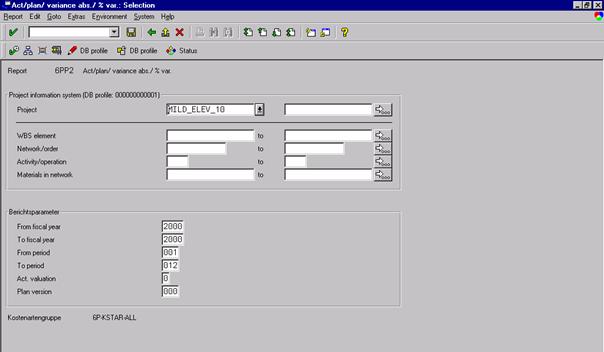
Enter Controlling Area and select a Database profile
Then, we select our project and start the report by pressing the execute button. Note that one can also select one or more WBS elemts, networks or activities. On the other hand, selection of multiple projects is possible.
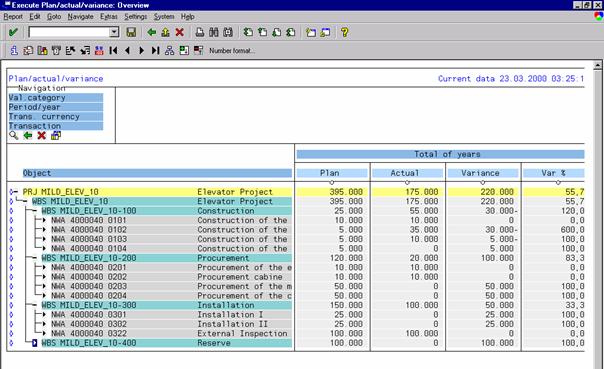
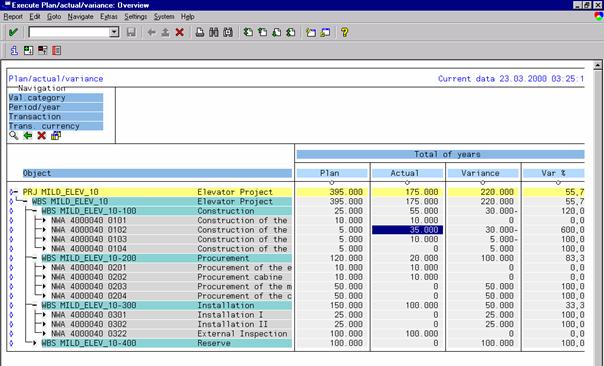
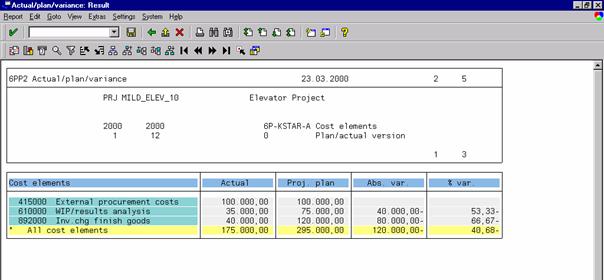
Now, we get the report of the planned costs for our project.
Now, we can check whether the system has calculated correctly.
All specification activities are assigned to workcenter PM_W_DEV. There, we specified that one hour (activity type FST) costs 500. In the activity data we specified that specification of the cabine needs 20 hours whereas for the other activities we specified 10 hours. Thus, the sum is 50 hours in the workcenter PM_W_DEV. 50 times 500 is equal to 25000 which is the same amount as that calculated by the system for WBS_ELV_000-100 specification.
In the material master (Screen Accounting I) it is specified that the control unit and the mechanical parts cost 50000 ATS and the other components 10.000 each. Thus, the system calculated correctly also WBS ELV_000-200 .
All Installation work is done by the workcenter PM_W_INS. There the cost of one working hour is 250 and we assigned 100 hours for each installation phase. In addition, we specified that an external inspection is necessary in activity Installation II, which cost 100000 (primary costs). 100000 + 200 times 250 is equal to 150000.
A resource whose utilization is planned against time is referred to as capacity. Capacity can not be stored. When planning working hours and materials, the fact that resources are limited is not taken into consideration. This might result in a plan which is actually infeasible due to capacity constraints.
The objective of capacity planning is to provide a final schedule by considering the capacity requirements of the facilities and work centers as well as the time structure of the processes. A capacity profile is generated, displaying the utilization in the planning period. Often, capacity supply does not match capacity demand. To tune demand and supply, one has three options[18]: changing capacity, changing capacity requirements and capacity levelling.
Changing capacity
There are several methods to vary the capacity, i.e.:
working overtime
using of reserve capacities
changing intensity through motivation
buying more equipment in the long run
Changing capacity requirements
Orders can be contracted out, additional orders can be acquired, or orders can be released early for production. On the other hand, activities not on the critical path can be delayed.
Capacity Leveling
Capacity leveling encompasses changing priorities of jobs, trying to move jobs to periods where free capacity is available and using other equipment.
Lot splitting refers to the allocation of a job to several different machines in a given department. However, it is a myopic solution to insufficient capacity since it actually leads to a reduction in capacity. Thus, when a workshop is already overloaded, it is a poor strategy.
A further option is operation overlapping.[19] That means that two consecutive work steps are processed in a kind of parallel order. After a certain number of the lot size has been processed, the next work step is already started for that specific part. Last, but not least, if there is the possibility to perform the work in other workshops, alternative routing becomes a viable option.
Almost all capacity planning functions can be performed with the R/3 Graphic Planning Table.
Data Structure in SAP
In order to enable the system to calculate capacity requirement we have to enter:
how much work must be done to carry out the activity.
which capacities (for example, labor or machines) will perform the work.
which qualifications are necessary to perform the activity
which individual capacities or people are necessary to perform the activity
In our case, all necessary data was allready entered for cost planning.
The planning objects are as follows:
Work, either machinery or persons
Outsourced activities are handled in the purchasing module.
Material is assigned to activities. Thus, the project module interacts with the material-planning module for reservation or purchasing the material.
Tools, CAD files and documents can be administrated with SAP.
Since we have entered the necessary data to calculate capacity requirements, we can generate capacity reports.
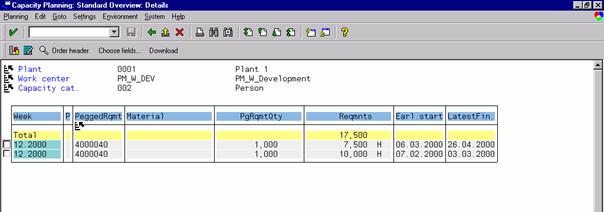
Capacity Overview
To get an overview of a whole projects capacity requirements, one can use the following overview (starting from Structure Planning). Select all elements and go to Capacity Requirements Planning.
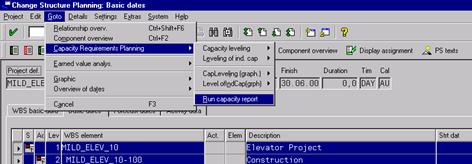
You can see when how much capacity is used and how much capacity is utilized as well as how much is available. Note again that the capacity utilisation strongly depends on the above performed scheduling.
You can navigate through the report by clicking on rows.
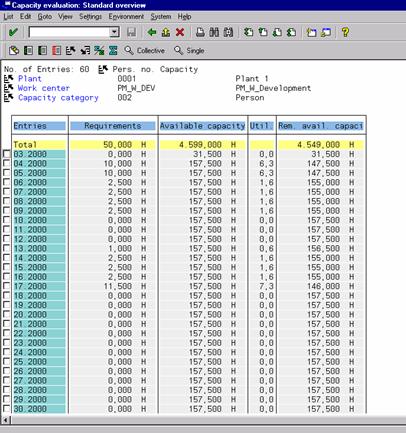
Generating a capacity report for a workplace
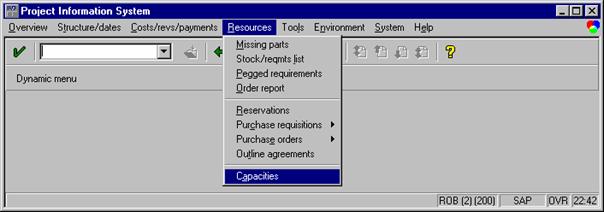
Go to the project management information system.
Select capacities.
Select the workcenter PM_W_DEV
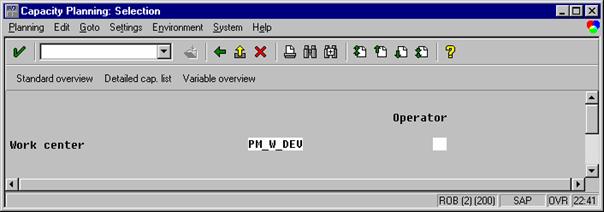
Select Enter to generate the capacity report for this workcenter.
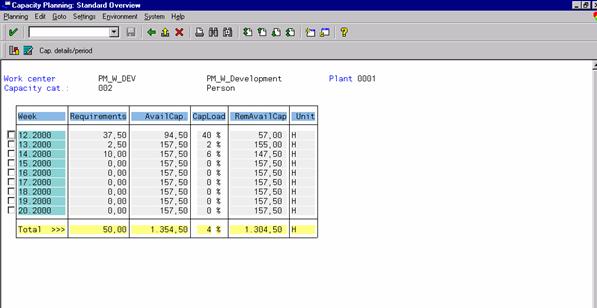
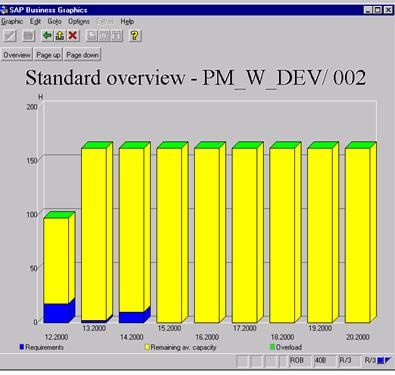
Press Shift+F2 to view a graphical version of capacity requirement:
To go into detail, check the first period and press Cap. Details/period.
SettingàGeneral allows you to change the evaluated periods.
Successful project control requires more than just an isolated accounting of costs, resources, or schedules. Meaningful conclusions about the progress of a project must compare costs which are in fact comparable. Since deviations between planned and actual costs can have various reasons, the earned-value analysis (EVA) tries to use an appropriate basis for project controlling.
The earned-value analysis is an important method for evaluating project progress. For proper measurement, performance, time and costs must be compared simultanously. This is very important, because a simple cost comparison can lead to false decisions. Actual costs might be very low in comparison to those planned. However, this does not necessarily imply good progress of the project as actual performance may be well behind the planned one.
Before proceeding to the deviation analysis, some keywords should be explained:
Actual Percent of Completion (POC)
Planned Percent of Completion (POC)
Planned Earned Value
Actual Earned Value
Actual and planned POC measure projects performance. The assignment of completion values depends on the measurement technique. To calculate the planned earned value, POC is multiplied with planned cost. Actual earned value is calculated by multiplying planned cost with actual POC.
The first step when controlling a project is, therefore, to find a measure for progress. The PS module offers the following measurement techniques:[21]
Start - finish rule
This is generally known as 0/100 or 50/50 Technique.
Here, SAP provides the following measurement methods:
Method 0-100 with an initial Percentage of Completion of 0%
Method 20-80 with an initial Percentage of Completion of 20%
Method 20-80, for example, assigns a planned completion value of 20% when an activity planned date is reached and assign the remaining 80% at finish date. An actual completion value of 20% is assigned after the activity has started, the 80% are added after finishing the activity.
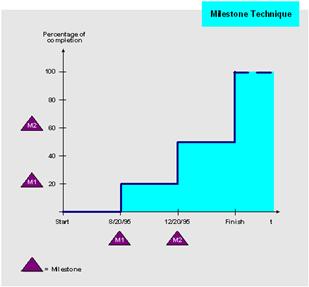
Milestone technique
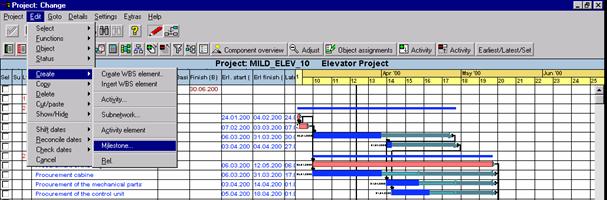
To use the milestone technique, we have to define milestones to the corresponding activities. In contrast to other project management tools, a milestone is not just an activity with duration 0 but a different object. Milestones can be used for several purposes; we will use them only for EVA. To create a milestone related to an activity, follow the procedure below. First, move to the project planning board and mark the activity for which you want to create a milestone.
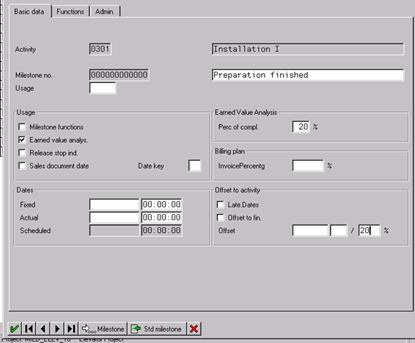
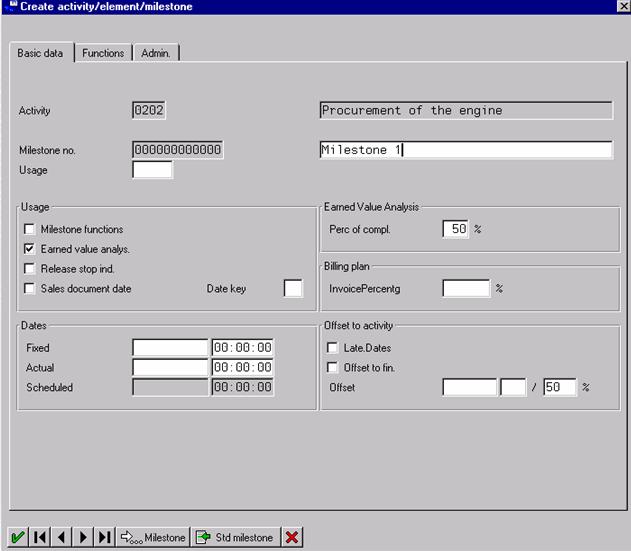
Check the box in the usage section to define the milestone as relevant for EVA. Then, we have to define the percentage of completion and the time position related to the activity. Press Enter to insert the Milestone.
Create two more milestones.
You see the milestone displayed in green.
This information is now used for EVA. Since we defined an offset percentage, the system can calculate a planned date for the milestone to be finished. When this date is reached, the system sets the planned percent of completion (POC) to the value defined with the milestone . Note that this value can differ from the offset percentage. The actual percentage of completion is set to this value, when the milestone is confirmed during realization.
Source: SAP Documentation CD
Estimates
Enter an estimate for the actual percentage of completion in the work breakdown structure or network. In addition, a measurement method for estimates and a maximum percentage of completion can be specified in the Customizing for the Project System.
The maximum percentage of completion prevents an overestimate of completion which occurs when tasks are 'almost finished', also called the '90% syndrome'. As long as the task has not been completed, that is, no actual finish date has been entered, the system will not allow you to have an actual percentage of completion which is higher than the maximum percentage of completion.
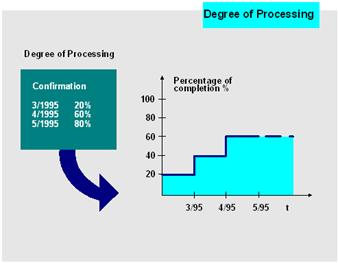
Degree of processing
When this measurement technique is used, the degree of processing from the confirmation becomes the percentage of completion.
Source: SAP Online Documentation IDES Release 4.0B
Time proportionality (level of effort)
Assuming linear progress of the percentage of completion of an activity over time the system determines the percentage of completion in proportion to the time required. This kind of measurement technique is useful for activities such as controlling, quality assurance and the like.
Secondary proportionality (apportioned effort)
This means that the degree of completion of a WBS element depends on the progress of another WBS element or another activity. Possible applications are the approval of drawings.
When planned and actual POC are available, the calculation of planned and actual earned value is straightforward.
To calculate the planned earned value, POC is multiplied with planned costs. Thus, this value represents the planned costs for a status of the project as if it where completed in time.
Actual earned value is calculated by multiplying planned costs with actual POC. Thus, this value represents the planned costs which were planned for the status of the project right now.
A third figure in this context are actual costs which of cours- represent actual costs for the project right now.
Now, we can go to the analysis of variances.Two possible variances are of special interest:
What is the difference between planned project progress and actual project progress: this is captured in terms of money with schedule variance. Schedule variance is defined a the difference between actual earned value and planned earned value.
Given the actual progress of the project, how is the project status in terms of costs: this is what usage variance measures. Usage variance is defined as the difference between actual earned value and actual costs, comparing what has been done so far to actual costs.
The analysis described above is usually done on work package level. However, project managers, especially if they are in charge of a many of projects simultanously, are interested in a measure for the progressa of an entire project. To perform this kind of analysis, these figures must be aggregated to the top. Three possible categories for aggregation are possible:
Planned cost
Budget
Manually entered weight
Imagine the following simple project consisting of two work packages, 1 and 2. The first one has a percentage of completion of 40%, the second on of 20%. What is the percentage of completion of the whole project?
Certainly, this depends on the aggregation measurement.
Look at these figures:
|
WP 1 |
WP 2 |
|
|
Planned cost |
1.5 mio |
2 mio. |
|
Budget |
1 mio |
2 mio |
|
Weight |
If planned costs are the aggregation factor, the total percentage of completion is
![]()
Budget based aggregation leads to a value of 26,7 % and the manually adjusted weights to 33,3 %.
Starting from editing the project in the structure planning screen, select all activities.
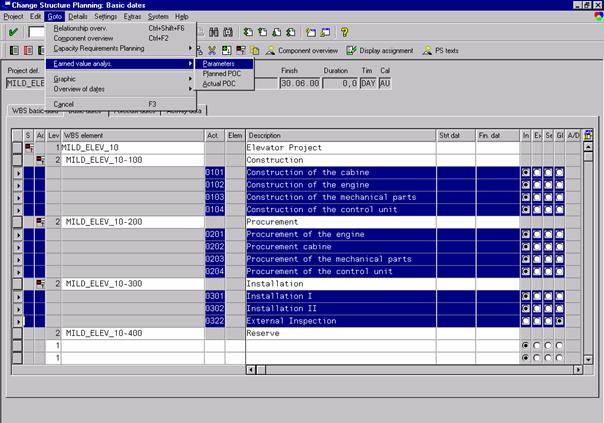
Select the proper measurement techniques according to the case description.
Press Enter and proceed by pressing -> to the next activity.
In the execution phase, actual date is entered. During the project, deviations between planned and actual values are bound to arise. Therefore, it is important to enter the new information into the system and use it as the basis for subsequent planning work, value analysis and reports.
Actual data can be:
Confirmation, documenting the state of network activities
Invoices
Material consumption
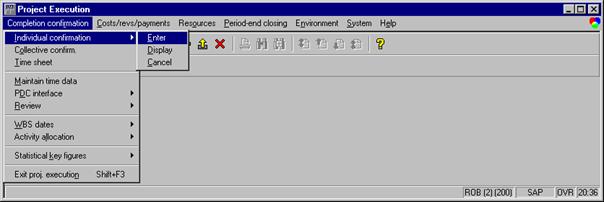
To confirm the first activity, specification of the cabine, select the corresponding network for our project by match-code search.
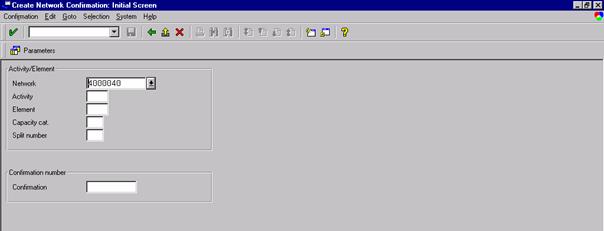
Press Enter. Then select the activity you want to confirm.
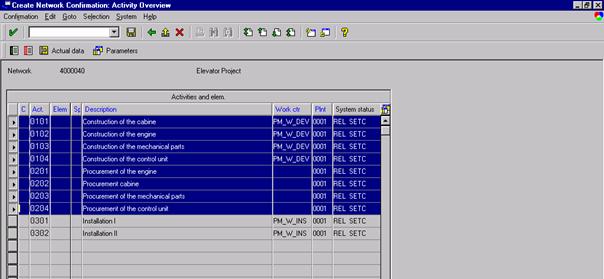
Click Actual Data.
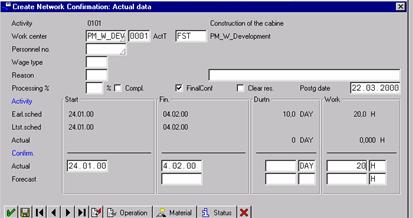
The specification of the cabine is finished, therefore we check FinalConf.
The activity started as planned and was finished in time. 20 working hours werde needen.
To enter another confirmation, use the arrow.
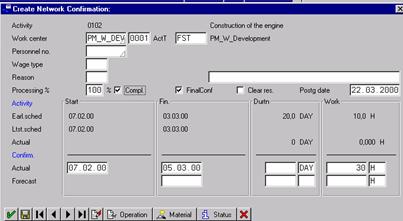
The specification of the engine started in due time but ended on 5.3.2000. 30 working hours werde needed.
Confirm all activities according to realization data.
Incoming invoices are posted in the general ledger. This is done in the Financial Accounting module.
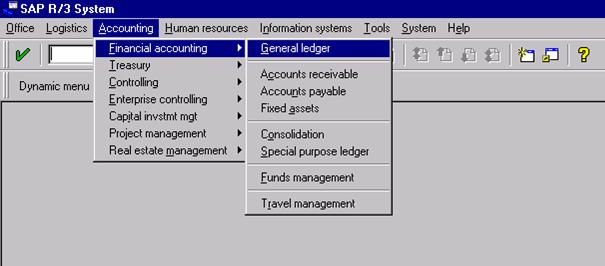
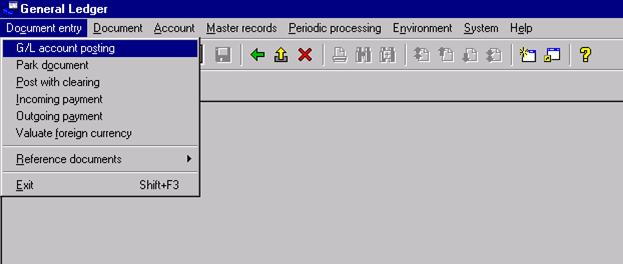
First, we have to enter the date, company code and currency. Then, the debit entry account has to be chosen. To enter a debit entry, we chose 40 and account number 415000 (external procurement cost).
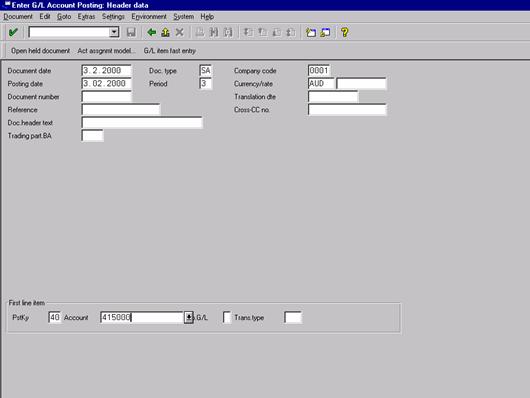
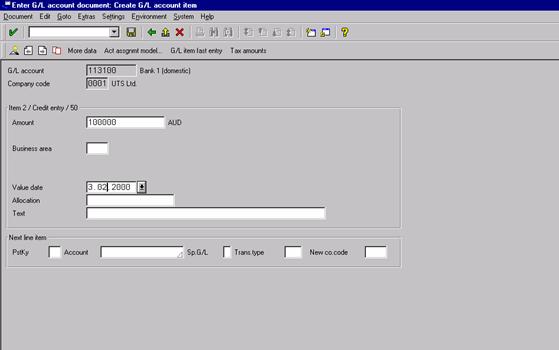
Secondly, we have to enter the amount and a tax code. Invoices can be posted to a cost center, an order, a WBS element or as in our case directly to a network. Therefore, we enter a network element according to our project structure. Furthermore, we have to enter the credit account. We intend to pay this invoice via our bank account (131000).
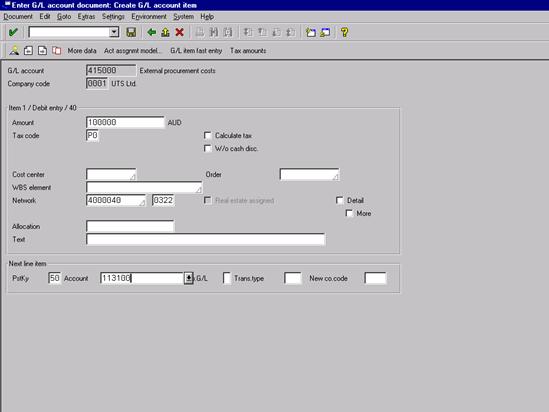
Again, we have to enter the amount.
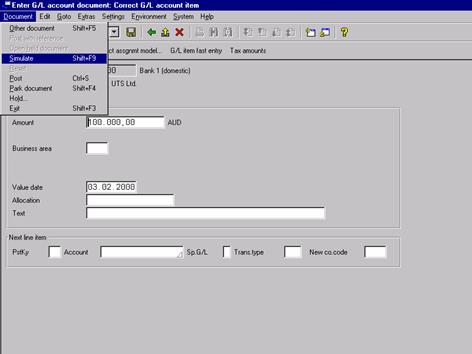
To avoid making a consistency error, we can simulate the posting.
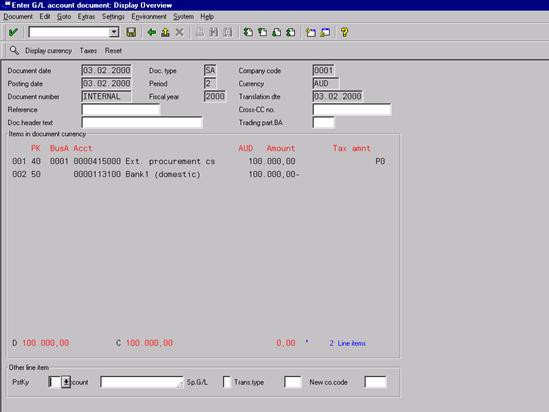
After pressing the save button, the following message should appear:
![]()
Costs from material movement are posted, when the material is taken from stock.
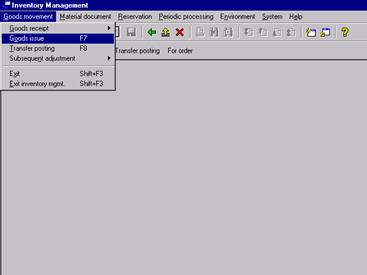
Before the material can be taken, the date for posting and the movement type must be specified. Since we take the material for a network activity, we specify movement type 281 (consumption for network from warehouse). Clearly, also plant and location must be entered.
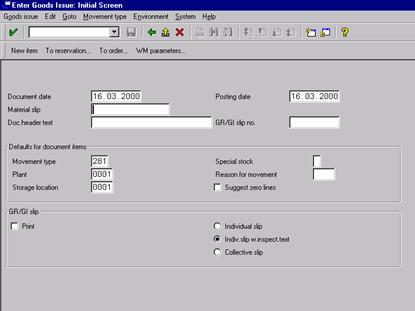
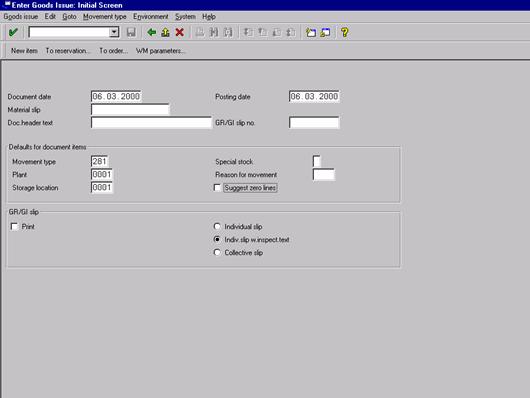
Now, we can specify the network and the materials and quantities which we want to post to the network elements.
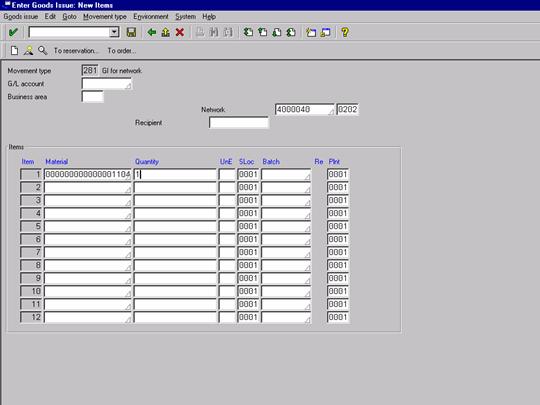
Pressing the save button should be followed by the message:
![]()
Proceed with issuing the rest of materials.
The Project Information System is useful for monitoring and controlling the project. You can navigate in the System and thereby make use of its integration.
You can use standard reports or you can create your own reports with the Report Writer. Here, we will make use of standard reports only . Standard reports offer different degrees of detail, summarizes, and views of current data, version data, and archive data for:
Costs/revenues
Budget
Payments
Dates/structures
Resources
Earned value
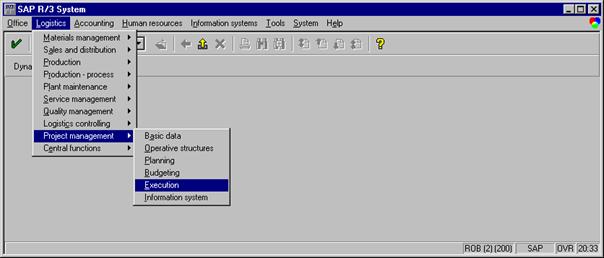
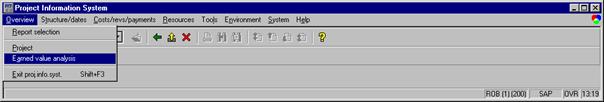
From the R/3 main menu you can reach the project information system as follows:
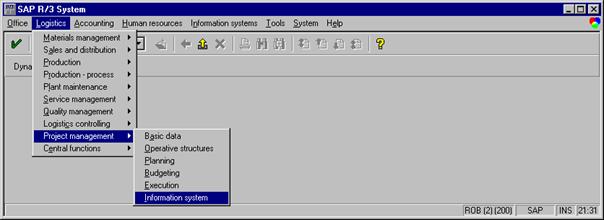
If you want to save time, you can use the transaction code PS01.
In the following, we will have a look as an example - at cost reports and earned value analysis.
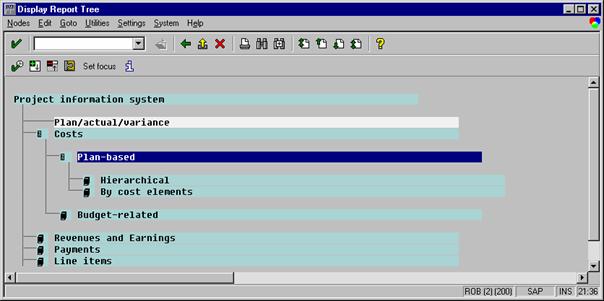
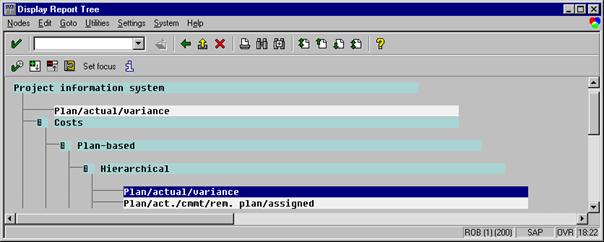
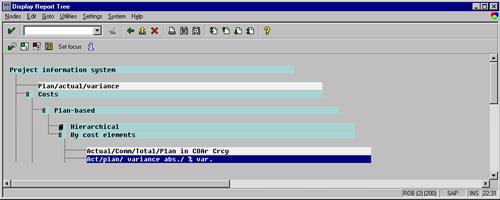
Hierarchical cost report
There are two categories. Hierarchical means that the report follows the project structure. By cost elements means that the report is structured according to cost categories.
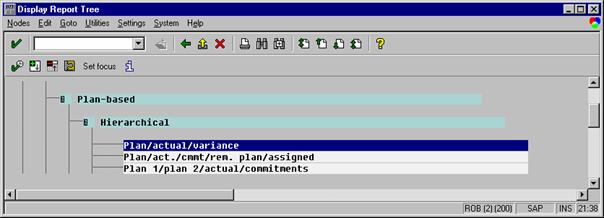
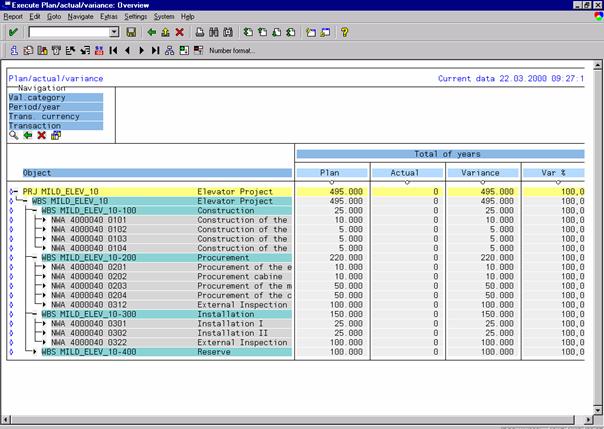
Select ,e.g., Plan/actual/variance to compare planned to actual costs.
Select our project and trigger report generation by pressing the button below the Enter button.
Thus, when getting the report, expand the structure..
Drilling down
Select a value of which you want to know how it has been calculated.
Press F5 to trigger the drill-down function.
Select Period/year
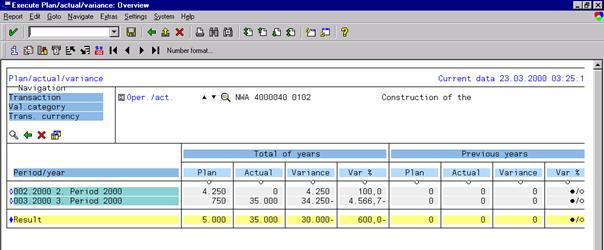
If you want, you can drill down further.
Exit the report by pressing the exit button and close the branch hierarchical reports.
Report by cost elements
Select the report by cost elements.
Trigger the report generation by clicking execute. Select our project and execute the report.
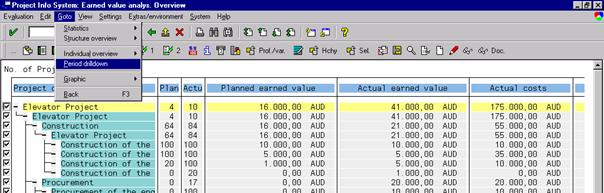
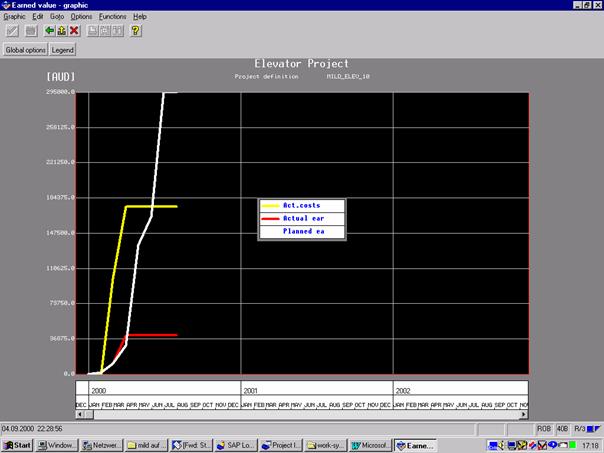
From the info system main screen (If you are currently not there, you get there with transaction code PS01.
Select the project and press the execute button.
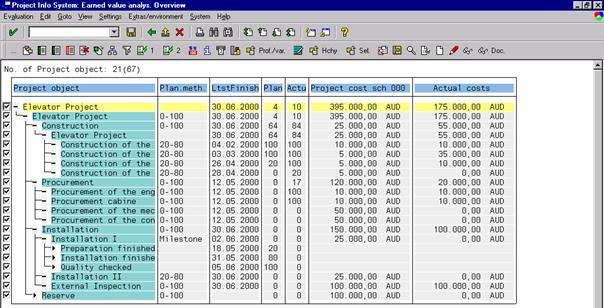
Note the method for measuring the performance of the project. Further, thelatest finishing dates can be seen. On an aggregate level, actual performance is above planned one. However, this is not very useful for effective Earned value analyis. We therefore change the view:
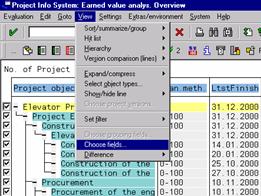
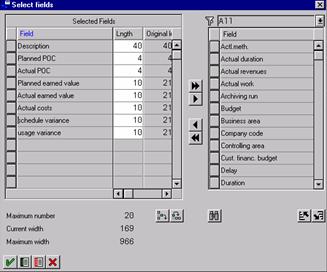
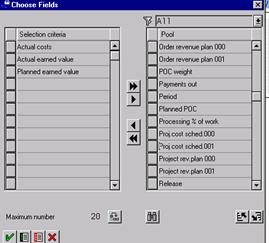
Now, we can select the fields in which we are interested in. For proper view, you can adjust the size of the colums.
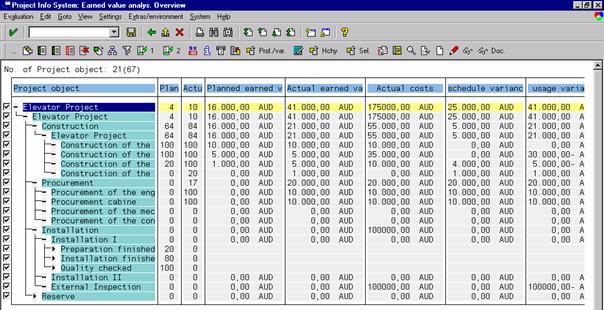
Lets have a look at the specification WBS-element.
We see a planned
POC of 64% and an actual POC of 48%. As aggregation is based at planned cost,
this is calculated by ![]() .
.
Specification has planned cost of 25000. Multiplied by a planned POC of 64%, this results in a planned earned value of 16000. Actual earned value as calculated by 25000 (planned cost) multiplied with an actual POC of 48% is 21000. Thus, this results in a schedule variance of 5000.
Look at the activity 'Specification of the mechanical parts. Actual earned value is 5000. Comparing the actual earned value to actual costs yields a usage variance of 5000.
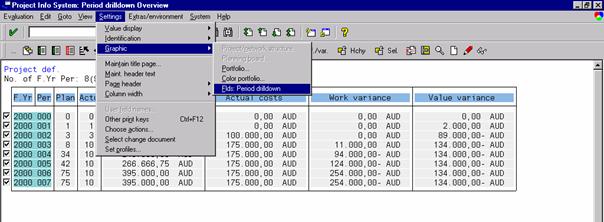
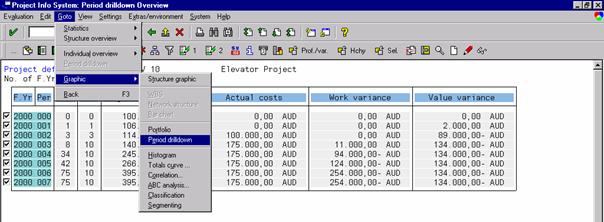
Periodic Evaluation
Change to a periodical view
and display the result graphically after choosing the appropriate fields.
Exporting Data
The SAP system has an interface to export data.
SAP R/3 provides a possibility to exchange data with other Software tools e.g. Microsoft Project. It can be useful for you to export data from the Project System to PC programs for project management, especially if you want to decentralize how you present, process and specify your data.
Microsoft Project and Microsort Excel are easy to handle and used for many small projects. Thus, for providing aggregate figures to the management it is important to load the information into the system.
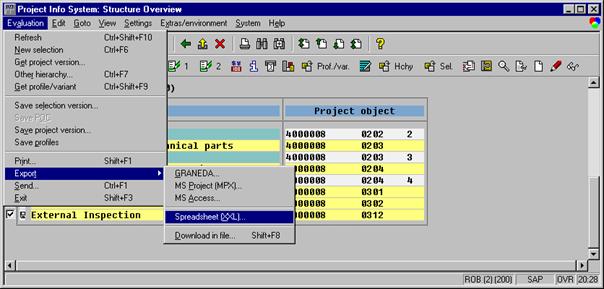
Select the appropriate option
When you click Enter, Excel ist startend, and the report is being displayed
AFOS (Hrsg.) SAP Arbeit, Management. Braunschweig/Wiesbaden 1996
BAMBERG/COENENBERG.:Betriebswirtschaftliche Entscheidungslehre. 6.Auflage, Mnchen 1974
BLACKSTONE, John.: Capacity Management, Cincinnatti, Ohio, 1989
BLOHM, Hans u.a.: Produktionswirtschaft, Berlin 1987
CHASE R./AQUILANO N./JACOBS R.: Production and Operations Management: Manufacturing and Services, Eight Edition
DILWORTH James.: Operations Management, Design, Planning, and Control for Manufacturing and Services, New York 1976
DRAGER, Erich.: Projectmanagement mit SAP R/3
HIGGINS, James.: The Management Challange, New York 1991
HILLIER F./LIEBERMANN G.: Introduction to Operations Research, Sixth Edition, Singapore 1995
LAUX, Helmut.: Entscheidungstheorie II, Erweiterung und Vertiefung. Berlin/Heidelberg/New York 1982
LAUX, Helmut.: Entscheidungstheorie, Grundlagen. Berlin/Heidelberg/New York 1982
PETERS T./WATERMAN R.: In search of excellence, New York 1982
SAP AG. R/3 System Project System - Functions in Detail PS, InformationFolder
SCHIERENBECK, Henner.: Einfhrung in die Allgemeine Betriebswirtschaftslehre. 14. Auflage, Mnchen/Wien 1999
SEICHT, Gerhard.: Moderne Kosten- und Leistungsartenrechnung. 9. Auflage, Wien 1997
WHE, Gnter.: Einfhrung in die Allgemeine Betriebswirtschaftslehre. 19. Auflage, Mnchen 1996
ZAPFELT, Gnther.: Grundzge des Produktions und Logistikmanagement
SAP Online Documentation IDES Release 4.0B
SAP Online Help
Chase R./Aquilano N./Jacobs R. Production and Operations Management: Manufacturing and Services, p.48
Chase R./Aquilano N./Jacobs R. Production and Operations Management: Manufacturing and Services, p.48
Chase R./Aquilano N./Jacobs R. Production and Operations Management: Manufacturing and Services p. 69
|
Politica de confidentialitate | Termeni si conditii de utilizare |

Vizualizari: 1886
Importanta: ![]()
Termeni si conditii de utilizare | Contact
© SCRIGROUP 2026 . All rights reserved


