| CATEGORII DOCUMENTE |
| Asp | Autocad | C | Dot net | Excel | Fox pro | Html | Java |
| Linux | Mathcad | Photoshop | Php | Sql | Visual studio | Windows | Xml |
Drawings in Manifold are similar to drawings in a CAD system used to create blueprints. They are made up of points, lines or areas and are often referred to as vector drawings in other mapping programs or CAD systems.
Existing drawings may be imported into a Manifold project using the File - Import - Drawing command. New drawings may be created in Manifold and then exported into common drawing file formats using File - Export. See the Import and Export topic for more information on specific import dialogs used to import drawings from various GIS formats.
Creating a New Drawing
1. Open a project or create a new project with File - New.
2. Choose File - Create - Drawing to create a new drawing.
The File - Create - Drawing dialog takes the projection parameters for the new drawing from whatever window is active at the time the new drawing is created. If the project pane is active, the drawing will be created using the system default projection of Orthographic centered at the 0 world latitude/longitude origin. If a map window or other drawing window is active when the new drawing is created, the new drawing will be created using whatever projection is used by that active window. This context-sensitive setting of default projection parameters makes it much easier to create new drawings using projection parameters that are hassle-free by default.
Every drawing has a table associated with that drawing. Creating a drawing will automatically create the table for it.
Drawing Fundamentals
Drawings are fundamentally different from images in several ways:
Drawings are made up of objects drawn using points, lines and areas that are defined by specific coordinates. In contrast, images have no objects, only a sea of pixels. The 'objects' we see in an image appear to be there because our eyes and brains automatically match up pixels of similar colors to interpret that part of the image as being an object.
The appearance of objects in a drawing is determined by the format of each object and not by the zoom level. A point in a drawing that is formatted to appear as a small circular dot will have the same size and appearance regardless of zoom level. Areas that are formatted so that they appear with a contrasting color on their border will have the same thickness of border line no matter how far one zooms in. Changes in zoom will simply show more or less of the object. In contrast, the appearance of images varies dramatically as one zooms in past the point where individual pixels become visible.
Drawings use a coordinate system that specifies the precise geometric relationship between different parts of different objects. Drawings intended for use as geographic maps will use a geographic coordinate system so they automatically may be located on the surface of the Earth. In contrast, images have no intrinsic coordinate system except that which is implied by the row and column arrangement of pixels. Images that might be imported into Manifold are rarely bound to geographic coordinates and thus will usually require a quick georegistration before they can be used in geographic maps in a sensible way.
Because drawings have distinct objects, a drawing can be linked with database information by attaching database records to objects in the drawing. In contrast, because there are no objects in images, databases cannot be attached to images. The only data in images are the color values of the pixels.
Every drawing has a table associated with that drawing. Each row in the table corresponds to an object in the drawing. A drawing with three points in it will have three rows in its table, for example. The table will have at least one field, an object ID field, that is used to link each row in the table to an object in the drawing.
Points, Lines and Areas
Drawings are created from only three types of objects:
Points
Lines
Areas
No matter how detailed or cleverly formatted a drawing may be, it is ultimately made up of only these three types of objects. Drawings do not have to contain all three types of objects. Many drawings contain only points, only lines or only areas.
Points are simply dots at a particular location. Points are formatted by default as small, round dots. Points can be shown as anything from a single pixel to a multicolored icon. In the illustration above, the three points to the left are shown as single pixels whereas the four points to the right are dots formatted with bright green background color.
Lines may appear to be straight lines or smooth curves. However, all lines are ultimately made up of straight-line segments drawn between the sequence of coordinates that define the line. Zooming far into even the most smoothly curved line will show that it is made up of straight-line segments. Some CAD and GIS systems call such lines 'polylines.' In Manifold, we simply say 'lines.'
Areas are like shapes cut out of cardboard. They are objects that actually have some 'substance' in their inner region and are often used to show regions such as states or provinces in a map. The illustrations above show a few western states drawn using areas. At left we see the areas drawn in their normal position, and at right drawn separate from each other. The illustration at right has had 'shadows' added in a simple way to provide a greater impression of substance, to promote the analogy with shapes cut out of cardboard.
Historical Note: Areas were called 'polygons' and lines were called 'arcs' in some older GIS systems. This terminology may still be used in some organizations that are still using legacy systems. See the Terminology in GIS essay for notes on the difference between older words and modern usage.
Don't Confuse Lines with Areas
Areas are a new concept to users of simple drawing packages. Many graphics arts packages that allow the creation of vector drawings allow use of lines and points, but not areas. Other graphics packages, such as the drawing toolbar in Microsoft Word, uses 'shapes' in a manner that is part way between line drawings and the use of areas in more sophisticated packages.
An important difference between areas and lines is that areas have inner substance, like a cardboard cutout, whereas even when lines are drawn in a way that makes a closed figure there is no 'substance' inside the white space of the figure. A closed figure drawn using lines is like a figure made up of wire twisted into the desired shape. There's nothing 'inside' the figure.
If we redraw the Western states using lines instead of areas, we can see that when we pull apart the constituent lines there is nothing 'inside' the states. It is as if we made a wireframe figure out of pieces of stiff wire twisted into the shape of the state boundaries. When we take the figure apart we see it is just bits and pieces of wire.
The distinction between drawings made up of lines and those made up of areas is important because the appearance of the objects depends on how they are formatted. Only the 'substance' of the objects can be formatted. If we wish to draw Western states with different, smooth colors within their interior regions we should use areas to draw the states. We can't color the interiors of a drawing of Western states made up of lines because there is no 'interior' to color.
Imagine, for a moment, the drawing of states using lines as though it were made up of wires and seen in perspective. If we tried to paint the inside of the states with a paint bucket the paint would flow right through the empty spaces between the wires.
If we imagine the drawing made up of areas as though they were shapes cut out of cardboard we can pour paint onto the shape and have it color the interior of the area.
Advantages of Lines
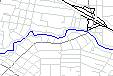
It's a good thing that figures drawn of lines have no interior substance. That makes it easy to use lines to draw linear features like roads in a layer that overlays other objects. One can then see the objects below through the nothingness between the lines.
The image above uses three line drawings stacked up above an image layer. One layer uses lines formatted as thick black lines, while the others use thinner lines. The illustration shows Palo Alto, California, with Highway 101 cutting across from left to right and San Francisquito Creek (the border between Santa Clara and San Mateo counties), shown in blue.
Don't Confuse Area Boundaries with Lines
In a drawing created entirely from areas it could be difficult to see the 'joints' between areas if they fit together perfectly.
Suppose we cut out the shapes of Western states from fine paper and fitted them together so carefully the seams between them could not be seen:
That's a less useful drawing than one that clearly shows the seams between the areas so that it's obvious where each area begins and ends:
By default, Manifold will use an area style to draw areas that draws the last pixel at their edges in a contrasting color. This makes it possible to see the seams between areas even when they are perfectly fitted together. When looking at areas drawn using this default area style, we might be tempted to think that we are looking at a map that includes a set of lines drawn in the shape of the areas; however, this is just a different area style. See the Areas and Boundary Lines topic for more discussion on this.
Using Lines to Duplicate Area Boundaries
Sometimes we will want to use both areas and lines to show the same thing, in order to take advantage of greater formatting flexibility.
It's easy in Manifold to create a set of lines that follow the boundaries of area objects using Transform - Boundaries . If we like, we can use this command to create lines that exactly follow the borders of our Western state areas. We can then stack these lines in a layer above the area layer. This gives us greater formatting flexibility than is possible using area styles alone. For example, we can make the lines layer using extra-thick lines in some boundaries to emphasize certain states.
Another reason to create a layer of lines that follow the borders of our state areas is to create a layer of lines that can be overlaid upon an image. Consider the following example:
Suppose we have an image of
the
If we stack the areas drawing in a layer above the image the substance of the areas will obscure the image. Although we might use a transparent area effect so that the image could show through the areas in this case we will use lines to get exactly the right visual effect desired.
To create the lines, we use Boundaries to create lines in the shape of the area boundaries.
We can create the new lines in a new drawing layer in our map. We can then stack the lines above the image to show boundaries in the image.
Note: this is a small image to fit into the Help documentation and so a very bright color has been used for the boundary lines. In 'real life' it is often cooler to use more subdued colors to achieve a more modern look in one's maps.
Areas Can be Drawn in Opaque or Transparent Styles
By default, areas are drawn using an opaque style in gray color. Objects below areas drawn in such style will not be visible. If you can't see objects that you expect to be in your drawing, make sure that they are not on a layer that is below an opaque area. Move them above the area and they will become visible.
Areas may also be drawn using a variety of transparent hatch patterns or even in a translucent style (by changing the opacity of the layer they are in). In this case, they are like shapes cut out of transparent plastic or translucent paper.
Areas that overlap each other within the same layer will overlap above or below each other depending on the order in which they were created. When working with areas that overlap, it's often helpful to use transparent area styles so that the region of overlap is clearly visible in all cases. See the Overlapping Objects and Transparent Area Styles topics for more information.
When drawings are used as layers in a map , the layers can be shown with different layer transparency . This is a fine way to show overlapping areas.
Suggestions
Use lines to draw linear features like roads and streams.
Use areas to draw regional features such as provinces or lakes.
When formatting objects, keep in mind the visual analogy that lines are like wires hovering above the drawing and areas are like shapes cut out of cardboard.
Drawings and Maps
Drawings by themselves can only show points, lines or areas. To show other visual elements, such as labels or images, we use other Manifold components such as Images or Labels components. By combining drawings with images and labels layers in a map we can achieve exactly the visual effect desired.
Using the Layers Pane with Drawings
The Layers pane is used to control the appearance of drawings within drawing windows. The layers pane includes checkboxes for two system 'layers' - a background color layer and a border layer that shows an enclosing box about the widest extents of objects in the drawing.
Drawings are shown using the checkerboard background Manifold uses to provide a backdrop for any transparent regions. The layers pane is shown to the right of the drawing window.
Checking the Background box in the layers pane will replace the checkerboard background with whatever is the default background color. The default setting for drawings is to show a white background.
Checking the Border box will draw a one-pixel border that represents the minimum enclosing box for all objects in the drawing. When working with drawings that include points, using the Border is a handy way to see if any very small objects exist far away and unnoticed from other objects, since the border will expand to include all objects.
Note that only maps can have true 'layers' in Manifold in the sense that they can layer more than one component within the same map window. The border and background 'layers' in the Layers pane for are not true layers even though they appear in the Layers pane in the same manner as do layers in maps. These are simply system controls that take advantage of the Layers pane as a conceptually convenient user interface.
Clicking off the Background in the layers pane can resolve visual ambiguities between areas that are white in color and regions that are bordered by lines. With Background on as in the illustration at left above it is not possible to immediately see solid areas that are colored in the same color as the background color. With Background off, white areas will stand out against the default checkerboard pattern.
We can change the background color in Tools - Options . See the Layers topic for an example of how changing background color can radically change the appearance of a drawing or map.
Layouts and the Layers Pane
If a drawing has any Layouts created they will appear as 'layers' in the layers pane for that drawing. Checking the box for one of these print layout layers will cause a layout rectangle to appear in the drawing that shows the region covered by the layout.
In the illustration above the drawing has
four layouts that show different parts of
Right clicking onto the hatched border of one of the layout rectangles in the drawing will cause a context menu to appear with controls based on that layout rectangle. For example, we can Zoom to a given layout rectangle, Print it or change its Properties. If a layout is empty (for example, if the layout scope is set to selection and nothing is selected in the parent component) zooming to the layout will do nothing.
Use Tools - Options - Colors - Layout Rectangle to change the color in which layout rectangles are shown. The default color is black.
When we click onto a drawing window, Manifold will automatically change menus and toolbars so they contain those menus and controls that work with drawings. The following are commands that appear which are specific to drawings.
|
Edit | |
|
Cut |
Windows clipboard cut operation. Copy objects to the windows clipboard and delete them from the drawing. |
|
Copy |
Windows clipboard copy operation. Use this to copy objects from the drawing onto the clipboard for pasting elsewhere. |
|
Paste |
Paste the contents of the Windows clipboard into the drawing and deletes any selected objects. Creates new objects in the drawing. |
|
Paste Append |
Paste the contents of the Windows clipboard into the drawing without deleting any selected objects. Creates new objects in the drawing. |
|
Delete |
Permanently delete selected objects from the drawing. |
|
Delete All |
Permanently delete all objects from the drawing. |
|
Projection |
Change the projection used by this drawing. |
|
Select All |
Select all objects in the drawing. |
|
Select None |
Deselect all objects in the drawing. |
|
Select Inverse |
Invert selection: those objects that were selected will be deselected while those objects that were not selected will be selected. |
|
Select Mode |
Choose the selection mode to be used for mouse selection: Replace - Any selection made with the mouse will replace the previous selection. Add - Any selection made with the mouse will be added to the previous selection. Subtract - Any selection made with the mouse will be subtracted from the previous selection. Invert - Any selection made with the mouse will be inverted with the previous selection. Intersect - Any selection made with the mouse will be intersected with the previous selection. |
|
Select Objects |
Choose objects that may be selected by mouse selection: Areas - Any areas within the mouse selection will be selected. Lines - Any lines within the mouse selection will be selected. Points - Any points within the mouse selection will be selected. |
|
Edit - Select by Type |
Select all objects of the currently enabled Select Object modes, for example, select all points or all lines. See the Selection in Drawings topic and the Edit - Select by Type topic. |
|
Snap To |
Enable / Disable Snap modes: Graticule - Snap to graticule intersections if a graticule is displayed. Grid - Snap to grid intersections if a grid is displayed. Areas - Snap to coordinates that define areas. Lines - Snap to coordinates that define lines. Points - Snap to points. Selection - Snap only to objects in the selection, if any. |
|
Instant Data |
Automatically pop up an input dialog after adding a new object to the drawing. Allows rapid data entry when creating new objects. |
|
Find |
Find a string or value using various options. |
|
Find Next |
Find the next object using the previous Find criteria. |
|
Replace |
General search and replace dialog for data attributes of objects. |
|
Go To |
Go to a particular object or location using a variety of options. |
|
View | |
|
Back |
Go back one view. |
|
Forward |
Go forward one view. |
|
Zoom In / Out |
Zoom in brings us closer to the drawing while zoom out moves us farther away. |
|
Zoom To Fit |
Zoom so that the drawing fits the existing window size. |
|
Zoom To |
Zoom to a specified zoom level. |
|
Graticule |
Show a graticule (latitude / longitude lines). |
|
Grid |
Show a grid that may be used to measure or to align editing and snap commands. |
|
Legend |
Display a legend showing formats. |
|
North Arrow |
Display a North arrow. |
|
Scale Bar |
Display a scale bar. |
|
Structure |
Display within the drawing window structural items for objects, including: Object Boxes - The minimum enclosing rectangle for each object. Object Centroids - The coordinate centroid for each object. Branch Boxes - The minimum enclosing rectangle for each branch of multi-branched objects. Branch Centroids - The coordinate centroid for each branch of a multi-branched object. Inflection Points - The coordinates that define each object. Segment Points - The centroid of each line segment (from coordinate/inflection point to coordinate/inflection point) that defines each line or area. Points, of course, have only one inflection point or segment point, located at the point's location itself. See the View - Structure topic for examples. |
|
Panes |
Call a dialog that allows displaying or hiding all panes. |
|
Full Screen |
Show the drawing over the entire monitor area. |
|
Refresh Data |
Update a linked drawing with the latest data from the controlling geocoded table. |
|
Refresh View |
Update the visual appearance of the drawing with any changes made since the last refresh. Enabled only if Autorefresh View is off and some change (such as a selection) has been made that might affect the visual appearance of the drawing. |
|
Autorefresh View |
Automatically update the drawing whenever any changes are made that might affect the visual appearance of the drawing. Turn this option off when working with very large drawings where there is no desire to take the time to show, say, a selection when it is made (repainting a very large drawing on every selection step might take longer than desired). When Autorefresh View is off, we can always cause a refresh on demand using the Refresh View command. |
|
Properties |
View the properties dialog for this drawing. |
|
Drawing | |
|
Open Table |
Open this drawing's table. |
|
Align |
Alignment toolbar commands that work with the primary selected object (selected with a CTRL-ALT click): Left - Move objects so their left edges are aligned to the left edge of the primary selected object. Top - Move objects so their top edges are aligned to the top edge of the primary selected object. Right - Move objects so their right edges are aligned to the right edge of the primary selected object. Bottom - Move objects so their bottom edges are aligned to the bottom edge of the primary selected object. |
|
Center |
Alignment toolbar commands that work with the primary selected object (selected with a CTRL-ALT click): Horizontally - Move objects so that their centroid is centered horizontally in the form. In a drawing, this centers the centroid within the bounding box of all objects in the drawing. Vertically - Move objects so that their centroid is centered vertically in the form. In a drawing, this centers the centroid within the bounding box of all objects in the drawing. |
|
Space |
Alignment toolbar commands that work with the primary selected object (selected with a CTRL-ALT click): Across - Space objects evenly across the form in a horizontal direction. In a drawing, this spaces the centroid of each object evenly across the bounding box of all objects in the drawing. Down - Space objects evenly up and down the form in a vertical direction. In a drawing, this spaces the centroid of each object evenly up and down the bounding box of all objects in the drawing. |
|
Resize Full |
Alignment toolbar commands that work with the primary selected object (selected with a CTRL-ALT click): Width - In layouts, increase width of this element to the full page width, within borders. In drawings, increase width of objects to the full width of the bounding box of all objects. Height - In layouts, increase height of this element to the full page height, within borders. . In drawings, increase height of objects to the full height of the bounding box of all objects. Both - Equivalent to Full Size command in the toolbar. In layouts, increase width and height of this element to the full page size, within borders. In drawings, use the size of the bounding box of all objects. |
|
Resize Same |
Alignment toolbar commands that work with the primary selected object (selected with a CTRL-ALT click): Width - Resize objects so that the width of all is the same as the width of the primary selected object. Width (Max) - Resize objects so that the width of all is the same as the width of the widest object. Width (Min) - Resize objects so that the width of all is the same as the width of the narrowest object. Height - Resize objects so that the height of all is the same as the height of the primary selected object. Height (Max) - Resize objects so that the height of all is the same as the height of the tallest object. Height (Min) - Resize objects so that the height of all is the same as the height of the shortest object. |
|
Minicharts |
Create and format minicharts in this drawing. |
|
Color |
Color each adjacent area using a different color. Applies a thematic format based on a coloring field. |
|
Dissolve |
Merge area objects (dissolving away area borders) that have identical values in given data attribute fields. |
|
Districts |
Assign areas in the drawing to different districts by writing a district code to a specified data field. |
|
Orthogonalize |
Move coordinates to orthogonal grid positions. Used to trim insignificant digits. |
|
Segmentize |
Add redundant coordinates to increase the number of coordinates used to define the object. See the Segmentization topic for discussion. |
|
Simplify |
Remove coordinates that define the object to simplify the shape of the object. |
|
Spatial Overlay |
Transfer data between objects in drawings based upon their spatial relationships. |
|
Unlink |
Enabled for a linked drawing only. Converts the linked drawing to a local drawing with no connection to the originating geocoded table. Equivalent to importing the drawing from the geocoded table. |
Drawing Window Context Menus
Context menus pop open when we right click on an item in Manifold. They are called 'context' menus because what they show depends on the context of where the right click occurred.
Right Click onto an Object
|
Cut |
Windows clipboard cut operation. Copies object to the clipboard and delete it from the drawing. |
|
Copy |
Windows clipboard copy operation. Copies object onto the clipboard without deleting it. |
|
Paste |
Paste the contents of the Windows clipboard into the drawing. Creates new objects in the drawing, replacing any objects that were selected. New objects will be selected. |
|
Paste Append |
Like Paste, but does not delete and replace any objects that were previously selected. |
|
Delete |
Permanently delete this object. |
|
Duplicate |
Duplicate the object. It is wise to immediately move the new object while it is selected. This avoids creating coincident objects that might later cause confusion. |
|
Orthogonalize |
Move coordinates to orthogonal grid positions. Used to trim insignificant digits. |
|
Segmentize |
Add redundant coordinates to increase the number of coordinates used to define the object. See the Segmentization topic for discussion. |
|
Simplify |
Remove coordinates that define the object to simplify the shape of the object. |
|
Center |
Pan the view to center this object in the window. |
|
Zoom |
Zoom to fit this object. |
|
More Like |
Find more objects that have data attributes like this object. See the More Like This topic for tables. |
|
Coordinates |
Launches the Object Coordinates dialog to allow direct editing of the coordinates that comprise the object. |
|
Fields |
Launches the Object Fields dialog that shows any table fields associated with this object. |
The Cut, Copy and Delete functions within the context menu of a drawing work slightly different than their equivalents found in the Edit menu. The Edit menu versions work with the selection. The context menu versions work on those that object that has been right clicked.
Double Click Short Cuts
Double-clicking on legends , north arrows and scale bars will open the Properties dialog for those items.
Double-clicking on an object in a drawing will launch your Internet browser using the contents of a URL field, if any, in the drawing's table for that object. If there is no URL field or if it is not of type 'URL' or if it is empty the Fields dialog will be popped open.
CTRL-double-clicking on an object in a drawing will launch the Fields dialog.
Minicharts
Minicharts are small charts that hover above objects in a drawing. See the Minicharts topic for details.
Frequently Used Panes
Panes are launched from either the View - Panes menu or by ALT-SHIFT keyboard shortcuts listed in the View - Panes menu.
|
Control Points |
Assign control points for geregistration. |
|
Info |
Display data attributes for objects in the drawwing. |
|
Layers |
Turn background and border on/off, show coverage of any print layouts using this drawing. |
|
Selections |
Saved selections for this drawing. |
|
ViewBots |
Assign 'bots to watch this drawing and report an analysis. |
|
Views |
Save and return to particular pan and zoom view. |
Please read the main Selection topic before reading this topic. The Selection topic explains selection modes and the use of select object buttons.
Selection in drawings is the same as selection in drawing layers in maps. Since maps are the preferred user interface for most interactive work, selection is less often done directly within a drawing window. However, it works the same way in both cases.
Objects in drawings may be selected in several ways:
Mouse moves such as Select Box or SHIFT Select Box
Selection using mouse moves within any Tables linked to the drawing.
Selection using the Query toolbar .
Selection using SQL queries.
Objects created by the Transform toolbar are automatically selected after they are created.
Some transform toolbar operators (such as Select Adjacent ) may select objects in the drawing.
Scripts may select objects in drawings.
A selection in a drawing or image can be used to create a selection in a drawing using the Transfer Selection command.
Selection using Mouse Moves
The key to selection using mouse moves is to choose the right selection mode and the desired combination of select object filter buttons. The select object filter buttons used with drawings are:
|
|
Select Areas - Enable selection of areas by mouse selection tools. |
|
|
Select Lines - Enable selection of lines by mouse selection tools. |
|
|
Select Points - Enable selection of points by mouse selection tools. |
Choose the type of items that are to be selected by pushing the selection filter buttons for the desired types. When working in drawing windows, the Select Pixels and Select Text buttons will not be visible since there are no pixels or text labels in drawing windows.
Examples
In the following sequence of illustrations we will make a Select Box mouse selection with various combinations of select objects filter buttons enabled. The Select Box command selects objects that are entirely within the rectangular mouse cursor. We use Replace Selection mode so that every time we make a selection it replaces any previous selection.
The example uses a map with several drawings as layers. It shows land areas in the San Francisco Bay region together with major roads as lines and the centers of named cities as points. The blue water region is not an area but is just the blue background color used for this map that is seen through 'empty' space between the land area objects. The task now is to selectively grab just areas, lines or points in various combinations without selecting undesired types of objects.
Each illustration shows the mouse selection box drawn with the Select Box tool overlaid upon the results of the selection to make clear the action of each selection. In real life, the selection would not appear highlighted in red selection color until after we release the mouse button at the end of the selection click and drag.
![]()
If none of the three select object filter buttons are pushed in then no objects will be selected.
![]()
When all three select object filter buttons are pushed in
all areas, lines and points entirely within the cursor box will be
selected. Note that only those land
areas (representing
![]()
If only the Select Points button is pushed in only points within the mouse cursor box will be selected. Note that selected points are shown with red color used for their foreground color, the normally black outline of the dots.
![]()
If only the Select Lines button is pushed in only lines within the mouse cursor box will be selected. Note that only those line objects that are entirely within the selection box are selected. If we wished to select all lines that are touched by the selection box, we could have used SHIFT - Select Box for an 'open' selection tool.
![]()
Poets, artists and those readers with advanced math degrees will have already begun to see a pattern in this example and will have successfully thought ahead to realize that if only the Select Areas button is pushed in then only areas within the mouse cursor box will be selected.
![]()
Any combination of the select object filter buttons works to select what we want. If we want just lines and points we push in the Select Lines and Select Points buttons.
A reminder: The illustrations above show both the mouse cursor box as well as the resultant selection at the same time. In real life, the selection appears in red color momentarily after the mouse cursor box is drawn and released.
Select by Type
When a drawing window is active, choosing Edit - Select by Type or CTRL-T will select all objects of the currently enabled select object modes. This is a quick way to select all lines in a drawing, or all points or all areas. See the Edit - Select by Type topic.
Selections in Drawings Select Records in Tables
If a drawing is linked to a table making any selection in the drawing will also select the records for those objects in the table. When a drawing and a table are linked there is only one selection within either of them because there is a one to one association between records and objects in linked tables and drawings. Selecting an object in a drawing will select (that is, highlight) the associated record in the table and vice versa.
A very important adjunct to making selections in any drawing or drawing layer in a map is using selection within tables at the same time we are looking at the same data in a drawing. It is very important to read the Selection in Tables topic to learn about selection methods in tables.
Selections Pane
The most frequently used pane when making selections in drawings is the Selections pane . We often will use the Selections pane to save selections made in drawings for later use. Each drawing or drawing layer can have up to seven saved selections in the Selections pane. See examples using the Selections pane in the introductory Selection topic.
Smart Mouse Selection
Smart Mouse selection is used to select objects for editing. An object selected with smart mouse selection will appear with edit handles that can be used to move or reshape the object. An object chosen for editing is also called the primary selected object.
Commands involving the mouse are normally controlled by whatever toolbar button is engaged. To use Select Box for example, we push the Select Box button in and then use the mouse in this mode. To provide fast operations when the mouse is not engaged in any other command, Manifold allows 'smart mouse' selection in a way that mimics ordinary Windows point and click mouse highlighting and motion methodology as is used in Word and other applications.
Smart Mouse Touch Selection
The simplest form of smart mouse selection is to click on an object to select it. This is a smart mouse version of Select Touch. For example, clicking on an area object in a drawing will select it for editing. Clicking on an object
See the Editing Objects topic for examples and more information on interactive editing with smart mouse selection.
Keyboard Modifiers with Smart Mouse Touch Selection
Because a selection may already exist in the drawing when we wish to select an object for editing, smart mouse selection uses keyboard modifiers to allow a richer set of commands.
|
Click |
Equivalent to Select Touch in Replace mode. Click on an object to select it as the primary selected object. All other objects are deselected. Clicking into an empty part of the drawing deselects all objects (with confirmation dialog). |
|
CTRL |
Invert the selection state of the object without changing the selection state of any other object. Equivalent to Invert mode. |
|
SHIFT |
Select the object if it is not yet selected and make it the primary selected object. Does not change the selection state of other objects. Equivalent to Add mode. |
Smart Mouse Box Selection
When clicked on an empty region and dragged the mouse automatically makes a box selection analogous to using the Select Box selection tool in Replace Selection mode. This is a general shortcut for selection. To select an object as the primary selected object for editing, either click on it or SHIFT click on it.
Keyboard Modifiers with Smart Mouse Box Selection
The following keyboard modifiers may be used with smart mouse box selection:
|
Click and drag |
Click on an empty region and drag to make a box selection in Replace Selection mode. Selects all objects that are entirely within the selection box. |
|
CTRL |
Click on an empty region and drag to make a box selection in Invert Selection mode. |
|
SHIFT |
Use an open box selection to select all objects any part of which are within the selection box. |
Notes
Why is it called 'smart mouse' selection? This is based on the idea that to support this type of selection the mouse cursor in its default mode must understand a lot about its environment. For example, it must be able to keep track of and know when it is clicked on a drawing object (and, for that matter, when the object is in the active layer if the mouse hovers in a map window) and much more. This requires considerably more thought for the cursor than merely being a default Windows cursor, so it is said to be a 'smart mouse' cursor.
Note that the default action of the mouse in 'smart mouse' action depends on the context of where it is clicked and how it is moved. For example, clicking on an empty region and dragging creates a box selection mouse move. Clicking on an object and dragging is a drag-n-drop operation.
Tech Tip
When objects in drawings are selected the associated records in the drawing's table will also be selected. One way to browse the data contents of objects is to open both the drawing and the drawing's table.
![]() Click the table window and press the Filter Selected button so the table
window shows only selected records. We
can then select objects in the drawing and see their data contents in the table
window.
Click the table window and press the Filter Selected button so the table
window shows only selected records. We
can then select objects in the drawing and see their data contents in the table
window.
See Also
See the Transfer Selection topic to transfer selections between drawings and images.
![]() A linked drawing is a special kind of drawing
that is created on the fly from the information in an external geocoded
table. Linked drawings are shown in the project pane
using an icon that include a yellow
'database' cylinder to show they are created from a database
table. Linked drawings can show points or lines.
A linked drawing is a special kind of drawing
that is created on the fly from the information in an external geocoded
table. Linked drawings are shown in the project pane
using an icon that include a yellow
'database' cylinder to show they are created from a database
table. Linked drawings can show points or lines.
Linked drawings are read-only and cannot be edited to move points or lines or to add or delete points or lines, except by editing the external table that controls them. They may be formatted and subsidiary components, such as labels components created from the drawing's table, may be created.
For a general introduction to geocoded tables, see the Linked Drawings and Geocoded Tables topic.
To create a linked drawing of points from an external geocoded table:
Choose File - Link - Drawing and open the desired database file or connect to the desired OLE DB or ODBC data source.
2. Choose the table desired and check the desired fields. Specify the fields that contain latitude and longitude values (by default, the system will guess that any fields named 'Latitude' and 'Longitude' are the fields to use. Press OK. A linked drawing will appear in the project pane.
For example, if the table below were located in some database provider (such as SQL Server or Oracle) or was saved in a database file such as an .mdb file it could be used to create a linked drawing.
|
X |
Y |
Comments |
|
1.0 |
1.1 |
Oil Well |
|
1 |
2 |
Oil Well |
|
2 |
4 |
Oil Well |
|
3 |
8 |
Oil Well |
|
3 |
9 |
Oil Well |
|
6 |
2 |
Gas Well |
|
2 |
1 |
Pump |
|
2 |
3 |
Tank |
|
6 |
3 |
Oil Well |
|
6 |
4 |
Oil Well |
|
6.2 |
5.2 |
Pump |
|
6.2 |
5.8 |
Tank |
If we created a linked drawing from the table above using the X field for Longitude / X and the Y field for Latitude / Y we could create a drawing of points like that seen below.
For each record in the table, a point has been created. If we add a new record to the table, delete a record or change an X or Y value then the corresponding point will be added to the drawing, or deleted from the drawing or moved within the drawing.
For a step-by-step example, see the Create a Linked Drawing from a Geocoded Table example topic.
Uses for Linked Drawings
Linked drawings allow us to create drawings from data that is changeable and most conveniently stored within external geocoded tables. The classic use for a linked drawing is within a Manifold IMS application such as a vehicle tracking web site. Suppose we have a fleet of trucks or ships or other vehicles and we would like to display the location of each vehicle on a web site map. Suppose we can acquire the location of each vehicle through some other application that receives location data from a GPS in each vehicle and places it into a table in our database. Showing the location of each vehicle in Manifold is as easy as creating a linked drawing using that table.
Because most data acquisition software for vehicle tracking applications is already programmed to update a database table, using linked drawings completely eliminates the need to teach the tracking software package how to interact with a GIS system. All the tracking software need do is update a table, as it already knows how to do.
Linked drawings are also very useful in situations where the number of objects to be displayed is changeable. For example, suppose we work for an insurance company that sells its insurance products through independent agents. The list of approved agents will change every few days as new agents are added and as poorly performing agents are dropped. We want to create a web site that a prospective customer can use to find the nearest agent offering our insurance products. It would be very convenient to use a linked drawing in the web site so that the list of approved agents can be kept in the form of a geocoded database table.
This reduces the task of updating the list of agents to an interaction with the database table, which allows greater flexibility in software that can be used to update the status of each agent, what products he or she offers from our company and so forth. There will always be many more software packages and programmers who know how to interact with a popular DBMS product than will know how to interact with GIS software. Therefore, using linked drawings is a good way to add dynamic updating of data to Manifold projects and to Manifold IMS web sites without requiring a lot of GIS expertise on the part of accessory software or web site programmers.
Lines in Linked Drawings
Although there is no standard GIS method for representing lines in geocoded tables, Manifold uses a simple convention that can be used to create lines in linked drawings from tables. When importing or linking a drawing from a geocoded table, we may optionally specify a LineID column that will be used to identify which points will be used to draw lines.
As Manifold scans through the table it will draw lines through all contiguous sequences of two or more records for which the LineID value is the same. When the LineID value changes Manifold will start a new line. If the LineID value is the same for only one record the record will be treated as a point and no line will be drawn. The column used for LineID may be of any type, for example, it could be a numeric or a text column. Newly-created lines will inherit the LineID values of the points used to create them.
|
X |
Y |
Comments |
Line Number |
|
1.0 |
1.1 |
line 1 |
1 |
|
1 |
2 |
line 1 |
1 |
|
2 |
4 |
line 1 |
1 |
|
3 |
8 |
line 2 |
2 |
|
3 |
9 |
line 2 |
2 |
|
6 |
2 |
single point |
5 |
|
2 |
1 |
line 3 |
6 |
|
2 |
3 |
line 3 |
6 |
|
6 |
3 |
line 4 |
5 |
|
6 |
4 |
line 4 |
5 |
|
6.2 |
5.2 |
line 4 |
5 |
|
6.2 |
5.8 |
line 4 |
5 |
For example, consider the table above. If the Line Number field is specified as the field to use for LineID then Manifold will use the first three records to draw a line through three coordinate points because the value of 1 is the same in the given LineID field. Next, the system will draw a line through two points corresponding to the records with LineID values of 2. The next record has a LineID value of 5 but because the LineID value changes immediately to the next record it is ignored.
The system then encounters two records with LineID of 6 so it creates a third line through two points. Finally, Manifold reads four records with a Line ID of 5 so it creates a fourth line through four coordinate points.
From the above example note there are two key characteristics of this simple format for representing lines in tables:
Lines are created from records taken in order. The geocoded table must list the coordinate records in the order that the line is to be built, from beginning to end.
Lines are denoted by a change of value in the LineID field and are not tied to unique values. In the example above the 5 value was used twice in the table. Once it was used for a single record and thus ignored and the second time it was used for a line consisting of a sequence of four points.
To amplify the second point, the table below would have the same effect in creating lines as the table above.
|
X |
Y |
Comments |
Line Number |
|
1.0 |
1.1 |
line 1 |
1 |
|
1 |
2 |
line 1 |
1 |
|
2 |
4 |
line 1 |
1 |
|
3 |
8 |
line 2 |
0 |
|
3 |
9 |
line 2 |
0 |
|
6 |
2 |
single point |
1 |
|
2 |
1 |
line 3 |
0 |
|
2 |
3 |
line 3 |
0 |
|
6 |
3 |
line 4 |
1 |
|
6 |
4 |
line 4 |
1 |
|
6.2 |
5.2 |
line 4 |
1 |
|
6.2 |
5.8 |
line 4 |
1 |
A new line would be created whenever the field used as the LineID field changed from a 0 to a 1 or back to a 0. For legibility reasons, though, most applications will use a field for LineID that more naturally identifies the lines to be created than a pattern of changing from 1's to 0's.
For example, if our application is a vessel tracking application that shows where ships are currently located and where they have been an easy way to show the tracks of ships where each ship has a unique ship number is to use the Ship Number as the LineID field.
|
X |
Y |
Comments |
Ship Number |
|
1.0 |
1.1 |
line 1 |
1 |
|
1 |
2 |
line 1 |
1 |
|
2 |
4 |
line 1 |
1 |
|
3 |
8 |
line 2 |
2 |
|
3 |
9 |
line 2 |
2 |
|
6 |
2 |
single point |
3 |
|
2 |
1 |
line 3 |
4 |
|
2 |
3 |
line 3 |
4 |
|
6 |
3 |
line 4 |
5 |
|
6 |
4 |
line 4 |
5 |
|
6.2 |
5.2 |
line 4 |
5 |
|
6.2 |
5.8 |
line 4 |
5 |
We would set up our database so that the table used for the linked drawing is first sorted by Ship Number and then sub-sorted by a date/time field (not shown in the example above) that gives the time each location was acquired. Using the Ship Number field in that case as the LineID field will automatically result in lines that show the ship's track. If we like, we can even format the linked drawing so that lines use directional arrowhead styles so we can see the direction the ship is headed.
Controls
When creating a linked drawing the typical dialog seen when connecting to a database file or data source is seen above. The illustration shows a connection to an Access .mdb file but a very wide range of data sources (ODBC, ODBC.NET, OLE DB, etc.) may be used. This dialog allows us to specify how the linked drawing should be created from the table.
|
Table / query |
Choose the table or query to be used as a source. Queries cannot be parameter queries. |
|
|
Select All - Check all columns. |
|
|
Select None - Do not check any columns. |
|
|
Select Inverse - Uncheck all currently checked columns and check all other columns. A fast way to use all but one column: click Select None, check the one column not desired and then click Select Inverse. |
|
Columns pane |
Check columns that are to appear for each point in the linked drawing. |
|
X / longitude |
Choose a field to use for X coordinate or longitude. |
|
Y / latitude |
Choose a field to use for Y coordinate or latitude. |
|
LineID |
Optionally specify a field to use to determine points that are to be used to guide the creation of lines. A line will be drawn through all points having the same value in the LineID field. A new line will be started for each new value in the LineID field. Single-point lines are ignored. The LineID column may be of any type. |
|
Latitude / longitude coordinates |
If checked, interpret the X / longitude and Y / latitude coordinates as unprojected latitudes and longitudes using decimal degrees. Checked by default. Uncheck if the table coordinates contain projected coordinates. |
Tech Tip: Master the use of linked drawings with geocoded tables that use straightforward, unprojected longitude and latitude coordinates before attempting to work with geocoded tables that use projected coordinate systems for their X and Y coordinates.
Refresh Data
The data in the external table controls the contents of a linked drawing. When a record is added to or deleted from the table a corresponding point in the linked drawing will be added or deleted. If the coordinates of a record are changed in the table the corresponding point in the linked drawing will move.
When Manifold is used interactively, linked drawings are updated whenever they are opened or whenever we press the View - Refresh Data command. When Manifold is used in Internet Map Server mode, linked drawings will automatically be refreshed on whatever interval has been specified.
Note that unlike map server mode, in interactive usage linked drawings are not automatically refreshed. They are only refreshed (updated to any changes in the controlling table) when the drawing is opened or when the Refresh Data command is issued. The reason for this behavior to guard against situations where the linked drawing suddenly changes while we are in the middle of an editing command or a transform operation.
Because external tables can be edited independently of what we are doing in Manifold, if linked drawings were automatically refreshed in interactive mode we could easily encounter a situation where were doing something and suddenly points might appear or disappear or move about. Suppose we were in the middle of transferring a selection from the linked drawing to an image. The sudden change would wipe out the operation.
Caching
Linked drawings are automatically cached
locally using techniques similar to those employed in Manifold Enterprise
Edition to cache shared components that are linked from an
Use with IMS
Linked drawings work very well with IMS (Internet Map Server) applications. There are three main considerations to keep in mind when using linked drawings within a map server project:
Choose a suitable refresh interval. The Refresh linked components every . minutes control in the Export Web Page dialog allows choice of refresh interval. Choosing a value of 0 will force a refresh with every browser session served. With a large number of users, this is a guaranteed way of achieving unacceptably poor performance. A better idea is to choose a low value such as one or two minutes, if a linked drawing must be kept reasonably up to date as, for example, in vehicle tracking applications.
The Internet user login (IUSR_systemname) for the machine running IMS must have access permissions to read the database table used to control the linked drawing. When Manifold runs in IMS mode it runs with the Internet user's permission and so must have the ability to at least read the table.
The path to the table must be preserved, or IMS will not be able to find the data source and open the table.
Absolute Paths
When specifying a database table to control a linked drawing the path to the data source is often normalized by Microsoft OLE DB or ODBC drivers to an absolute path. Therefore, when moving projects and any tables used by linked drawings to a different machine, try to preserve the absolute path to the table. For example, if the table is located at C:Manifold Projectsmytable.mdb on one machine then place it in the same location on the other machine. This is obviously an important consideration when moving files from a development machine to a production IIS machine for use with Manifold IMS in a map server application.
Beginners who wish to exchange data with other users should employ linked drawings with care. The table controlling a linked drawing is by definition outside of Manifold and so is not stored within the Manifold .map project file. Sending a colleague a copy of your .map file will not also send them the database table that controls the linked drawing.
Converting a Linked Drawing to an Ordinary Drawing
Convert a linked drawing to an ordinary drawing by right clicking on the linked drawing in the project pane and choose Unlink. This will cut links to the controlling table and recreate the drawing as an independent, ordinary drawing.
Importing an Ordinary Drawing from a Geocoded Table
Drawings may also be created from geocoded tables by using File - Import - Drawing and selecting a database table file or data source in the Files of type box. In this case a drawing of points will be created from the geocoded table but it will not be linked to the table.
Creating a 'Lines-only' Display
When creating lines in a linked drawing using the LineID option Manifold will draw all points as well as lines in the drawing.
This can result in a cluttered display, like that seen above created from the tables used as examples earlier in this topic. The lines have been formatted using a directional line style to show their beginnings and ends. Since points are also drawn they appear above the lines in the same drawing and depending on placement can clutter the drawing.
In interactive work we can easily remove the points, if desired. When working with IMS we cannot interactively delete the points, but we can use a convenient formatting trick to prevent them from appearing. We simply format the drawing so that points are drawn using transparent color for the foreground color.
This causes the entire point to disappear so no points appear in the drawing, resulting in a lines-only drawing. If we need to create an IMS display that has a combination of some lines and some points we can create two linked drawings in our project from the same table, one of which uses the LineID option and has foreground formatting for points set to transparent color so there are no points and the second drawing of which does not use the LineID option so there are no lines. By using the two drawings in a map with the lines-only drawing appearing in a layer above the other drawing we can cause points to appear below the lines.
The appearance in IMS will be the same except that the points will appear to be drawn below the lines.
There are many possibilities to create exactly the display desired. For example, if a display is desired that shows lines for all points but which draws points only for single points or only for the last point in a line sequence we can use SQL to help create such a display. We begin by creating a lines-only display in one linked drawing. Next, assuming that points have fields that can be used to distinguish one point from another we can use a SQL query in our database to create a table that has only single points or terminal points (through clever use of fields that distinguish one point from another) and then create a linked drawing from the query.
Combining the two drawings in a map will result in a display that shows lines for all points but draws only those points that are single points or that are terminal points. The exact SQL expression that creates a table of only single points or terminal points will, of course, be dependent on what fields are available and how the geocoded table is written in the first place. For example, if we have a vehicle tracking application the code that updates the table with the latest position point may write a flag field that marks this record as the latest in the sequence for that vehicle.
See Also
Linked Drawings and Geocoded Tables
Create a Linked Drawing from a Geocoded Table
Formatting Lines in a Linked Drawing
Importing and Linking Tables (for a discussion of ODBC and file types used for tables).
Hyperlinks are URLs (Internet hyperlinks) that are embedded into objects in a drawing. If an object has a hyperlink, double clicking on the object will launch an Internet browser using the object's URL. If an object does not have a hyperlink, double clicking on it will launch the Fields dialog.
Adding hyperlinks to objects:
1. Open the drawing's table.
2. Create a new field called URL that is of type URL or any text type (fixed or variable length ANSI or Unicode text).
3. For each object that is to have a hyperlink, enter the desired hyperlink into the object's record in the URL column.
When the mouse is double-clicked on an object in a drawing, Manifold goes to the URL field of the table, fetches the hyperlink stored there for that object and launches an Internet browser using that link. If the URL field is empty, or if it is not of database type 'URL,' Manifold will launch the Fields dialog for the object.
This provides a fast meaning for double clicking on an object in most cases. If the object has a URL an Internet browser is launched. If it does not have a URL, the Fields dialog pops open.
Example
We would like to use the Congress.map example provided on the Manifold CD to look up the web
pages of each
Open the Congress Table associated with the Congress drawing. The table has a column called Web page that contains the URL of each congressional representative's web page. This Web page field is an ANSI Text field.
First we will rename the field to URL. Right-click on the Web page column head and choose Rename. Change the name to URL.
Next, we will change the field type to URL. Right click on the column head and choose Change Type. In the Column Type dialog, change the field type to URL. [Manifold has a 'URL' database field type]. Press OK. Close the table window.
We can now open the Congress
drawing window. Whenever we double-click
on a congressional district in the drawing, Manifold will launch a browser
window loaded with that representative's web page taken from the URL field. For example, we can double-click on

Like magic, a browser window pops open with Congressman Jim Gibbon's web page in it.
If we wanted to see the fields associated with that
district, we could have CTRL-double-clicked
onto
That will open the Object Fields dialog for that object.
More sophisticated uses
The example above shows URLs in use to open a very simple web page. We can also use URLs that are local references to files on our local hard disk. If such files are image files in a format that can be displayed in browsers (such as .jpg, .png or .gif) we can URLs to show pictures associated with objects.
Because web pages can be very rich and browsers can display all sorts of things automatically, we can use the general mechanism of specifying a hyperlink via a URL to display all sorts of things. For example, we could have a drawing that shows a factory floor plan with locations of different machines. For each machine we could have a URL pointing to a PDF document or other document that provides its user manual. Double clicking on the machine in the drawing will open its manual.
More dynamic information can be achieved by linking a table into the Manifold project from an external database and then forming a relation between the linked table and our drawing's table. If the linked table contains a URL field called 'URL' and that column is brought in via a relation it will be used for the hyperlink. We could therefore keep a database of sites, documents, images or other information that dynamically changes so that whenever we double-click onto an object in the drawing the URL field to which the browser jumps will be taken from the external database provider's table.
Tech Tips
Since most drawings in GIS aren't used for Internet hyperlinks the fallback behavior of hyperlinks to launch the Fields dialog is a useful way of preserving double-click functionality for a quick look at object fields. However, in the case of drawings that are used for Internet hyperlinks if a particular object has an empty URL field the Fields dialog will also be launched. That may not be desired. To avoid this situation, create a simple web page that reports something like 'This item does not have a web site' and save it on the local disk. In the table window select all records with an empty URL field and fill it with the local path to that web site.
For example, if we created an empty.html web page in the C:tmp folder we would fill all empty URL fields in the table with C:tmpempty.html. When someone clicked on an object that did not have a web site the browser would launch using our empty.html web page.
Whether double-clicking an object launches a new browser window or appears within a previous browser window is set by your browser options. In Microsoft Internet Explorer, see Tools - Internet Options - Advanced and uncheck the Reuse windows for launching shortcuts box if you would like each URL to launch a new browser window.
When using drawings that contain hyperlinks within Manifold IMS applications we will probably also want to use layer restrictions
Drawings are made up of points, lines and areas that are drawn in a 'connect the dots' fashion between exact coordinates. The appearance of drawings is highly dependent on the formatting choices used to draw the points, lines and areas. The main formatting choices are:
|
Foreground Color |
The color of solid points and lines and the outer border of two-color area styles. Choosing a transparent color for foreground color for an area will turn off display of that area. This is a short-cut way of turning off areas when desired. |
|
Background Color |
The fill color in most styles used for points, lines and areas. |
|
Style |
The pattern or icon used to draw points, lines or areas. |
|
Size |
The relative size to use for patterns used to draw points, lines and areas. Does not apply to icons or photographic area patterns. |
The Format toolbar for drawings shows the basic formatting choices in use for the active drawing or drawing layer in a map.
It shows foreground color, background color, style and size currently in use for areas, lines and points. Default formatting uses light gray for background colors with black used for foreground color for lines and points and dark gray used as the foreground color for areas. Changes made in this toolbar will immediately be applied to the drawing. Drawings (and thus drawing layers in maps) have one set of formats for all areas, lines and points in that drawing. The format toolbar always shows the formats in use for the active layer or drawing.
To Change Formatting
1. Click on the layer tab that contains the objects.
2. Click on the format control to be changed (colors, style or size) for the type of object to be changed (areas, lines or points).
Color Wells
Click on the foreground or background color wells in the format toolbar to change color.
The color wells display knows what the current color is and will display a sample of color wells that Manifold reckons will be helpful. The screen shot above shows that the current color is a bright blue (indented well). The top line will always show lightness variations of the current color. The second line in the color wells display will show grayscale variations. The X color well in the upper right is transparent color. Using that color will result in transparency everywhere the color is used.
The rest of the color wells pane shows a range of colors beginning with blues and greens and ending with reds. Scroll down using the down arrow at the side of the pane.
Press Theme to invoke thematic formatting. Press More to open the standard Windows color-picking dialog.
Formatting Via the Layers Pane
The Layers pane includes a View Format button that expands the pane to include a miniature format toolbar for each drawing layer. When formatting many layers in a map it will be more convenient to use the layers pane. This will be faster than clicking on a layer tab and then using the main format toolbar. The miniature format controls in the layers pane also serve as a useful summary of formatting in each layer.
Layer tabs are more convenient with a small number of layers. Using the main format toolbar will also save screen space in smaller displays, thus allowing a greater amount of screen space to be used to show the map window.
The example below uses layer tabs and the main formatting toobar.
Example
We begin with a map of
CA areas contains areas showing the land regions of
CA hydro contains lines showing various hydrological (water) features.
CA roads contains lines showing main roads.
US towns contains points showing the center points of populated places with populations above 20000.
In this example map, all of the layers contain one type of
object (areas, lines or points) only. In
the illustration above, the CA areas
layer is the active layer so the format toolbar shows the formats for that
layer (all default settings). Even
though the CA areas layer contains
areas only, the lines and points format controls are enabled so we can set
values that will be used for any lines or points that might be created in this
layer. The illustration is zoomed into
the southern part of
To change the color of the areas in the CA areas layer, we click into the background color well for areas and change the color. Let's change it to a khaki green color. All areas in the layer will instantly change background color. Note that the default area pattern draws the edges of areas with a pixel of foreground color, which remains the default dark gray.
Let's make the water features blue. These are located in the CA hydro layer so we click the CA hydro tab to make this layer the active layer. As we click the CA hydro tab, the format toolbar will switch to show the settings for this layer. We haven't changed anything in this layer so it still shows the default settings.
Solid lines are drawn in foreground color, so we click into the foreground color well for lines and change the color to a bright blue. Instantly, all lines in this layer will change to blue color. Note that this change affects lines only in this layer. Road lines, for example, are not changed when we change the formatting of the CA hydro layer.
To change the format of road lines, we click the CA roads tab. The format bar changes to show the formats for this layer, which are still the default settings.

Let's make the road lines a dark green. We do this by clicking on the foreground color well for lines and changing the color to dark green.
If we want the road lines to be less visually apparent, we can change them to a dashed line style by clicking into the style well for lines and choosing a dashed pattern. The dashed pattern we chose uses foreground color for the dark bits and background color for the light bits. If we choose the same color as was used for the areas in CA areas for the background color for our lines, they will appear to be dashed segments.
A better way of achieving this same effect is choosing transparent color for the background color; that is, to use no color (for complete transparency) for the background color of lines. Click on the transparent color well at the upper right of the main palette to chose transparent color.
If we chose transparent color for the background color, the
alternate segments of the dashed line style would be transparent. This would avoid the unpleasant effect seen
above where the road lines cross
We now click the

We can make the points in this layer instantly more visible by changing the background color for points (the fill color) to bright yellow.

Clicking into the style box for points and choosing a square changes the points to square boxes. Increasing the size parameter to 10 makes the boxes larger.
Changing line or area format settings for the
If we now use the Shapes
toolbar to draw an area in the
Finally, if we click back on the CA hydro layer, note that none of the formatting changes made to other layers has applied to this layer. It still retains default formatting for areas and points, with the only change being the use of bright blue color as the foreground color for lines. Changes made with the format toolbar apply only to the active layer.
Points and Lines in the Same Layer
Drawings are often imported from GIS formats intended for use in maps where the roads might be used for transportation network analysis. In such cases the map of roads is drawn as a network with point objects located at the ends of each line. This is done because mathematically a network is defined by points (nodes) and not the lines (links) between them.
![]()
When imported into Manifold, such road drawings will appear in default formatting. Because default formatting uses a size of 5 for points, the roads will have lots of 'bubbles' throughout. Changing this is easy.
![]()
Simply click on the size well for points and change the size to 1. A size of one draws each point symbol as a single printer's point in size, so the points will blend into the default size of lines.
The above is a quick means of dealing with the visual appearance of the drawing, but it still leaves the points in the same layer as the lines. If we change line colors or size, we will have to remember to change those parameters for the points as well if we want the points to continue to appear blended in with the lines. A better idea is to select all the points in this layer and to move them to their own layer. We can then turn that layer off and on at will whenever we want to see the network node points. Should we want to do transportation network analysis, we can select the lines and points to be used as a network. Manifold has no problem working with nodes and links that are in separate layers.
Thematic Formatting
Thematic formatting is the use of a controlling data field to automatically vary the color, style or size of objects. For example, we might vary the size of points showing cities based on a population field for each point. Cities with greater populations would be shown as larger points.
See the Thematic Formatting topic for more information.
See the Color topic for fast 'four-color' coloring of drawings.
Notes
The most common formatting error is to lose track of which layer contains which objects. The best way to avoid this is to name layers in a sensible way ('Roads,' 'Streams' and so on) so that it's obvious which objects are in which layers. If we lose track anyway, we can always see which objects are in a particular layer by double clicking the layer tab to turn it OFF and ON. It will be immediately obvious which objects are in that layer as they turn OFF and ON.
If one wishes to uses hundreds of formats in a map, doing so is perfectly possible. This is done by creating many drawing layers if need be. If some class of objects is important enough to distinguish with a different format it is important enough to organize in a separate layer.
To have a different visual appearance for object in the same layer, use Thematic formatting. This assures there is some guiding pattern to the different colors or other format attributes.
The hydrography lines in the
See www.gordonbiersch.com for more
on where to find real European beer when visiting your venture capitalists in
Setting Background Color
Drawings have an overall white background color by default. Background color for all components is set by default in the Tools - Options dialog. Each individual component can have its background color set by opening the component in a window and choosing View - Properties.
|
Politica de confidentialitate | Termeni si conditii de utilizare |

Vizualizari: 2492
Importanta: ![]()
Termeni si conditii de utilizare | Contact
© SCRIGROUP 2025 . All rights reserved