| CATEGORII DOCUMENTE |
| Asp | Autocad | C | Dot net | Excel | Fox pro | Html | Java |
| Linux | Mathcad | Photoshop | Php | Sql | Visual studio | Windows | Xml |
To customize any part of the chart, right-click it and choose Properties (the exact name depends on the element). A dialog box opens, and from that dialog box you can change the line and fill colors and properties. Before formatting, make sure you understand the difference between a data series and a data point. Suppose you have a bar chart with three blue bars, three red bars, and three yellow bars. The group of the three yellow bars is a data series. An individual instance of a yellow bar is a data point. Most of the time, when you change the colors or lines, you want to change whole data series at a time. You seldom want to change an individual data point, although Excel does let you do it.
When selecting what you want to change, first click the element. The first click on a data point (for example, a bar) selects its entire data series. A second click on that same data point selects that one data point individually. Be aware of what you have selected before you start formatting. The selection will have black squares around it.
To format a chart element's lines and fills:
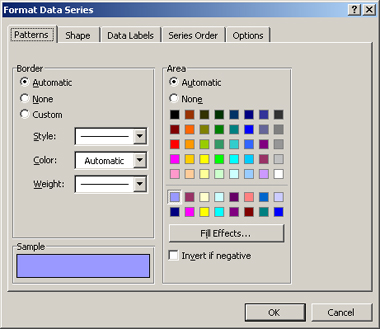
Figure 5-16: Change the color, fill, and other
attributes of the selected chart element.
|
Politica de confidentialitate | Termeni si conditii de utilizare |

Vizualizari: 1204
Importanta: ![]()
Termeni si conditii de utilizare | Contact
© SCRIGROUP 2025 . All rights reserved