| CATEGORII DOCUMENTE |
| Asp | Autocad | C | Dot net | Excel | Fox pro | Html | Java |
| Linux | Mathcad | Photoshop | Php | Sql | Visual studio | Windows | Xml |
Visual Studio 2005 Team System for Developers
Arguably, in any software development project, developers perform the key role. Not so long ago, before software development became a profession, developers often worked along; renegades writing code in a darkened room. Later, as software became more complex, developers worked in teams, planning an application over coffee, soda and pizza.
Today, software is far more complex, requiring well-organized teams of people, from architects to testers. In this environment, structure becomes very important. Visual Studio 2005 Team System can be a critical tool to assist in providing that structure.
VSTS provides an entire suite of tools for developers. These tools help the developer create more efficient, less bugs and cleaner code in less time. Some of the VSTS tools geared toward developers include a Class Designer to assist in developing well-structured class diagrams graphically, unit testing tools, code coverage tools, static analysis tools and even profiling tools. All of the work performed using these tools can also be tracked by associating the work done with a Work Item.
In a development lifecycle build using VSTS, the primary method for initiating action is a work item. Depending on the structure of the development team, a developer may be assigned a task from the program manager, a solution architect, a senior developer, a tester, a fellow developer, or even the developer themselves.
There are many ways of viewing the work items that have been tasked. Inside of Visual Studio the primary way to view work items is to use the Work Items Project Queries. There are several default queries created inside the project. These queries are determined by thee development methodology used. For instance, in the MSF 4.0 Agile methodology, there are queries that return the currently active bugs, all the work items assigned to the currently logged in developer, all tasks, all bugs, and several other built in queries. Users can also create their own query to view particular work items of interest. In fact, if the development methodology has been modified to include new types of work items, users can create a custom query to ensure they stay on top of the assigned work items.
Custom queries are created by adding them to the "My Queries" folder (figure 6-1). When a query is added, users can select a broad variety of selection criteria, including who assigned the work items, who they are assigned to, whether or not they have attachments, their current status and many other criteria. In fact, users can even query work items based on the number of files that were attached to the work item.
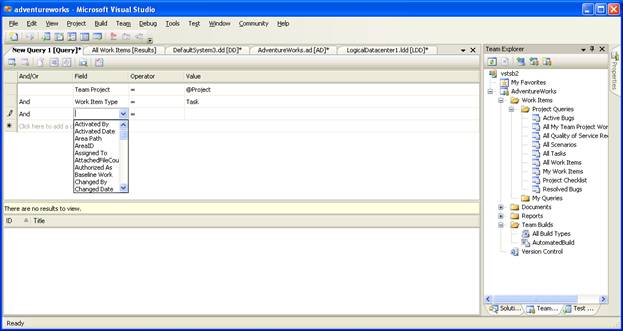 Figure 6-1
Creating a new work item query from Team Explorer
After being tasked to develop some business functionality, the first thing that a developer will need to do is create a structure from which to build the code.
If developers are just using the Team Developer version of VSTS, they won't be able to create code from the architectural diagrams. If that's the case they will depend on the architect to have generated the appropriate skeleton code. If, however, they also have Team Architect edition installed or are using the Team Suite edition, they will be able to do everything the architect is able to do, including generating skeleton code from the solution diagram. Either way, at some point they will have a basic, skeleton code structure with all of the appropriate connection points to other services already defined.
Once developers have the appropriate skeleton code, they then must implement the business logic and desired functionality. If the architect has generated the code skeleton, the first step is to check the code out from source control. Developers can then begin implementing the actual code.
There are a few different ways to create code in Visual
Studio 2005 Team System. Developers can
write code as
The Class Designer itself is technically not only a part of VSTS it's also included in the other versions of Visual Studio as well.
The Class Designer has many excellent features that can improve both the speed of development and the quality of the resulting code. Seeing the code visually allows developers to quickly ensure that there is a clean relationship between the classes and that the class inheritance hierarchies are of a reasonable depth. In addition, developers can use graphical features to create new classes, add new properties and methods to those classes, and set up relations between classes.
Figure 6-3 shows a simple class diagram of a Dog class, an
inherited Beagle class, and also an owner class that is related to the Dog
class. Note that the connection between
Owner and Dog is an association relationship, and it has a
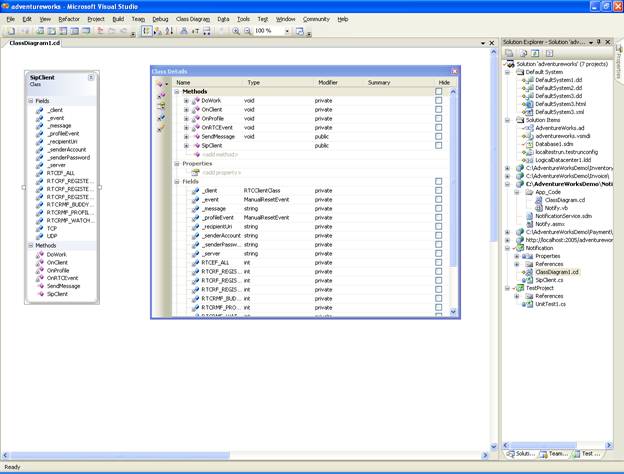 Figure 6-2
A simple class diagram created using the class designer
Another powerful feature of the Class Diagram is the ability to quickly use the Object Test Bench. The Object Test Bench is a fast tool to create an instance of a class so developers can test its features easily, without having to spin up a quick windows application and some lines of code to create an instance and call it.
The Class Designer also allows users to do a fair amount of refactoring, directly inside the graphical interface. For instance, back in Figure 6-2, there was an inheritance hierarchy with a Dog class. If developers wanted to extract an interface from the Dog class, they would simply right-click the Dog element, and select "Refactor -> Extract Interface". A wizard then walks them through a few steps, allowing them to select which elements of the Dog class they want to be included in the interface. The interface is then created in code, and they Dog class is changed to reflect an implementation of the created interface.
In any development project larger than some simple demo
code, there is a critical need for some sort of source code control. In the Microsoft world, this has generally
meant
With the introduction of the Team Foundation Server and VSTS, Microsoft has introduced an advanced, full featured, enterprise source control system able to handle the most complex development tasks. It handles activities such as code branching and merging, and it includes new features such as code shelving, which allow developers to place their unfinished code in the repository without actually checking it in. It also provides different types of locks when checking out files from source code control. Users can decide to not lock the code at all, allow others to check out code but not check-in code, or lock other developers from even checking out the code at all (Figure 6-3).
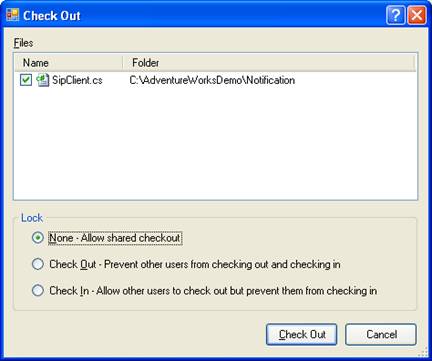
Figure 6-3
Checking out code
One of the major features of Team Foundation Server and VSTS is that it allows the creation of source code control check-in policies. These policies can warn developers if they are trying to checkin code that violates some stated policy. These policies can be defined by an administrator and include rules such as that the source code must have been reviewed by a senior developer, or that unit tests must have covered more than 80% of the code, or even that there are no static analysis violations of the corporate naming convention guidelines.
When developers check-in code, it can be associated with a work item. This allows developers to track their work as it relates their assigned tasks. When code is related to a checkin, it also is reported to the Team Foundation Server. This allows reports to be generated that track code churn, bugs and the progress made toward project completion.
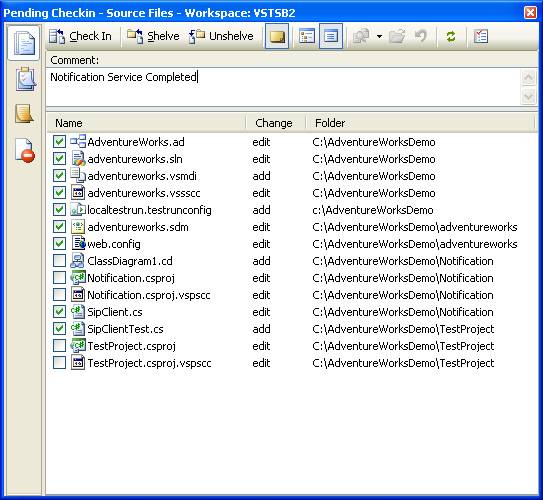
Figure 6-4
Checking in code
Associating a checkin with a work item allows the progress of the project to be tracked more closely, as well as allowing other developers to easily find code relating to certain features of the system (figure 6-5). This is especially true if users relate the code to a Quality of Service Requirement or a Scenario work item.
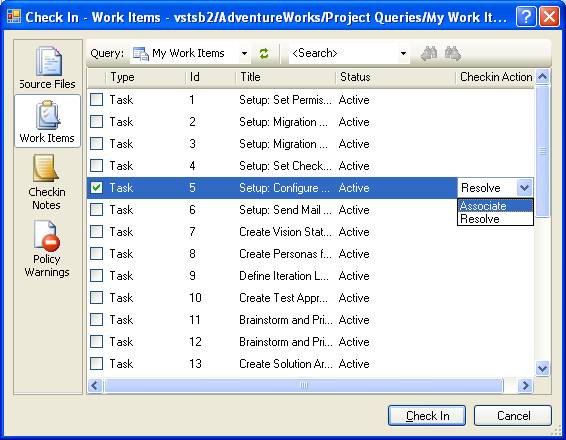
Figure 6-5
Associating a check-in with work item(s)
There are many different tools which can use to access the
source control inside
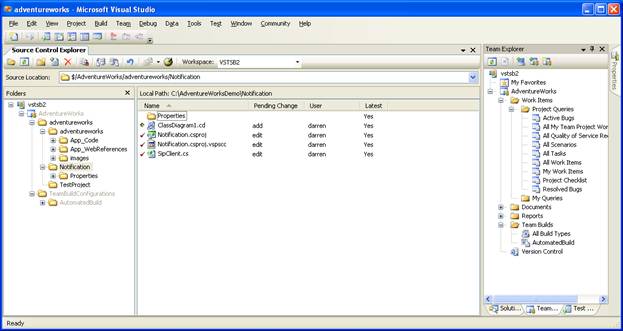 Figure 6-6
Using the Source Control Explorer
In addition to the Source Control Explorer developers can use the Pending Checkins window. This window allows users to check-in existing code, shelve and unshelve code, associate work items with the checkin and other source code related tasks. Pending checkins are a way for users to determine what code they currently have checked out of source code control. It also alerts developers to what code is only stored locally, since any changes made since check out have not yet been uploaded to the server. This means that a failure of the local system could result in code being lost. Shelving the code, can help.
Shelving code allows a developer to place their code on the TSF Server to ensure the code is safely tucked away, but without the need to fully check-in the code.
In many source control systems, users can simply check-in code, even in an unfinished state, and check it out later for the fixes. However, because of the source code control policies mentioned earlier, users may be unable to check-in the code because it is not yet ready to pass the policies. In this case, users can simply shelve code, since shelved code does not have to pass the source code control checkin policies.
When unshelving code there may be a conflict with code that developers have changed locally, since shelved code doesn't prevent them from editing the files that were shelved. (This allows users to shelve multiple versions of the same code) In that case, the user will be informed of the conflict and presented for options for resolving the conflict.
Source Code Control Checkin Policies are used to ensure that the code checked into source code control passes a set of minimum standards. Generally, senior developers or architects will specify the policies to ensure that the enterprise developers follow the appropriate coding guidelines when designing, building and refactoring code. These checkin policies can also be enforced against unit tests that are checked into the system as well.
One of the greatest advances in Visual Studio 2005 Team System is the addition of integrated testing. Testing has steadily grown more popular over the past few years and more and more developers have begun using a development methodology that encourages the strict use of testing.
VSTS provides numerous testing
The ability to generate unit tests isn't the only feature available in VSTS however. Developers can also run a suite of unit test while looking to see the amount of code that is covered by those tests. This is called code coverage testing, and it allows users to see, by line, what areas of the code were tested by the unit tests that were run, and which weren't.
Static analysis testing is also available. Static analysis tests allow a developer to analyze their compiled code for common errors and poor programming practices. For .NET developers using Visual Studio .NET 2002 and 2003, this has meant using a plug-in like FxCop to perform static analysis on the code. The ability to do static analysis is now built into Team Developer allowing developers to quickly and easily get concrete recommendations for improving code with a minimum of effort.
Finally, developers are able to profile their code for performance. Profiling allows them to see where their application is spending the majority of its time, how long methods are taking to execute and identify performance bottlenecks in their application.
One of the primary development trends in testing is the use
of
The most important benefit of TDD is confidence - confidence
in code. When the team has a suite of unit
tests that effectively tests the code, they can be confident that the code will
compile and run with a very low likelihood of errors. Thus, when a customer asks to see a
demonstration of the code in its current state, developers don't need to spend
hours running through the code trying to check out possible locations for
errors, and fearing that something might go wrong. Instead, they can simply run the suite of unit
tests against the code, ensuring all of them pass. When they do, the code can be compiled and
demonstrated or
 Another major benefit
to TDD is the ability to confidently refactor code. Refactoring involves changing existing code
to improve its design. Try as we might
to create loosely coupled code, in any non-trivial software development project
there will always exist strongly coupled objects or
methods. This strong coupling can make
it extremely dangerous to change the structure of the code, since a change in
one area of the code can impact another area. At times, these impacts aren't entirely clear and may not be caught in
compile-time checks. Thus, many
developers avoid making clear improvements in their code for fear it will
Another major benefit
to TDD is the ability to confidently refactor code. Refactoring involves changing existing code
to improve its design. Try as we might
to create loosely coupled code, in any non-trivial software development project
there will always exist strongly coupled objects or
methods. This strong coupling can make
it extremely dangerous to change the structure of the code, since a change in
one area of the code can impact another area. At times, these impacts aren't entirely clear and may not be caught in
compile-time checks. Thus, many
developers avoid making clear improvements in their code for fear it will
Further benefits include the drastic reduction in time spent
debugging. Granted, developers using TDD
will have to spend a good deal of time building unit tests, however much of
that time is compensated by the reduction in debug
time. It's said that developers spend
60% of their time in design, 30% of their time in development, and the 80% of
their time debugging. Although
tongue in cheek, that sentence rings true for many developers. Debugging always takes far more time than
originally planned, regardless of the complexity of the code. TDD reduces the time spent in debugging. It does this by clearly
In order to build clean, well structured code, there should be some mechanism for the developer to ensure that the code written runs effectively. One way to do this is for the developer to write a piece of code, then run the application, seeing if it works the way it should. They then move on to the next piece of code. Never coming back to test that functionality until it's close to the release date. Unit tests are a way to automate that method of testing so that the tests can be run repeatedly as the product is developed.
Basically unit tests involve designing a series of test cases that test whether the business logic is functioning correctly, and that inputs produce the expected outputs. To be complete, many unit tests may test the same piece of function code to ensure that all of the branches and internal code flow are tested. Because unit tests test basic functionality at the method level, it is considered a developer responsibility, and not the responsibility of the testing staff.
The
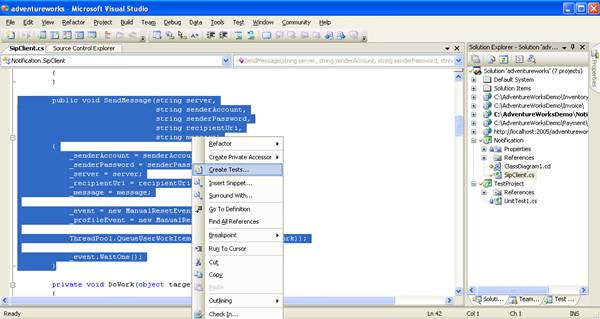 Figure 6-7
Creating a unit test from code
Once a developer as selected to build a unit test. A wizard guides them through the rest of the steps. They can select which tests they would like to generate, as well as in which language the test project should be created (Figure 6-8).
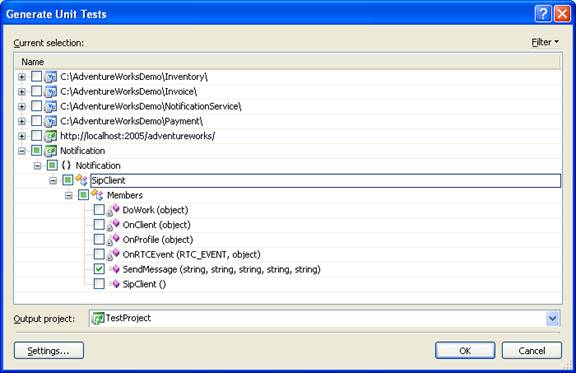 Figure 6-8
Generating unit tests for class members
Once the unit tests have been generated, they can then be edited to test for the desired functionality. Figure 6-9 shows a completed unit test for the SendMessage() method.
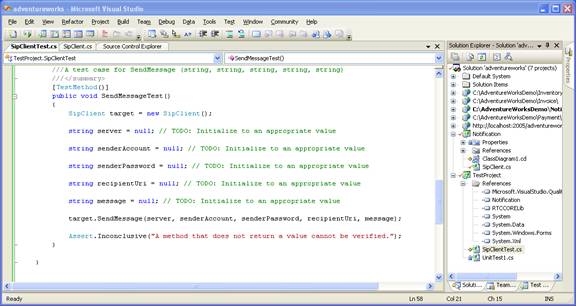
Figure 6-9
The completed unit test on the SendMessage() method
Finally, the unit tests are executed. This is done either in the Test Manager window (Figure 6-10) or the Test View window. From either of these windows users can execute selected unit tests. In addition, the Test Manager window allows users to create groupings of tests that should be run together.
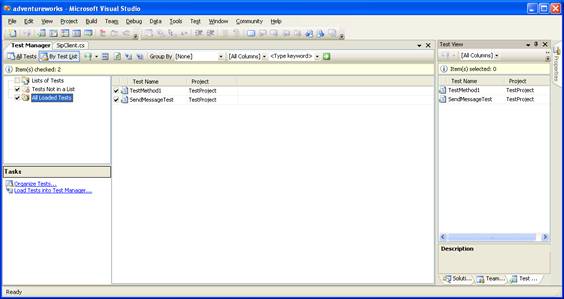
Figure 6-10
Unit Test Manager
When the tests have been executed, the Test Results window pops up and shows the results of the test (Figure 6-11).
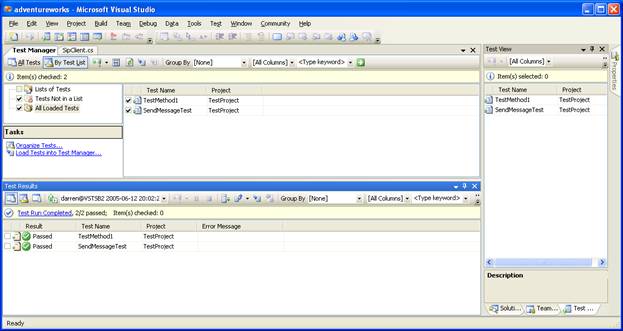 Figure 6-11
Unit test results - passed!
Writing unit tests is a critical tool for creating solid, quality code. However, in order for a developer to be sure that enough unit tests have been written they need an additional tool. The code coverage tool built into VSTS provides a simple method to verify that the created unit tests are testing as much of the code as possible.
One of the nicest features of using the code coverage tool
is that it so dramatically demonstrates what areas of the code were not covered
by the unit tests. After looking at the
statistics of how much code was covered, developers can simply open up the
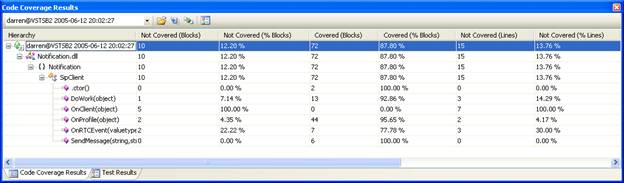 Figure 6-12
Code coverage summary
Once the tests have been , developers can also look at the code directly. Notice in Figure 6-13 that the code covered by the single unit test is only the first few lines, and that these lines are highlighted in green. The remaining code in the SipClient is highlighted in red, an d was therefore not covered by the current set of unit tests.
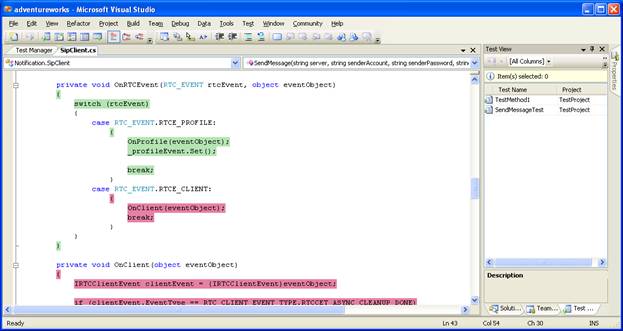 Figure 6-13
What code wasn't covered
Creating quality code often involves analyzing code for known defects. In VSTS this is done through the use of static analysis. The static analysis tool found in VSTS that analyzes .NET code is an evolution of FxCop. The static code analyzer runs against compiled code looking for a very large number of known defects and poor programming practices. In addition, it can be used to enforce corporate naming conventions.
The rules used by the static analyzer are fully extensible, and its possible to add a new rule relatively quickly. It is also possible to enable and disable rules that will be run against the code. For instance, developers may choose not to run the rules that enforce naming conventions, but be very interested in the results of the tests that check for known security issues.
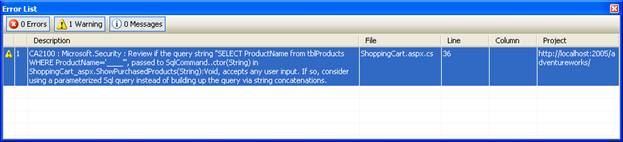 Figure 6-14
Results of the static analysis test
After the code has been written, tested and checked for known defects, it's time to profile. Code profiling is the process of analyzing how code executes and where the majority of time is spent inside the code. Code profiling enables developers to measure the performance of an application and identify performance-related issues in the source code. The application may have some relatively small method that is executed so often that the majority of time spent executing they code is spent in that method. Conversely, it may have a large, slow method that is called so infrequently as to make optimization the performance of that code virtually worthless. Determining where to spend valuable development time is critical!
In order to determine where to spend time improving code, developers can use one of the two profiling engines built into Visual Studio. The two profiling methods are sampling and instrumentation.
In the sampling, the profiler interrupts a running application at periodic intervals to determine which function is being executed. The profiler keeps track of the number of times that it was in that function by incrementing a counter. It also looks at the stack trace to determine that functions that were called prior to that method. By interrupting the application hundreds or thousands, or millions, of times, a statistical view of the application is generated. Although this method is not deterministic, it is a fairly reliable method of determining where an application spends the majority of its time. Once the application is stopped, a report is generated that provides the profile data.
The instrumentation method is more intrusive that the sampling method. In this method, the profiler inserts enter and exit probes into specific functions of an application. These functions are now monitored when the application runs. The probes capture the deterministic performance metrics for the functions. This means that developers get information about how long a method takes to execute. It also provides a relatively complete numeric look at how often various methods are called. Once the application is stopped, a report can be generated based on the data gathered by the instrumentation profiler.
|
Politica de confidentialitate | Termeni si conditii de utilizare |

Vizualizari: 1124
Importanta: ![]()
Termeni si conditii de utilizare | Contact
© SCRIGROUP 2026 . All rights reserved