| CATEGORII DOCUMENTE |
| Asp | Autocad | C | Dot net | Excel | Fox pro | Html | Java |
| Linux | Mathcad | Photoshop | Php | Sql | Visual studio | Windows | Xml |
The Coverage Profiler
The rest of the tools and ideas covered in this section have had to do with writing applications. This chapter covers the only tool that helps you with the next part-testing. There are several key processes you can perform to improve the quality of your software. These are (1) code reviews, a one-on-one or group review of actual code, (2) automated testing of the functionality documented in the specification for the product, and (3) an analysis of which lines in an application were actually run during testing. The Coverage Profiler helps you with this third task. In addition, the Coverage Profiler provides information about how many times a line of code was run, and how long it took-valuable information you can use to improve the performance of your application.
Visual FoxPro's Coverage Profiler performs two separate functions for developers interested in improving the quality of their software by looking at what code has actually been run during testing.
The first of these, the Code Logging engine, actually creates a log file that holds all information about which lines are run, in what order, and how long each line takes to execute. However, by itself, this log file isn't very interesting. Rather, it's interesting, but it's also really, really big, and it's just about impossible to digest it through visual inspection. It's the type of data that just screams out for an automated tool to suck it in and spit back out a variety of reports that are much more readable.
To get to this point, however, you have to configure the Coverage Profiler to do what you want it to do.
Quick start with the Coverage Profiler
You can configure the Coverage Profiler in a number of ways. I'll start off with the basics and then show you how to customize it.
To follow along, you'll need an application to run the Coverage Profiler against-you can use the sample applications in previous chapters (such as Chapter 15), or you can pick your own application if you like.
Basic configuration
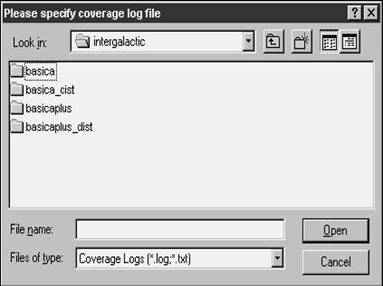
If you're like most developers, you probably started up the Coverage Profiler by selecting the Tools, Coverage Profiler menu option, and were immediately greeted by a message that required you to select an existing log file, as shown in Figure 21.1.
Unfortunately, because this is the first time you started the Coverage Profiler, you didn't have a log file, so you clicked Cancel and gave up on the Coverage Profiler in frustration. I agree that this is sort of a lame interface. What's happening is that you're running the reporting application instead of starting the logging engine. Here's how to really get started.
Step 1: Start the code logging engine
First, you need to get the code logging engine started. You do this by specifying a log file that will hold all of the coverage profiling information. You can specify a log file in one of two ways: by using SET COVERAGE or by using the Debugger.
Use SET COVERAGE
Issue the following command in the Command window:
set coverage to MYLOG.LOG
You can also do this in your code-perhaps bracketed by some "Developer Only" switch-if you don't want to log every line from the start of your app.
Use the Debugger
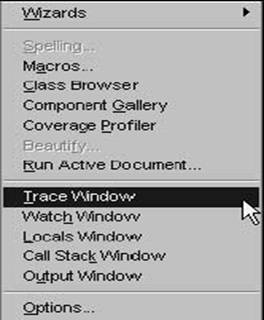
The second way to specify a log file is to use the Debugger. However, you can only get to the Coverage Profiler options in the Debugger if it's set up in a separate frame, or through the Debugger toolbar if you have one of the five Debug windows open. You can tell whether you have the Debugger in the FoxPro frame or a separate frame by opening the Tools menu. If all five debug windows are shown in the Tools menu, as shown in Figure 21.2, the Debugger is set to a FoxPro frame.
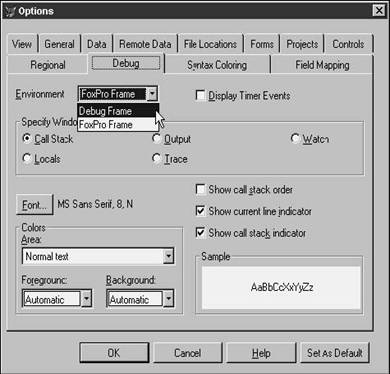
To switch to a separate frame, open the Options dialog by selecting the Tools, Options menu option and select the Debug tab. Then select the Debug Frame option in the Environment combo box, as shown in Figure 21.3.
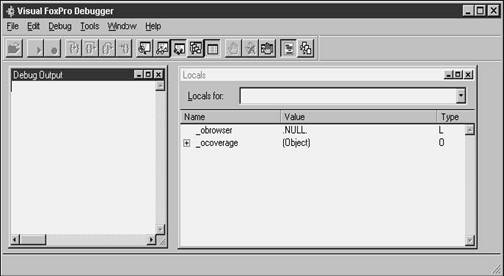
Now, there is only one menu option in the Tools menu-Debugger. When you select it, you'll get a completely separate window-outside the Visual FoxPro application window as shown in Figure 21.4. See Chapter 20 on the Debugger for more information.
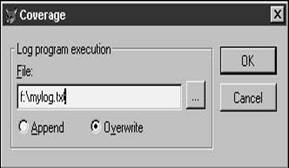
Once you launch the Debugger in a separate frame, you'll have access to the Debugger Tools menu. Select the Tools, Coverage Logging menu option or the Toggle Coverage Logging button in the Debugger toolbar to open the Coverage dialog as shown in Figure 21.5. You can enter your own log file name, select an existing log file by clicking the ellipsis button, and choose whether to append new information to existing information or to overwrite the log file from scratch.
Step 2: Run your app
This might seem obvious, but now that you've turned on coverage logging, you'll need to start your app-and run the parts of it that you want to log.
Step 3: Turn off code logging
So now that you've got your data on your application, how to you turn off code logging? The easiest way is to issue the following command in the Command window, and be done with it.
set coverage to
You can also quit VFP, and when you start up again, code logging will be stopped.
Basic reports
If you take a look at your log file, say, in Windows Explorer, you'll find that it's a huge file. Just starting up a prototype of an application I've been working on, logging on, and shutting down creates a file of over 200K!
If you open it up, you'll see something like Figure 21.6.
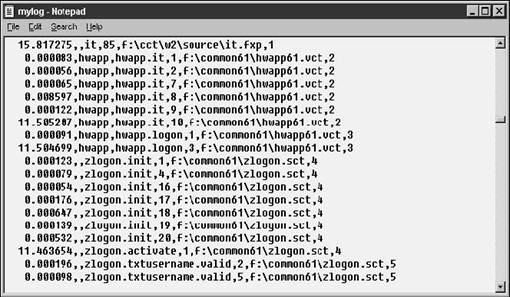
Each line has the same format: a comma-delimited list of values:
. . Execution time
. . Class executing the code
. . Object, method, or procedure in which the code is found or called
. . Line number within the method or procedure
. . Fully qualified file name
. . Call stack level
Although the Coverage Profiler existed in VFP 5.0, the Call Stack Level value was added in VFP 6.0. And if you've not taken my advice and grabbed SP3 for Visual Studio, you'll miss a pretty nice enhancement that has to do with the Coverage Profiler. The precision of the execution time value has been increased to six digits. This can be particularly handy when you're timing particularly fast commands or operations.
And there can be literally hundreds of thousands or millions of lines like this. The Coverage Profiler digests this information and allows you to create a number of reports that give you the information you want in a more easily understandable format.
Getting the Coverage Profiler to process a log file
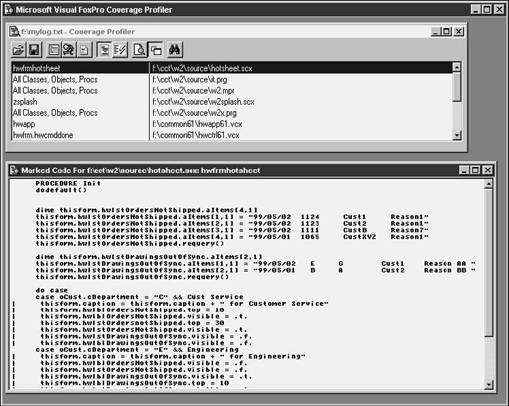
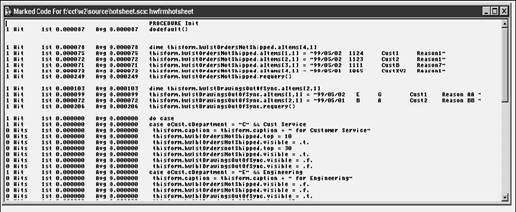
Now it's time to run the Coverage Profiler from the Tools menu in the Visual FoxPro window. You'll be asked to select a log file, and then the Coverage Profiler will do its thing. It will crank for a while (depending on how big the file is, of course), flash a few messages in the upper right corner through WAIT WINDOW commands, and then display the results in the Coverage Profiler window, as shown in Figure 21.7.
There's actually a lot of options here-I'll walk through them one by one.
Source List and Source Code panes
Two windows appear when you open the Coverage Profiler. The top window, a two-column affair, is the Source List pane, and its purpose is to list discrete items that can be selected for analysis. For example, each class or program (shown as an "All Classes, Objects, Procs" item) is available in the left column. The source file for the class or program is displayed in the right column.
The bottom window is the Source Code pane, and, as you might have guessed, displays the source code for the particular item selected in the Source List pane. The display of the Source Code pane changes according to options you select; I'll get to this in a second.
The Coverage Profiler toolbar
The toolbar on top of the Source List pane contains 10 buttons:
. . Open-Opens a new log file for profiling.
. . Save-Saves the coverage results to a table of your choosing.
. . Statistics-Opens the Statistics dialog.
. . Add-Ins-Adds an Add-In to the Coverage Profiler.
. . Options-Opens the Coverage Profiler Options dialog.
. . Coverage Mode-Toggles the Source Code pane to Coverage Mode.
. . Profile Mode-Toggles the Source Code pane to Profile Mode.
. . Preview Mode-Toggles the Source Code pane to Preview Mode.
. . Zoom Mode-Toggles the Source Code pane to Zoom Mode.
. . Find-Opens the Find dialog.
These are each covered in more depth shortly.
The Coverage Profiler context (shortcut) menu
Right-clicking any component of the Coverage Profiler (the toolbar or either of the Source panes) brings forward the Coverage Profiler context menu, as shown in Figure 21.8.
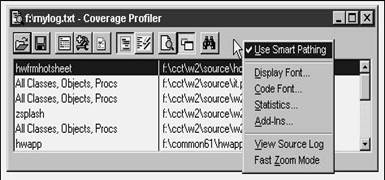
This menu has the following options:
. Use Smart Pathing-By default, the Coverage Profiler will prompt you to locate source files referenced in the coverage log. You can have the Coverage Profiler assume that folders that you've selected contain additional source files that it is
looking for. If you have multiple files with the same name in different folders, you might not want to check this option.
. . Cascade Windows-If you are running the Coverage Profiler in its own frame, clicking this option will cascade the Source List and Source Code panes, and any other windows that might be open. Note that this menu option doesn't appear in Figure 21.8, because I was not running the Coverage Profiler in its own frame for this shot.
. . Display Font-Allows you to choose the font for the Source List pane.
. . Code Font-Allows you to choose the font for the Source Code pane.
. . Statistics-Opens the Statistics dialog.
. . Add-Ins-Allows you to add an Add-In.
. . View Source Log-Opens the raw log file.
. . Fast Zoom Mode-Displays source code of marked files as soon as you click the file in the Source List pane. When you select an unmarked file, you must first double-click the file in the Source List pane to view the associated source code in the Source Code pane. You must be in Zoom mode or this menu option will be disabled.
Coverage Profiler options
You can configure how the Coverage Profile will operate by setting options in the Coverage Profiler Options dialog, as shown in Figure 21.9.
Options
Checking the Use Smart Pathing check box will perform the same function as selecting the Use Smart Pathing menu option in the Coverage Profiler context menu. Checking the Register Add-Ins when run check box will automatically register an Add-In with the Coverage Profiler the first time you run it. The Register this Add-In after running check box in the Coverage Profiler Add-Ins dialog will automatically be checked. Checking the Mark all code while log loads check box will mark each line of code as appropriate while the Coverage Profiler processes the log file. If you have a lot of large files, this can slow down the initial load of the Coverage Profiler. On the other hand, once it's done, it's done!
Coverage marks
You can choose which characters appear to the left of each line of executed or not executed code in the Source Code pane. By default, every line that was not executed is marked with a vertical bar (or pipe). However, some lines, such as comments, are not marked as executed, and thus it can be difficult to scan through a listing and easily distinguish between executed lines and simple comments. You can use different length strings, such as "E >>>" for Executed and "|" for not executed-two spaces will be added to the single character pipe so that the display of the code remains consistent.
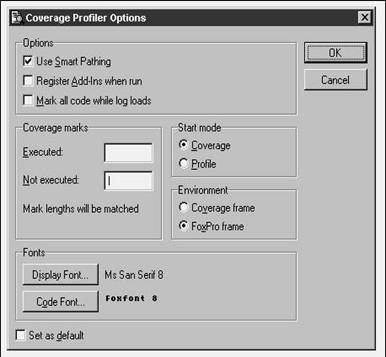
Fonts
You can choose the fonts you want to display in the Source List pane and Source Code pane- these buttons work the same as their counterparts in the Coverage Profiler's context menu.
Start mode
You can choose for the Coverage Profiler to display the Source Code pane in either Coverage mode or Profile mode. You might want to consider using Profile mode, because you can get all of the information in Coverage mode (code that wasn't executed is listed with "0 hits") plus additional information-the time required for execution.
Environment
You can choose for the Coverage Profiler to display in its own window, separate from the Visual FoxPro window (Coverage frame), or within the Visual FoxPro environment (FoxPro frame). This is just like the choice you have with the Debugger.
Set as default
This is yet another example of an inconsistent (and dopey) user interface. There are about five different ways to save the settings you select in one dialog or another as your default settings- and no two ways are the same. If you want the changes you make in the Coverage Profiler Options dialog to be saved, check this check box and then click the OK button. If you make changes in the Options dialog and click OK without checking this check box, the settings will persist just for the current session of the Coverage Profiler, not the current Visual FoxPro session. The Coverage Profiler Options settings are saved in the Windows Registry.
Coverage mode vs. Profile mode
You can select whether you want to display the results of the Profiler (the contents of the Source Code pane) in Coverage mode or Profile mode.
Coverage mode
Coverage means that you'll see which lines of code were executed and which were not. Figure
21.7 shows you the display of a class in Coverage mode.
Profile mode
Profile mode allows you to determine how long each line of code took to execute. Figure 21.10 shows you the same class in Profile mode.
Zoom mode vs. Preview mode
You can select whether you want to display the results of the Profiler (the contents of the Source Code pane) in Zoom mode or Preview mode.
Zoom mode
Zoom mode displays the Source Code pane in a separate window that can be resized independently of the Source List pane. You can also select Fast Zoom (described later) in Zoom mode.
Preview mode
Preview mode displays the Source Code pane in a window that is docked with the Source List pane. Fast Zoom is not available in Preview mode.
Statistics
You don't necessarily want to go through every item in the Source List just to determine which lines of code haven't been run, do you? The Statistics dialog allows you to get a bird's eye view of the results of the Coverage Profiler's work. See Figure 21.11.
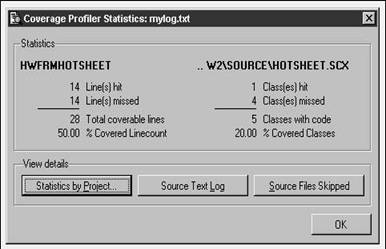
There are four pieces to the Statistics dialog. The first simply displays a summary of the number of lines of code, the classes the Coverage Profiler hit, and how many it missed. If you get 100% in both of these areas, you're probably in pretty good shape, but if you've got a lot of misses, you need to do more testing.
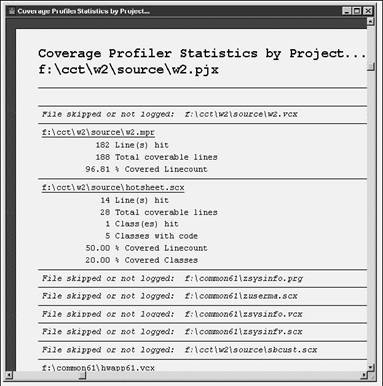
Clicking the Statistics by Project button will open a dialog asking you to pick the project file, and will then open a report that displays the contents of the project file, together with statistics on each file in the project. See Figure 21.12.
You can view the raw log file by clicking the Source Text Log button, or see a list of source files skipped (in a browse window) by clicking Source Files Skipped.
Find
So far, you've seen how each tool works, but not much as far as real-life needs. The Find button-also new in Visual Studio SP3-is one of those features that you don't know you need until you need it. Think about two common situations that are likely to happen when you're using the Coverage Profiler. One is when you're looking for a chunk of code that you don't think has been executed. A second is when you're trying to determine why a particular module or function is running so slowly. In both cases, you might suspect a specific area of the code. With the Find button, you can look for a keyword or phrase in that area of the code and move right to it, instead of having to wade through possibly pages and pages of code to find the area of interest.
Clicking the Find button opens the Find dialog as shown in Figure 21.13.
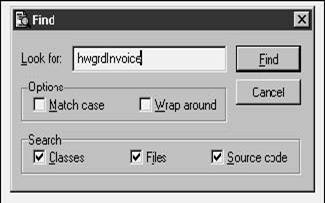
You can, of course, choose to match case by selecting the Match case check box. If you start your search in the middle of a file, you can have the Find mechanism continue its search at the beginning of the file once it reaches the end by selecting the Wrap around check box.
You can choose which items to search in-any combination of classes, files, and source code.
Open
Once you've loaded the Coverage Profiler, it would be a waste if you had to close it just to examine a different log file. This button allows you to close the current log file and open another one.
Save
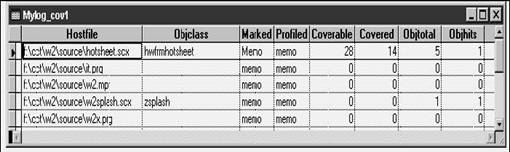
You might want to save the results of the Coverage Profiler to a table of your choosing. Clicking the button will display a dialog prompting you for a table name, and provide a default value for you. The structure of the table is shown in Figure 21.14.
The Marked and Profiled memo fields contain the text of the Source Code panes in Coverage and Profile modes. If you think about it, COVERAGE.APP is essentially a user interface for this table, much like the Form Designer is a user interface for an .SCX table.
Customizing the Coverage Profiler with Add-Ins
An Add-In is a Visual FoxPro program that adds or changes the functionality of the Coverage Profiler. You can create your own Add-Ins to add additional controls, reports, modified user interfaces, and other enhancements to the Coverage Profiler.
Instead of repeating work that's been done elsewhere, however, I'll point you to a pair of great resources. First, check out Markus Egger's Coverage Snippet Analyzer, available at www.eps-software.com, for one example of an Add-In. Second, Lisa Slater's excellent article on subclassing the Coverage Engine tells you all you'll ever want to know about the subject. It's available at
https://msdn.microsoft.com/vfoxpro/technical/articles/applications.asp
You might want to grab the source code for the Coverage Profiler (as well as the source for other VFP tools) from XSOURCE.ZIP-found in the VFP98TOOLSXSOURCE directory.
|
Politica de confidentialitate | Termeni si conditii de utilizare |

Vizualizari: 1958
Importanta: ![]()
Termeni si conditii de utilizare | Contact
© SCRIGROUP 2025 . All rights reserved